A thin wire of length l is carrying a constant current. The wire is bent to form a circular coil. If radius of the coil, thus formed, is equal to R and number of turns in it is equal to n, then which of the following graphs represent (s) variation of magnetic field induction (B) at centre of the coil
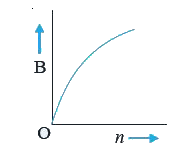
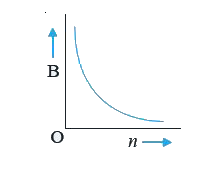
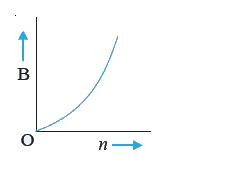
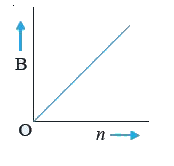
The correct Answer is:3
To solve the problem, we need to determine the variation of the magnetic field induction (B) at the center of a circular coil formed by bending a thin wire of length L carrying a constant current I. The coil has n turns and a radius R.
1. Understanding the Length of the Wire:
The total length of the wire is given as L. When the wire is bent to form a circular coil with n turns, the relationship between the length of the wire and the radius of the coil can be expressed as:
L=n⋅(2πR)
This equation states that the total length of the wire L is equal to the number of turns n multiplied by the circumference of each turn (2πR).
2. Expressing Radius in Terms of L and n:
From the equation above, we can express the radius R in terms of L and n:
R=L2πn
3. Magnetic Field at the Center of the Coil:
The magnetic field B at the center of a circular coil with n turns carrying a current I is given by the formula:
B=μ0nI2R
where μ0 is the permeability of free space.
4. Substituting for R:
Now, substituting the expression for R from step 2 into the magnetic field formula:
B=μ0nI2(L2πn)=μ0nI⋅2πn2L
Simplifying this gives:
B=μ0πIn2L
5. Identifying the Relationship:
From the equation B=kn2 (where k=μ0πIL), we see that the magnetic field B is proportional to the square of the number of turns n. This indicates that as the number of turns increases, the magnetic field increases quadratically.
6. Graph Representation:
The relationship B∝n2 suggests that if we plot B against n, the graph will be a parabola opening upwards. Therefore, the correct graph representing the variation of magnetic field induction at the center of the coil is a parabola.
Conclusion:
The correct option is the graph that represents a parabola facing upwards, indicating that the magnetic field induction B increases with the square of the number of turns n.
The total length of the wire is given as L. When the wire is bent to form a circular coil with n turns, the relationship between the length of the wire and the radius of the coil can be expressed as:
L=n⋅(2πR)
This equation states that the total length of the wire L is equal to the number of turns n multiplied by the circumference of each turn (2πR).
From the equation above, we can express the radius R in terms of L and n:
R=L2πn
The magnetic field B at the center of a circular coil with n turns carrying a current I is given by the formula:
B=μ0nI2R
where μ0 is the permeability of free space.
Now, substituting the expression for R from step 2 into the magnetic field formula:
B=μ0nI2(L2πn)=μ0nI⋅2πn2L
Simplifying this gives:
B=μ0πIn2L
From the equation B=kn2 (where k=μ0πIL), we see that the magnetic field B is proportional to the square of the number of turns n. This indicates that as the number of turns increases, the magnetic field increases quadratically.
The relationship B∝n2 suggests that if we plot B against n, the graph will be a parabola opening upwards. Therefore, the correct graph representing the variation of magnetic field induction at the center of the coil is a parabola.
The correct option is the graph that represents a parabola facing upwards, indicating that the magnetic field induction B increases with the square of the number of turns n.
Topper's Solved these Questions
- MOVING CHARGES & MAGNETISM BOOK - VMC MODULES ENGLISHCHAPTER - MOVING CHARGES & MAGNETISM EXERCISE - PRACTICE EXERCISE 10
5 Videos
- MOVING CHARGES & MAGNETISM BOOK - VMC MODULES ENGLISHCHAPTER - MOVING CHARGES & MAGNETISM EXERCISE - PRACTICE EXERCISE6
1 Videos
- MOVING CHARGES & MAGNETISM BOOK - VMC MODULES ENGLISHCHAPTER - MOVING CHARGES & MAGNETISM EXERCISE - PRACTICE EXERCISE 8
5 Videos
- Motion in Two DimensionsBOOK - VMC MODULES ENGLISHCHAPTER - Motion in Two DimensionsEXERCISE - MCQ
2 Videos
- PROPERTIES OF MATTERBOOK - VMC MODULES ENGLISHCHAPTER - PROPERTIES OF MATTEREXERCISE - JEE Advanced (Archive) Level - 2 (MATRIX MATCH TYPE)
1 Videos
Similar Questions
A wire of length 2 m carrying a current of 1 A is bend to form a circle. The magnetic moment of the coil is (in Am2)
View SolutionA conductor of length L and carrying current i is bent to form a coil of two turns.Magnetic field at the centre of the coil will be
View SolutionA circular coil of 200 mm diameter is made of 100 turns of thin wire and carries a current of 50 mA. Find the magnetic field induction at the centre of the coil.
View SolutionA wire of length l is used to form a coil. The magnetic field at its centre for a given current in it is minimum if the coil has
View SolutionOn meter length of wires carriers a constant current. The wire is bent to from a circular loop. The magnetic field at the centre of this loop is B. The same is now bent to form a circular loop of smaller radius to have four turns in the loop. The magnetic field at the centre of this loop B. The same is now bent to form a circular loop of smaller radius of have four turns in the loop. The magnetic field at the centre of this new loop is
View SolutionA wire is bent in the form of a circular arc of radius r with a straight portion AB. If the current in the wire is i, then the magnetic induction at point O is
View SolutionA circular coil is in y−z plane with centre at origin. The coil is carrying a constant current. Assuming direction of magnetic field at x=–25cm to be positive direction of magnetic field, which of the following graphs shows variation of magnetic field along x-axis
View SolutionTwo circular coils are made of two identicle wires of length 20 cm. One coil has number of turns 9 and the other has 3. If the same current flows through the coils then the ratio of magnetic fields of induclion at their centres is
View SolutionA length of wire carries a steady current. It is first bent to form a circular coil of one turn. The same length is now bent more sharply to give a loop of two turns of smaller radius. The magentic field at the centre caused by the same current now will be
View SolutionThe ratio of magnetic inductions at the centre of a circular coil of radius a and on its axis at a distance equal to its radius, will be-
View Solution
