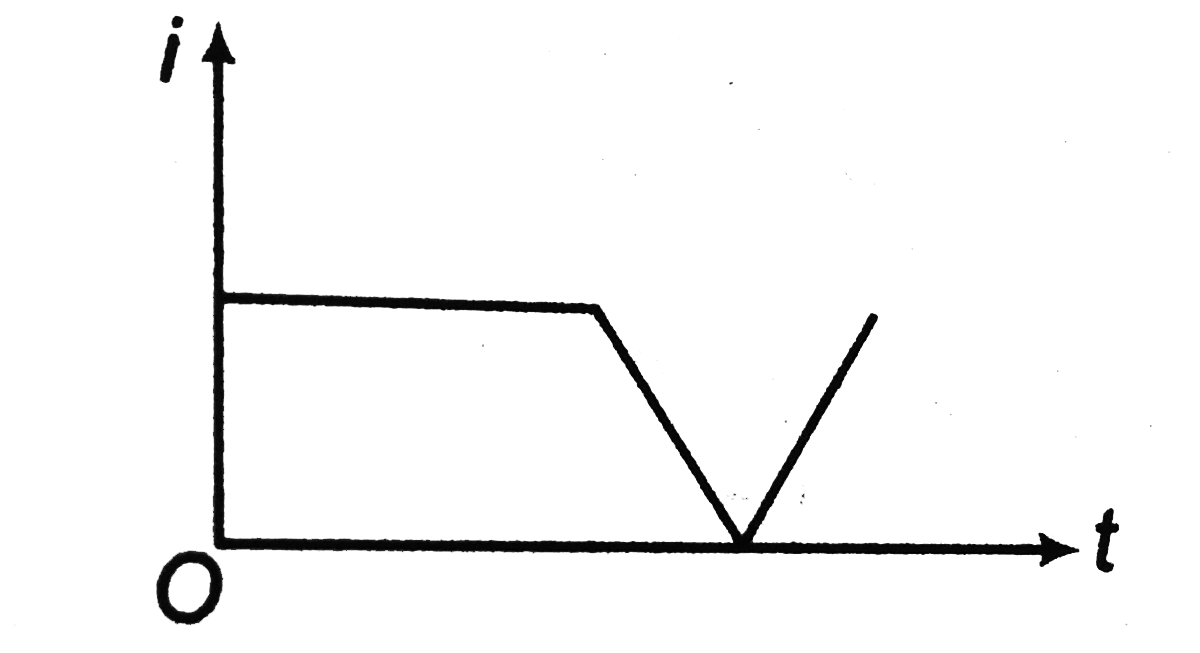
The magnetic flux through a coil varies with timet as shown in the diagram. Which graph best represents the variation of the e.m.f. E induced in the coil with time t?


The correct Answer is:C
Step by step video & image solution for The magnetic flux through a coil varies with timet as shown in the diagram. Which graph best represents the variation of the e.m.f. E induced in the coil with time t? by Physics experts to help you in doubts & scoring excellent marks in Class 12 exams.
Updated on:21/07/2023Topper's Solved these Questions
- ELECTROMAGNETIC INDUCTIONBOOK - AAKASH INSTITUTE ENGLISHCHAPTER - ELECTROMAGNETIC INDUCTIONEXERCISE - ASSIGNMENT(SECTION - B) (OBJECTIVE TYPE QUESTIONS)
25 Videos
- ELECTROMAGNETIC INDUCTIONBOOK - AAKASH INSTITUTE ENGLISHCHAPTER - ELECTROMAGNETIC INDUCTIONEXERCISE - ASSIGNMENT(SECTION -C) Previous Years Questions
34 Videos
- ELECTROMAGNETIC INDUCTIONBOOK - AAKASH INSTITUTE ENGLISHCHAPTER - ELECTROMAGNETIC INDUCTIONEXERCISE - EXERCISE
30 Videos
- ELECTRIC CHARGES AND FIELDS BOOK - AAKASH INSTITUTE ENGLISHCHAPTER - ELECTRIC CHARGES AND FIELDS EXERCISE - comprehension
3 Videos
- ELECTROMAGNETIC WAVESBOOK - AAKASH INSTITUTE ENGLISHCHAPTER - ELECTROMAGNETIC WAVESEXERCISE - ASSIGNMENT SECTION - D Assertion-Reason Type Questions
25 Videos
Similar Questions
The magnetic flux through a coil varies with time as ϕ=5t2+6t+9 The ratio of emf at t = 3 s to t = 0 s will be
View SolutionThe current in a coil varies with time as shown in the figuro. The variation of induced emf with time would be
View SolutionThe magnetic flux through a coil varies with time as ϕ=5t2−6t+9. The ratio of E.M.F. at t=0s to t=0.5s will be
View SolutionThe current i in an induction coil varies with time t according to the graph shown in the figure-5.250. Which of the following graphs shows the induced EMF in the coil with time ?

View SolutionThe current i in an inductionn coil varies with time t according to the graph shown in the figure. Which of the following grahs shows athe induced emf (ε) in the coil with time?

View SolutionThe current i in an inductionn coil varies with time t according to the graph shown in the figure. Which of the following grahs shows athe induced emf (ε) in the coil with time?

View SolutionThe magnetic flux linked with a coil is ϕ and the emf induced in it is e.
View SolutionThe current through the coil in figure (i) varies as shown in figure (ii). Which graph best shows the ammeter A reading as a function of time?

View SolutionThe current i in an induction coil varies with time according to the graph shown in figure. Which of the following graph shows induced emf in the coil with time:
View SolutionThe graph shown the variation with times t of the velocity v of an object . Which one of the following graphs best represents the variation of acceleration a of the object with time t?

View Solution
