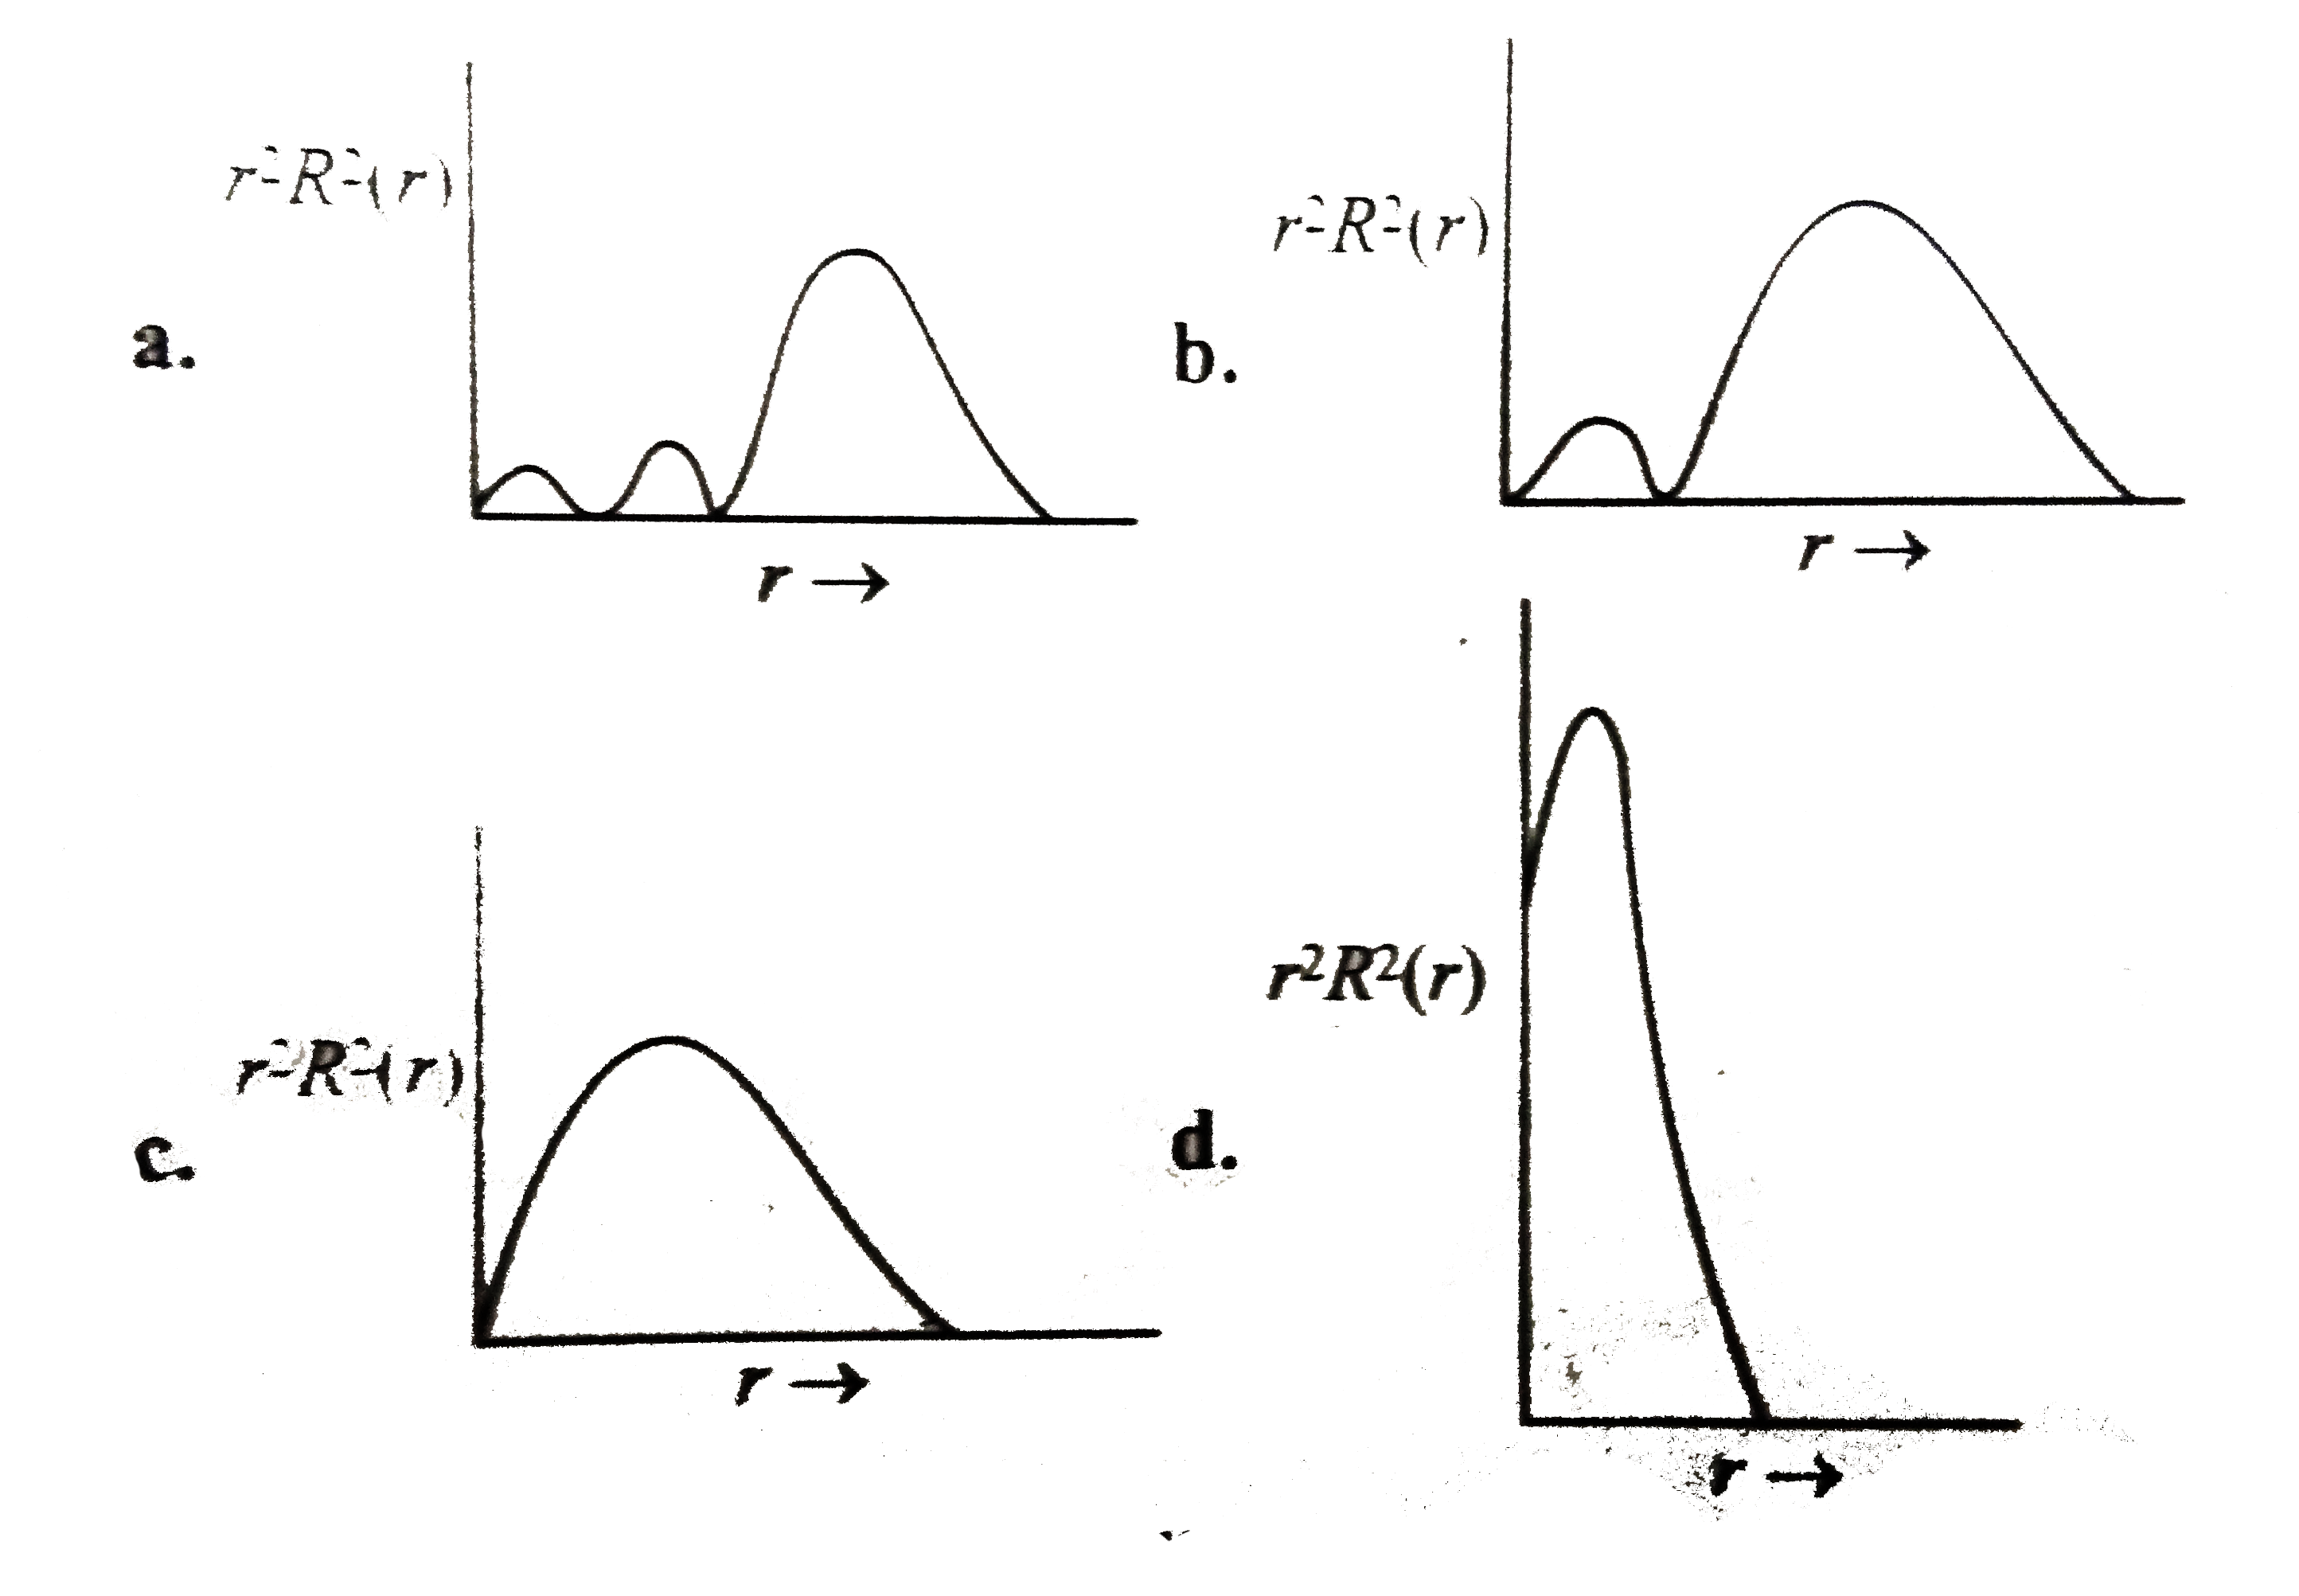
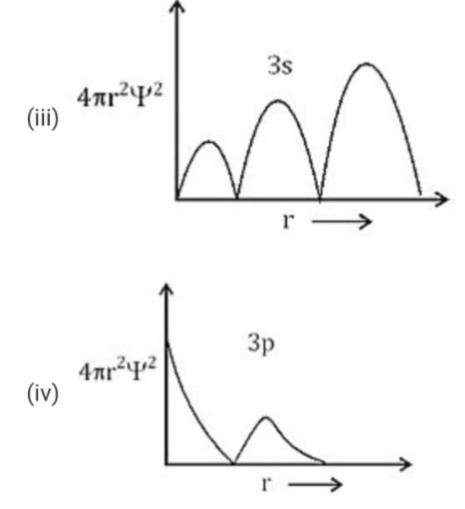
Which of the following radial probability density graph corresponds to for which the least value of is allowed ?
Video Solution
Text Solution
Option c represents the distribution of for H atom
a. Two nodes :.n= 5(High value of n)
b. One node
Zero node
d. Graph does not correspond to any radial distribution curve
|
Topper's Solved these Questions
- ATOMIC STRUCTUREBOOK - CENGAGE CHEMISTRY ENGLISHCHAPTER - ATOMIC STRUCTUREEXERCISE - Exercises (Subjective)
52 Videos
- ATOMIC STRUCTUREBOOK - CENGAGE CHEMISTRY ENGLISHCHAPTER - ATOMIC STRUCTUREEXERCISE - Exercises Linked Comprehension
50 Videos
- APPENDIX - INORGANIC VOLUME 1BOOK - CENGAGE CHEMISTRY ENGLISHCHAPTER - APPENDIX - INORGANIC VOLUME 1EXERCISE - chapter-7 Single correct answer
1 Videos
- CHEMICAL BONDING AND MOLECULAR STRUCTUREBOOK - CENGAGE CHEMISTRY ENGLISHCHAPTER - CHEMICAL BONDING AND MOLECULAR STRUCTUREEXERCISE - Archives Subjective
15 Videos
Similar Questions
Knowledge Check
Find the x value for which l is parallel to m.
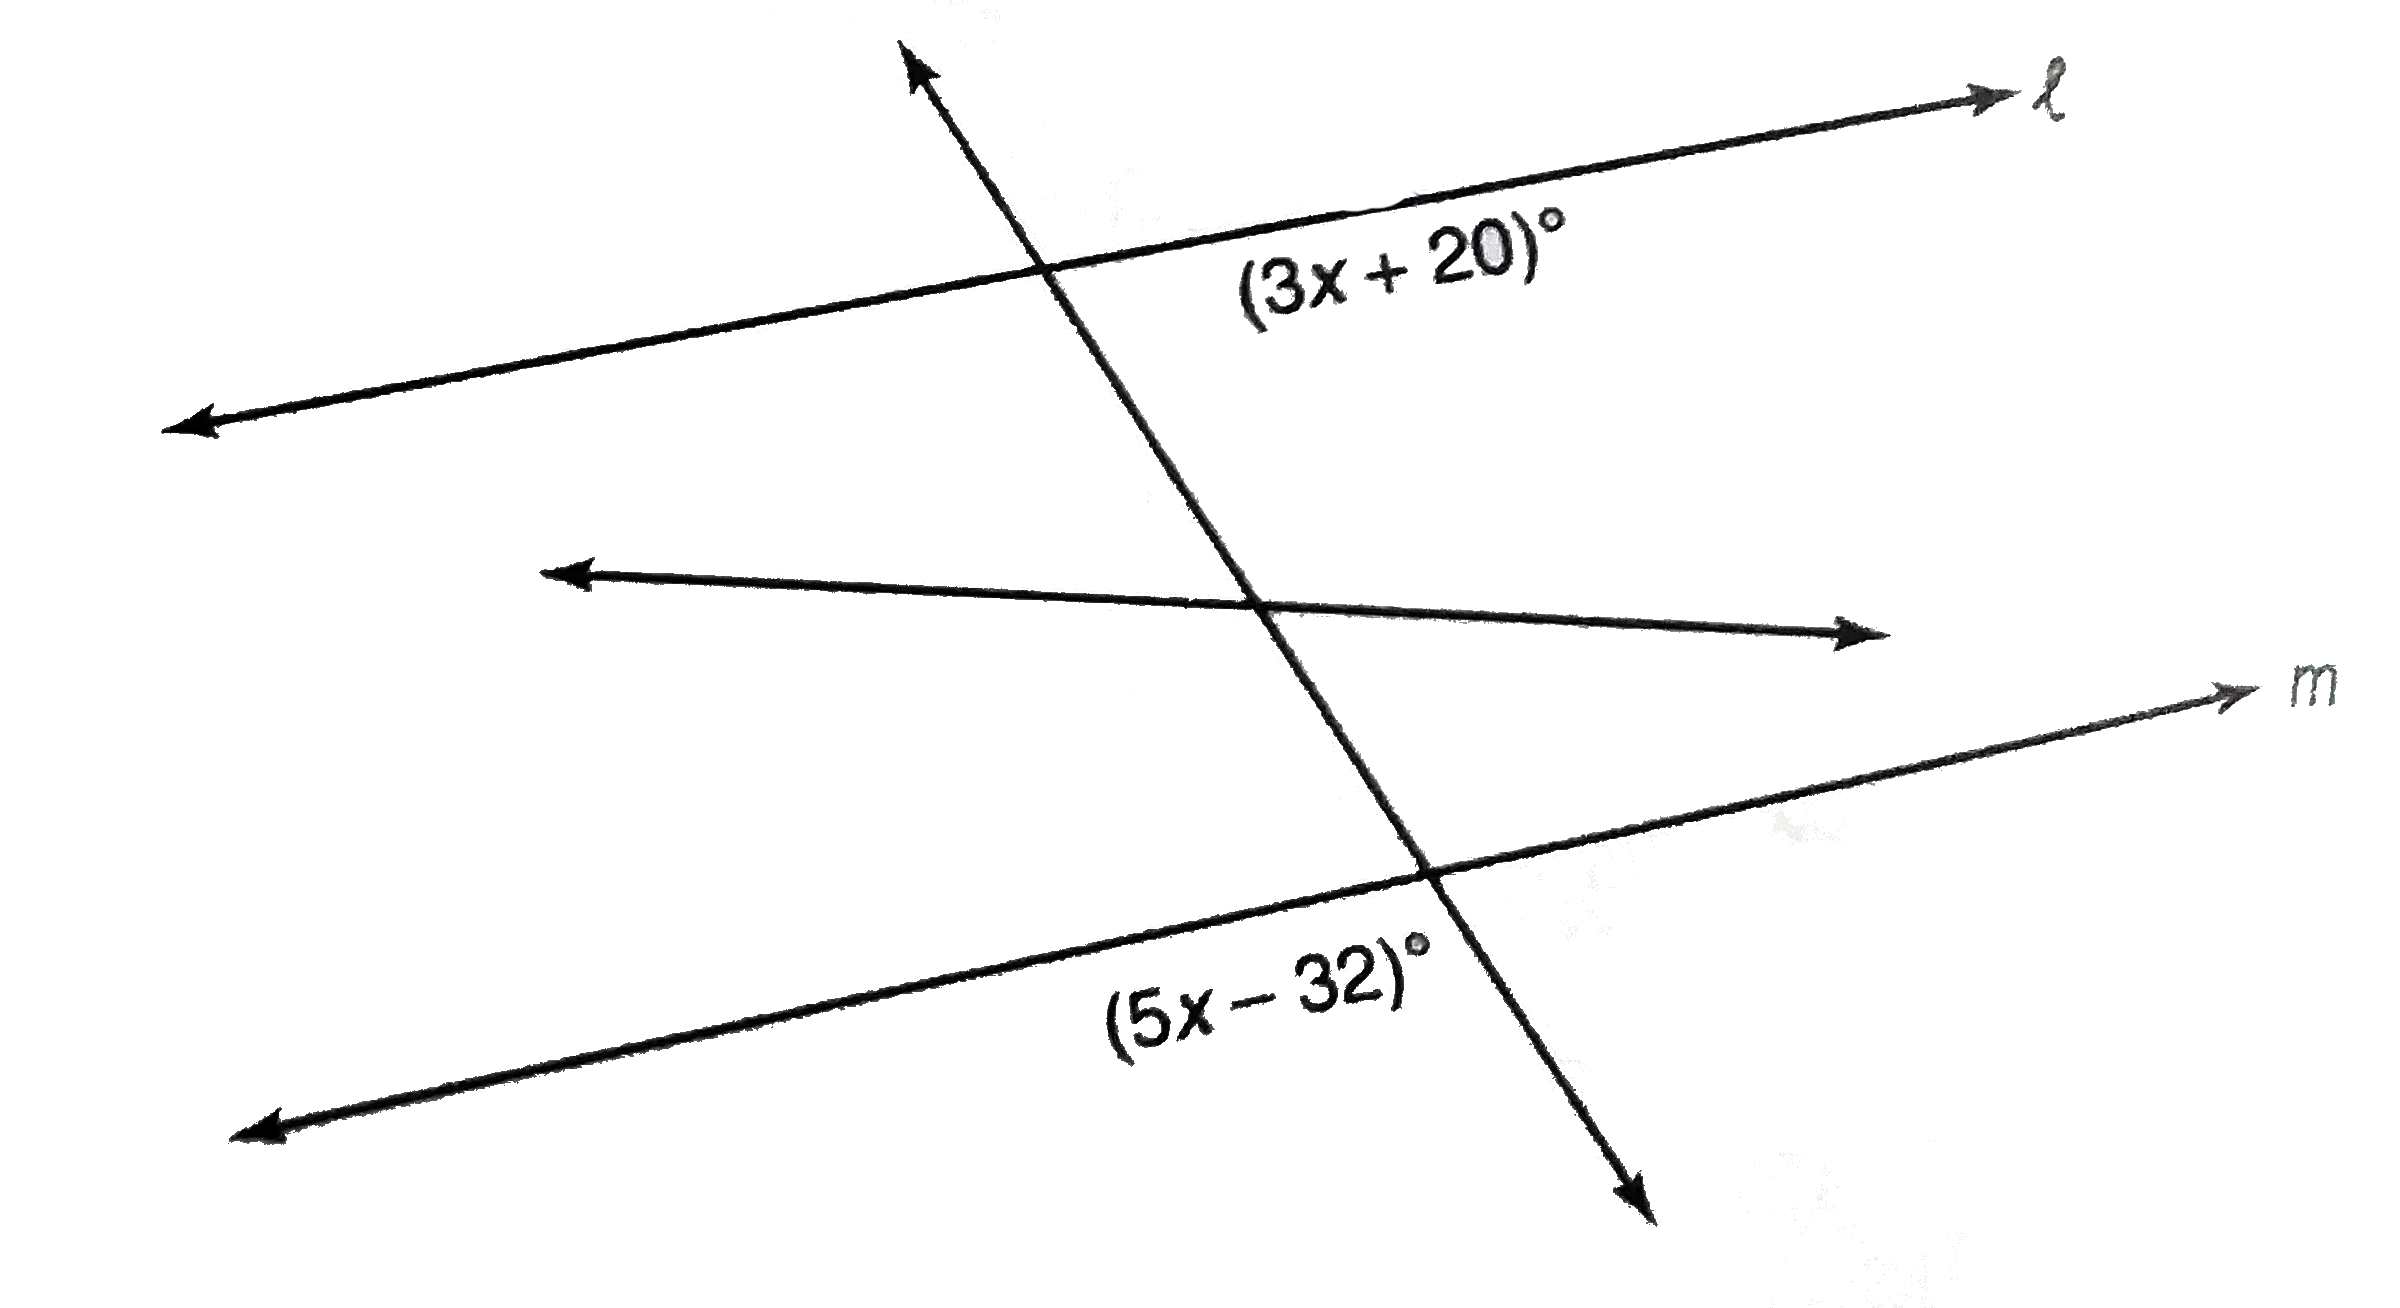 A6B16C20D24
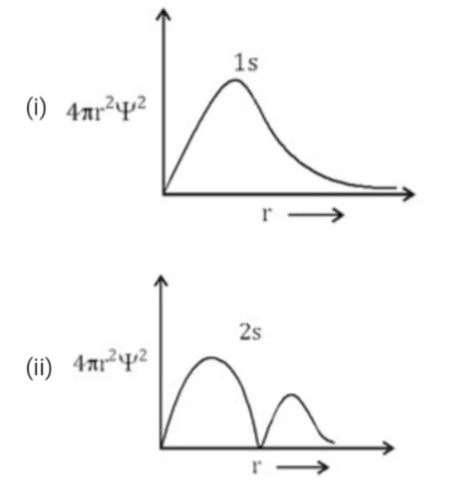
Which of the following plots of radial - probability function 4π2ψ2 is /are correct
View SolutionWhich of the following is associated with the orbital designated by n=2,l=1?
View SolutionWhich of the following graph depicts spring constant k versus length l of the spring correctly
View SolutionWhich of the following compound will not react with l2/OH−.
View SolutionFor n=4 , which one of the following values of l is not possible ?
View SolutionFor n=4 , which one of the following values of l is not possible ?
View SolutionWhich of the following gases will have density of 1.8gL−1 at 760 torr pressure and 27∘C?
View Solution

