Among the plots of PvsV given below, which one corresponds to Boyle's law?
To determine which plot corresponds to Boyle's law among the given options, we can follow these steps:
Step 1: Understand Boyle's Law
Boyle's law states that for a given mass of gas at constant temperature, the pressure (P) of the gas is inversely proportional to its volume (V). Mathematically, this can be expressed as:
P∝1V
or
PV=k
where k is a constant.
Step 2: Analyze the Relationship
Since pressure is inversely related to volume, as the volume of the gas increases, the pressure decreases, and vice versa. This means that if we plot pressure (P) on the y-axis and volume (V) on the x-axis, the graph will show a downward curve.
Step 3: Identify the Graph Type
In a graph where P is plotted against V:
- A straight line indicates a direct relationship (not applicable here).
- A downward curve indicates an inverse relationship, which is what we expect from Boyle's law.
Step 4: Examine the Given Options
Now, we need to look at the provided plots:
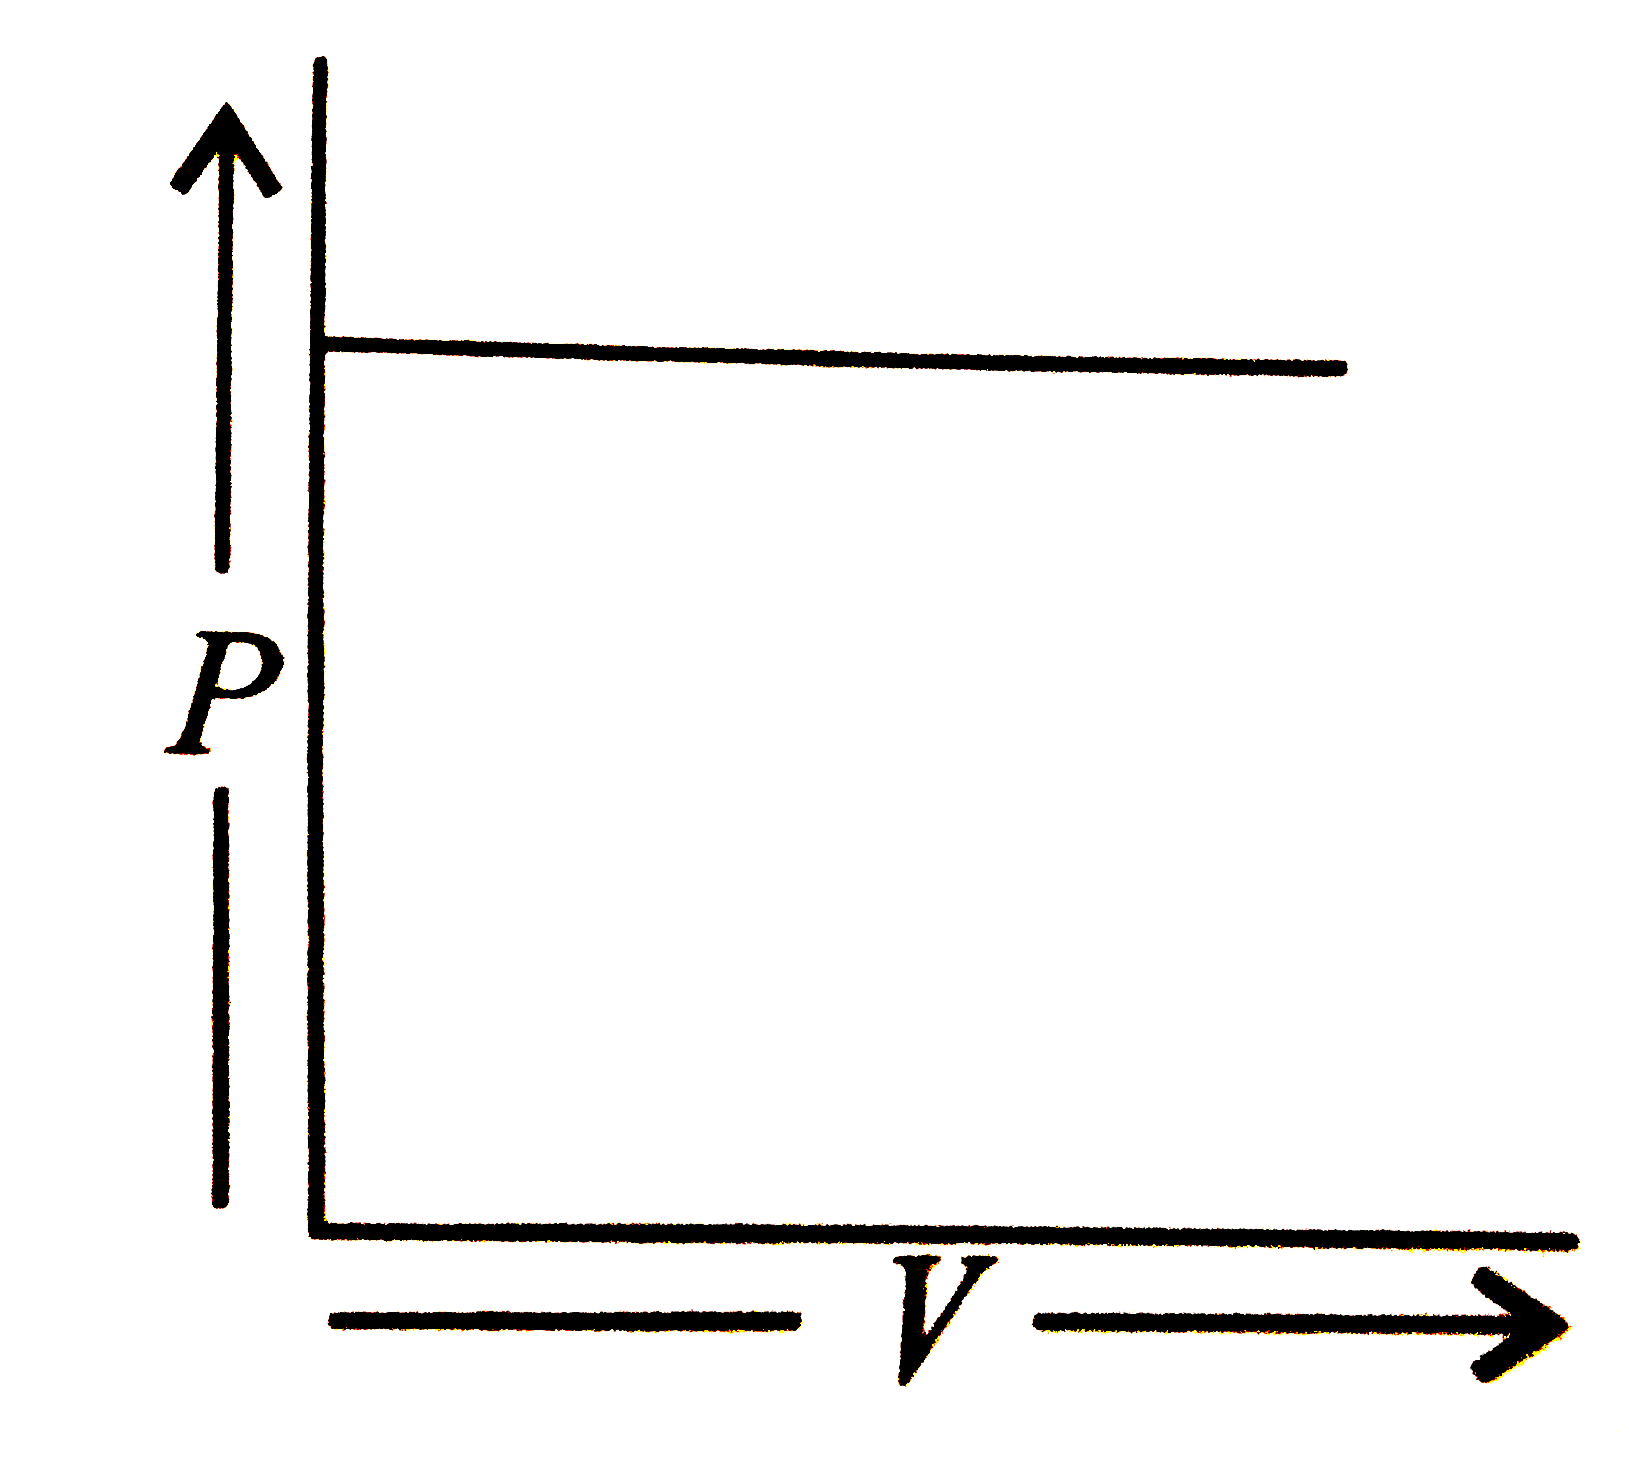
- Option A: If it shows an increase in volume with constant pressure, it does not represent Boyle's law.
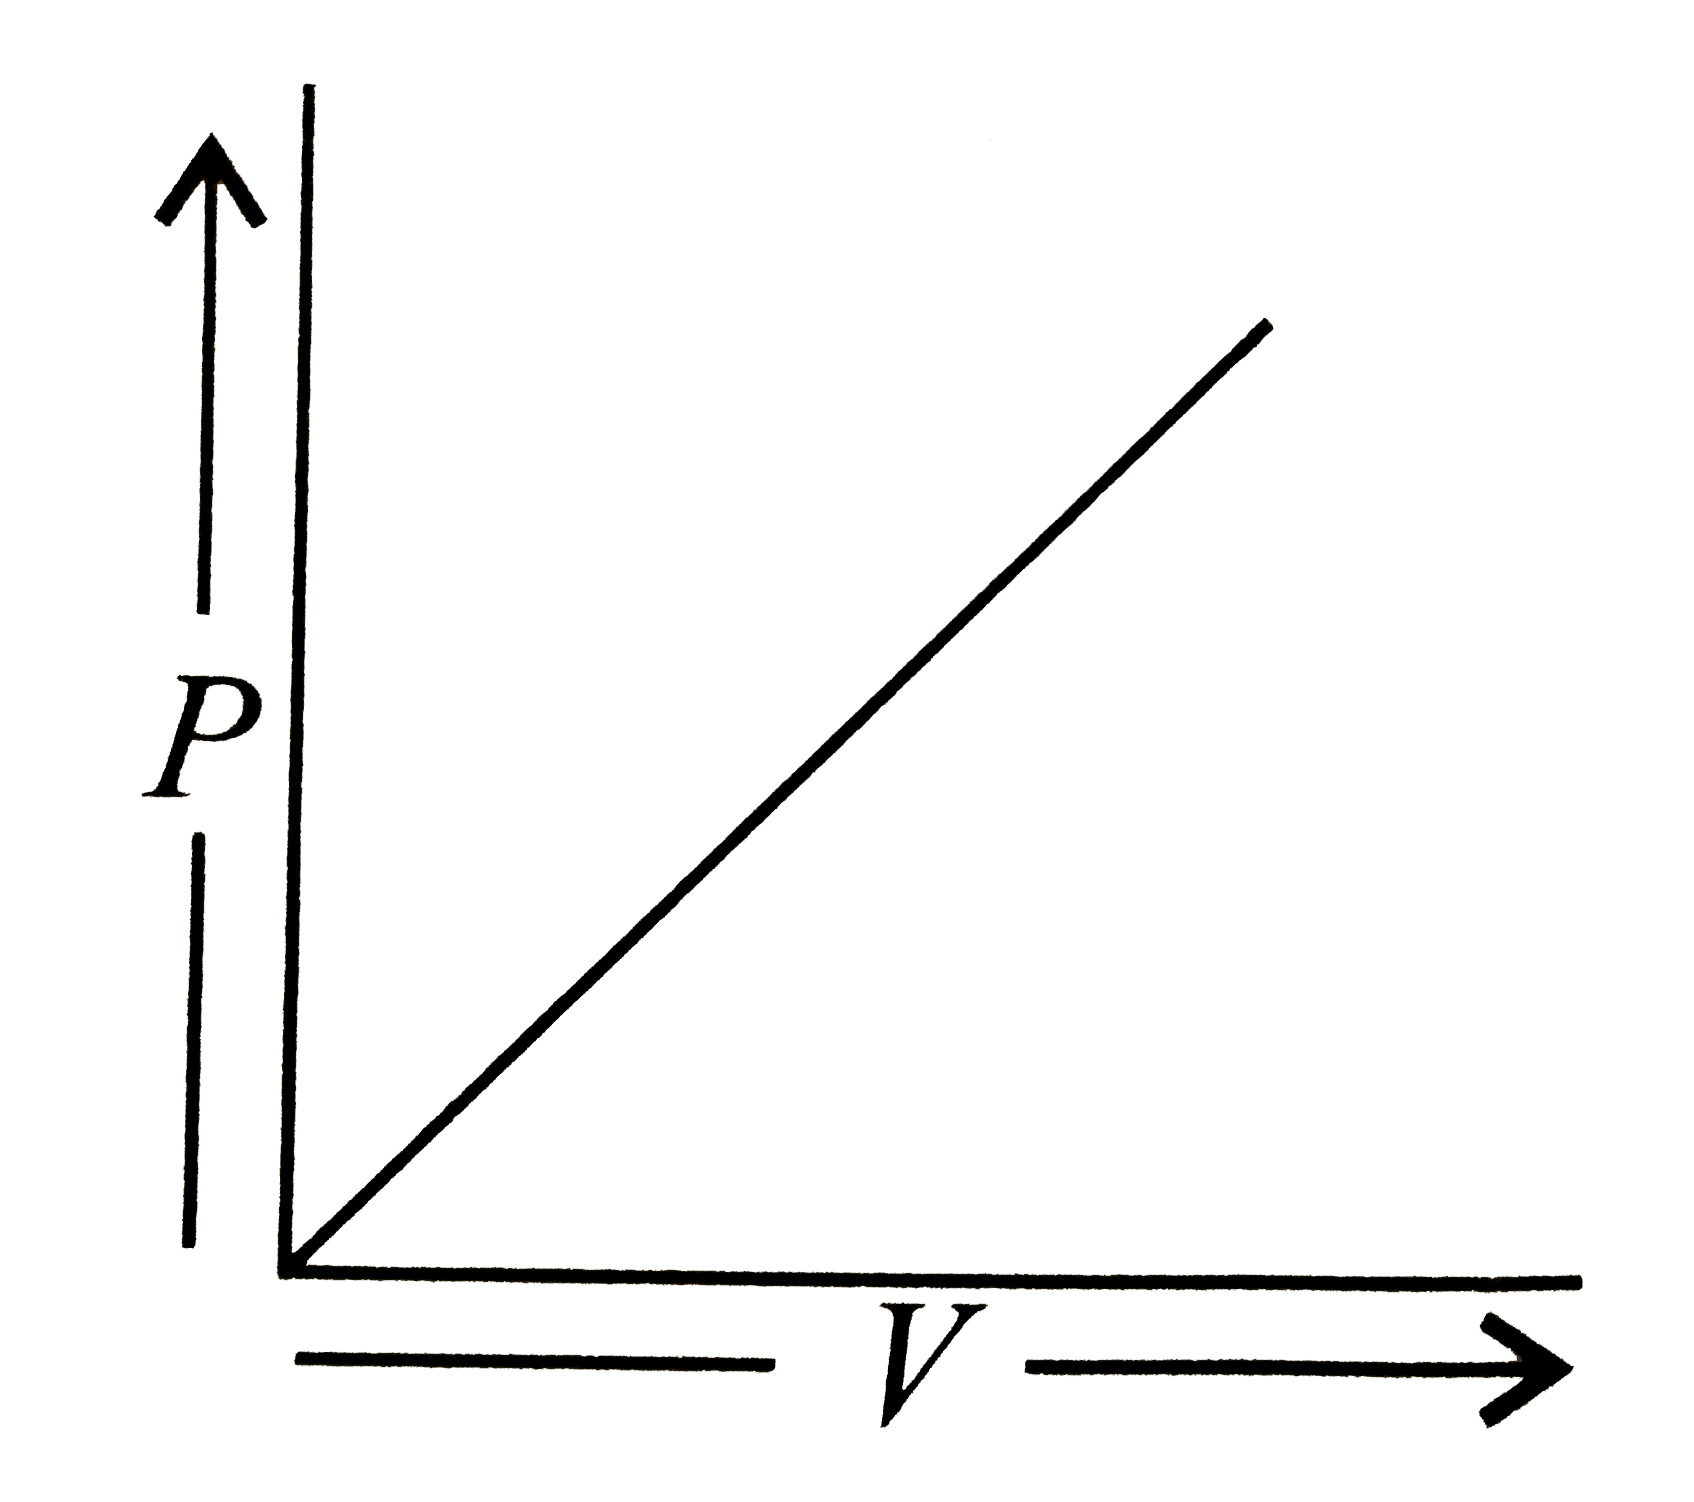
- Option B: If it shows a straight line, it also does not represent Boyle's law.
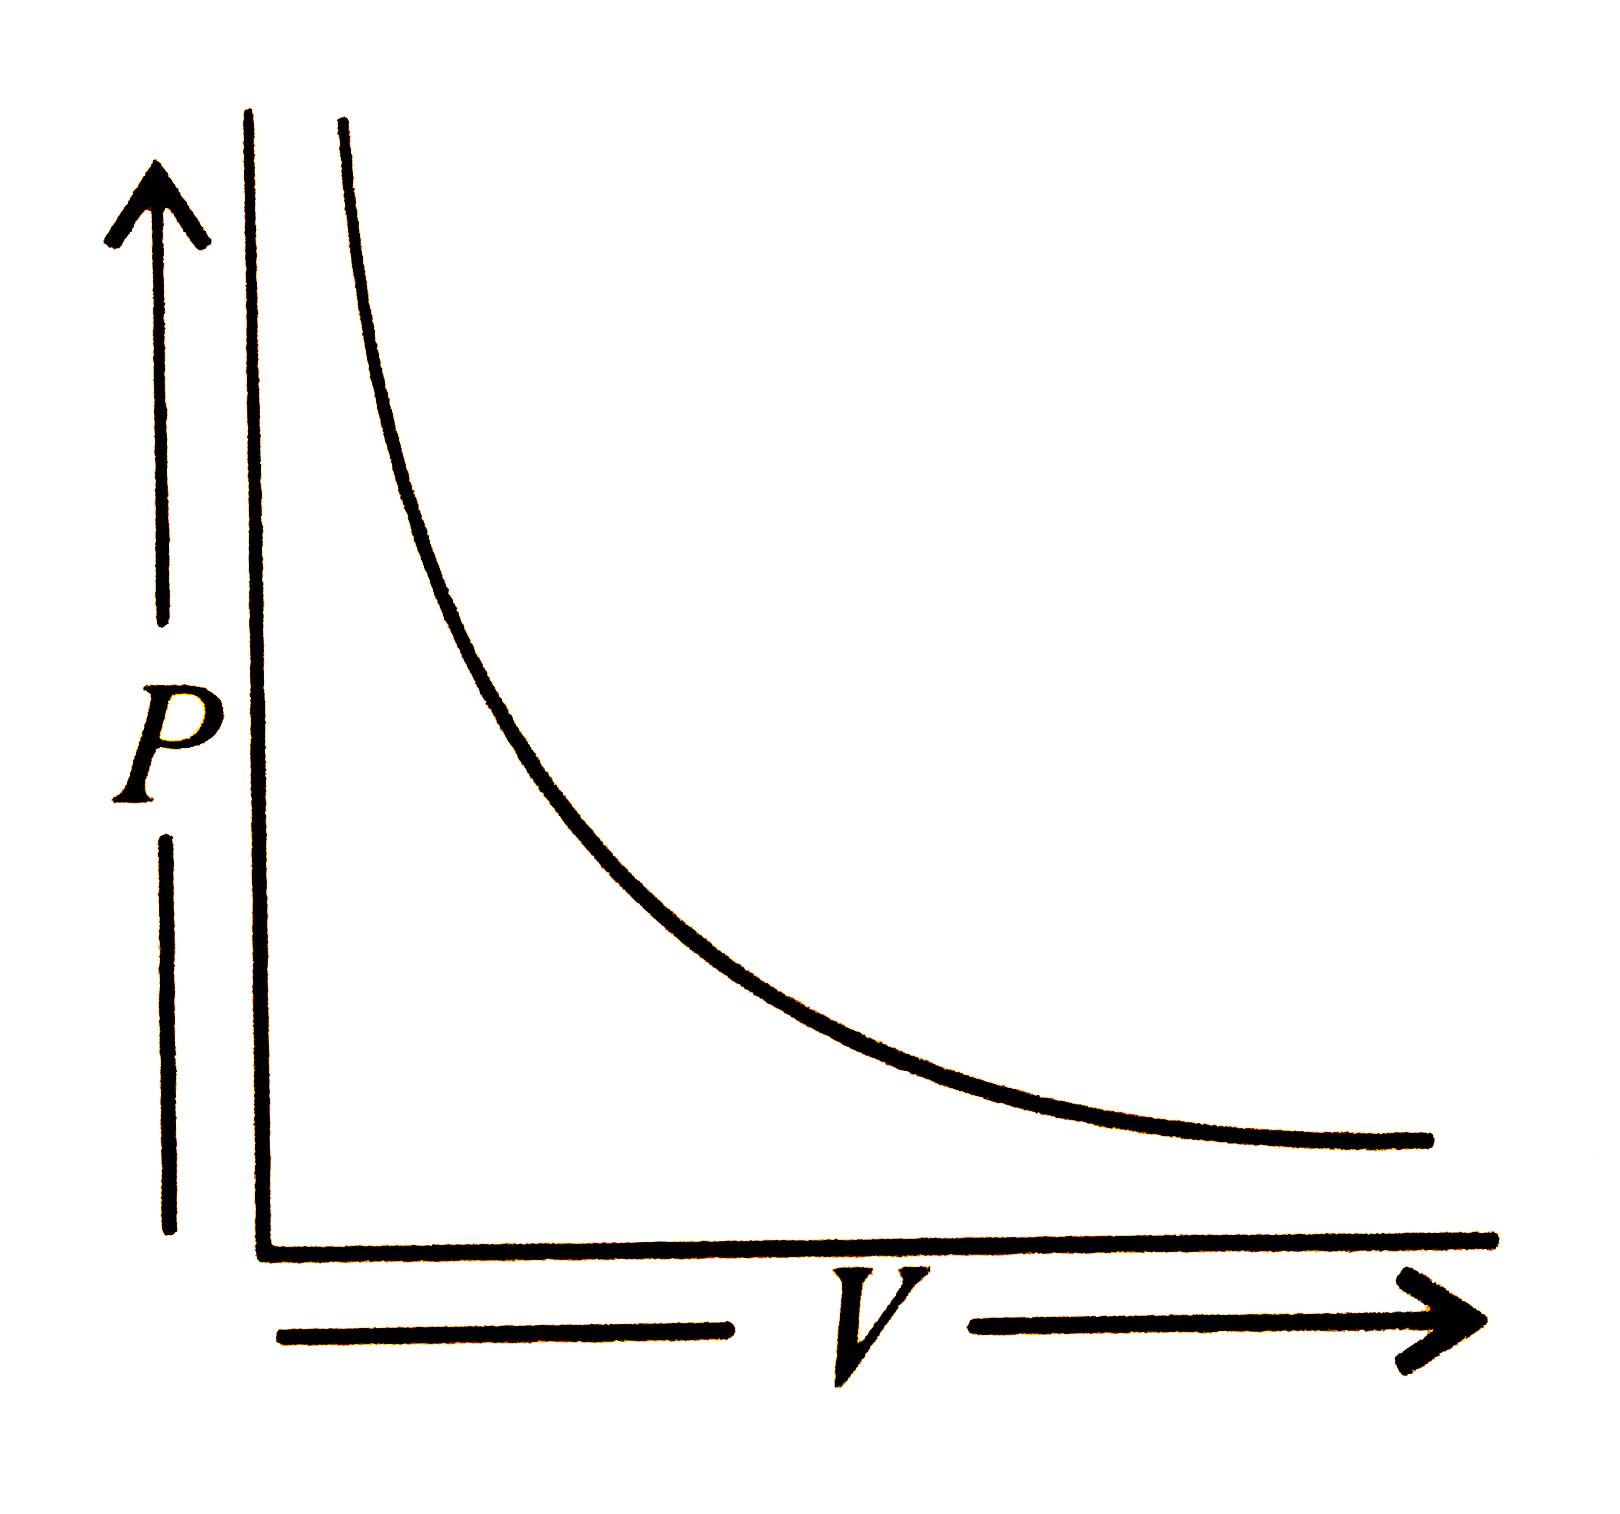
- Option C: If it shows a downward curve, this is indicative of an inverse relationship, which aligns with Boyle's law.
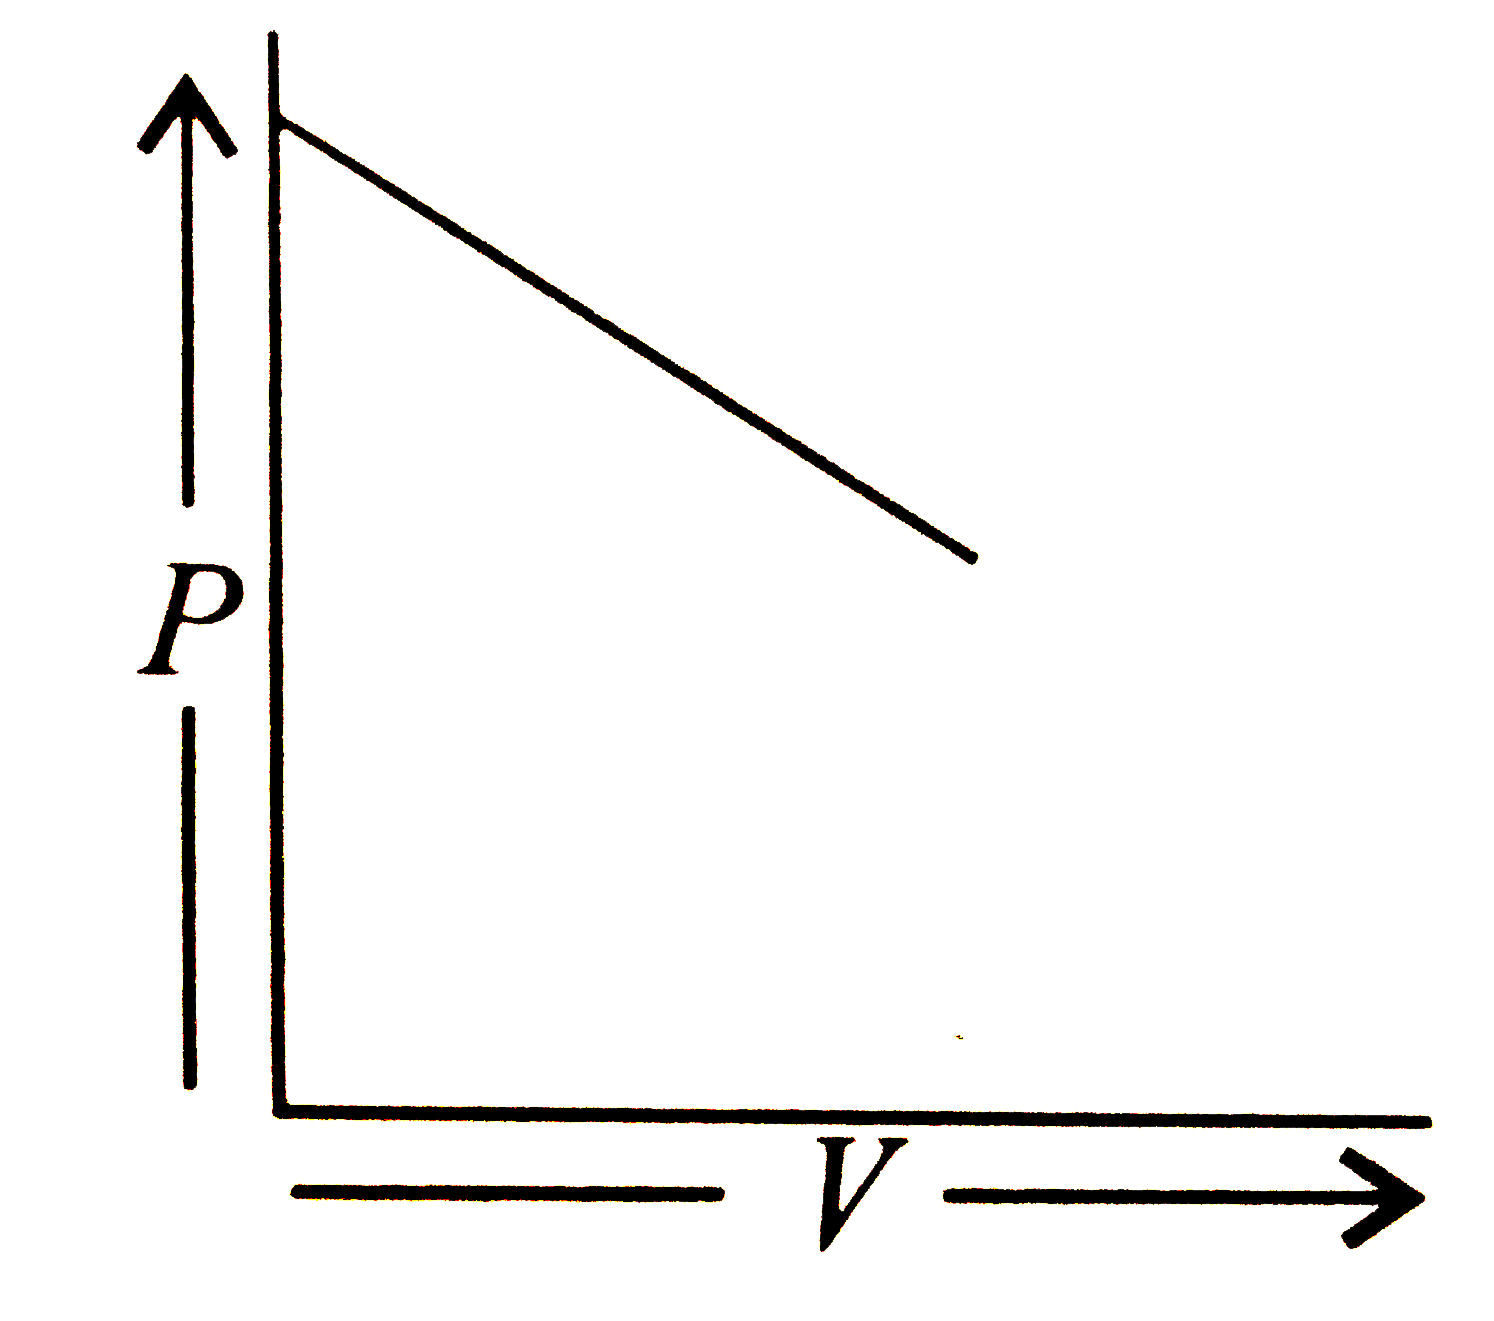
- Option D: If it shows a decrease without an inverse relationship, it cannot be Boyle's law.
Step 5: Conclusion
Based on the analysis, the plot that shows a downward curve (indicating an inverse relationship between pressure and volume) corresponds to Boyle's law. Therefore, the correct answer is:
Option C.
Boyle's law states that for a given mass of gas at constant temperature, the pressure (P) of the gas is inversely proportional to its volume (V). Mathematically, this can be expressed as:
P∝1V
or
PV=k
where k is a constant.
Since pressure is inversely related to volume, as the volume of the gas increases, the pressure decreases, and vice versa. This means that if we plot pressure (P) on the y-axis and volume (V) on the x-axis, the graph will show a downward curve.
In a graph where P is plotted against V:
- A straight line indicates a direct relationship (not applicable here).
- A downward curve indicates an inverse relationship, which is what we expect from Boyle's law.
Now, we need to look at the provided plots:
- Option A: If it shows an increase in volume with constant pressure, it does not represent Boyle's law.
- Option B: If it shows a straight line, it also does not represent Boyle's law.
- Option C: If it shows a downward curve, this is indicative of an inverse relationship, which aligns with Boyle's law.
- Option D: If it shows a decrease without an inverse relationship, it cannot be Boyle's law.
Based on the analysis, the plot that shows a downward curve (indicating an inverse relationship between pressure and volume) corresponds to Boyle's law. Therefore, the correct answer is:
Option C.
Topper's Solved these Questions
- STATES OF MATTERBOOK - CENGAGE CHEMISTRY ENGLISHCHAPTER - STATES OF MATTEREXERCISE - Illustration
2 Videos
- STATES OF MATTERBOOK - CENGAGE CHEMISTRY ENGLISHCHAPTER - STATES OF MATTEREXERCISE - Exercises
21 Videos
- SOME BASIC CONCEPTS AND MOLE CONCEPTBOOK - CENGAGE CHEMISTRY ENGLISHCHAPTER - SOME BASIC CONCEPTS AND MOLE CONCEPTEXERCISE - Archives Subjective
11 Videos
- STOICHIOMETRYBOOK - CENGAGE CHEMISTRY ENGLISHCHAPTER - STOICHIOMETRYEXERCISE - Archives Subjective
33 Videos
Similar Questions
Knowledge Check
Which of the following is according to Boyle's law?
A B
B C
C D
D
Which is incorrect curve for Boyle's law ?
View SolutionAmong the hydrides given below which are reasonable good acids?
View SolutionDraw the plot log V vs log T.
View SolutionAmong the hydrides given below which is reasonably electron precise hydride?
View SolutionAmong the compounds shown below which one revealed a linear structure ?
View SolutionWhich of the following is/are true for Boyle's law?
View SolutionWhich of the following curves represent(s) Boyle's law?
View Solution
