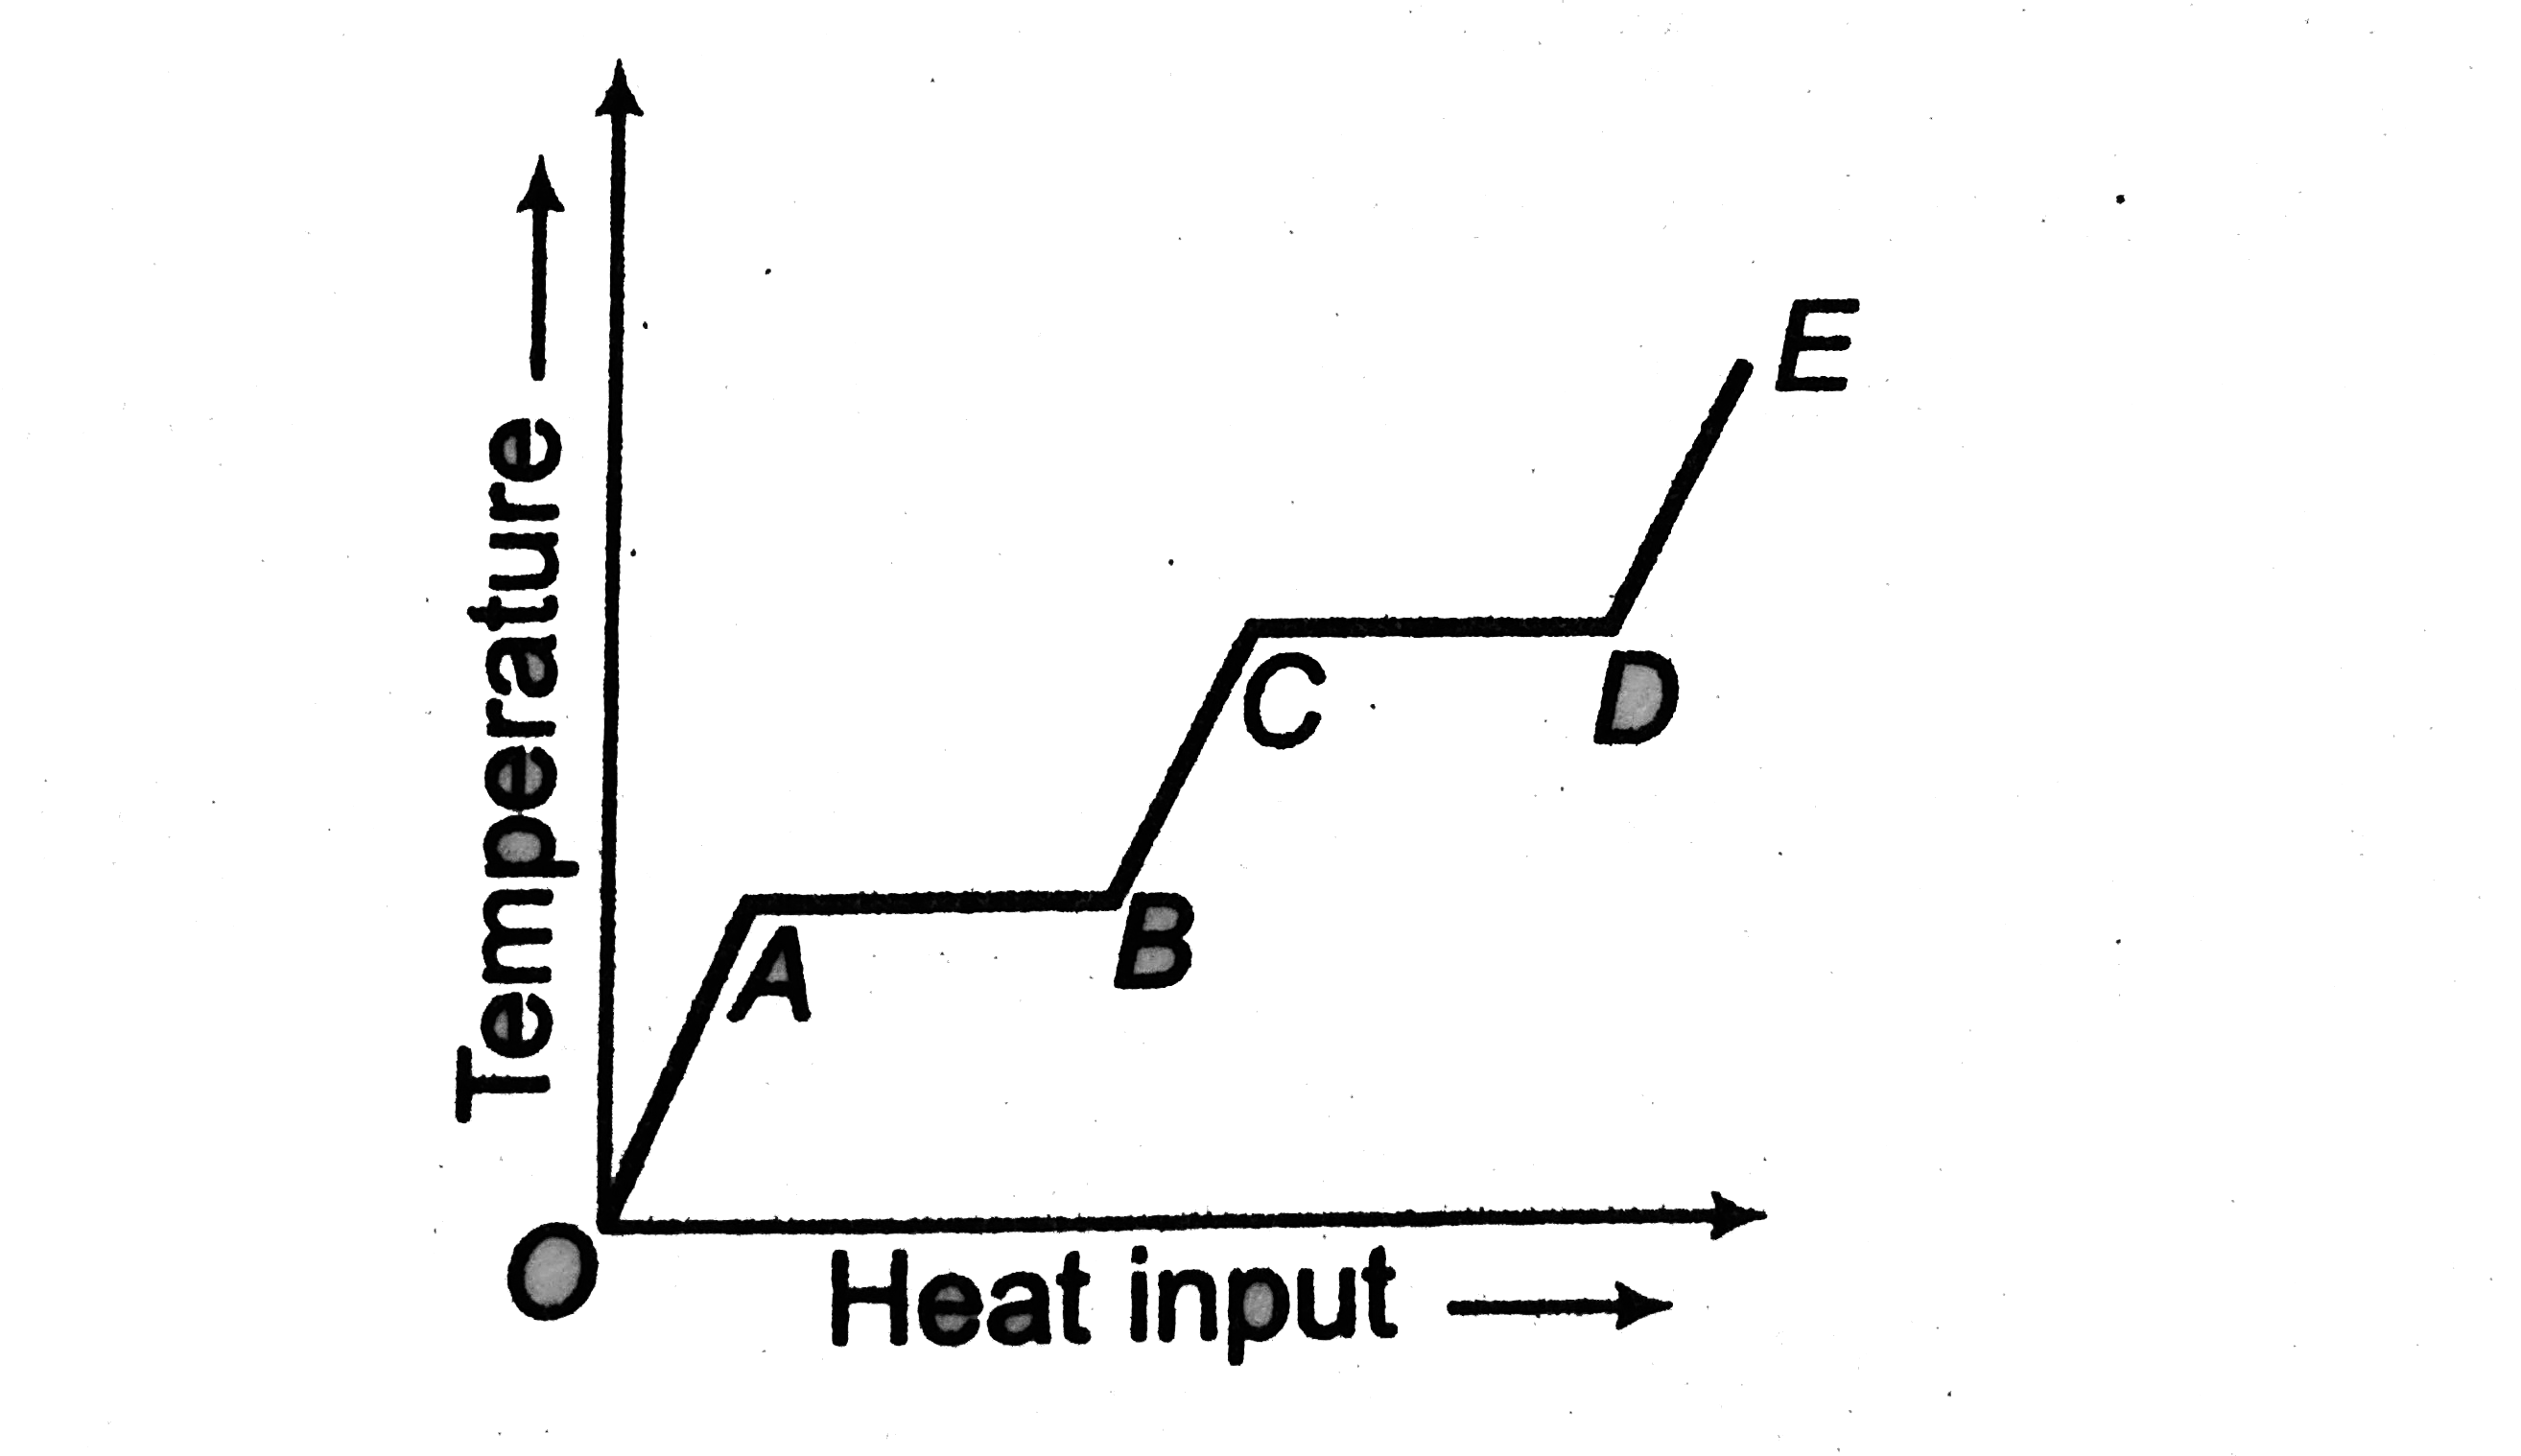
Heat is supplied to a certain homogeneous sample of amtter, at a uniform rate. Its temperature is plotted against time, as shown in the figure below. Which of the following conclusions can be drawn?
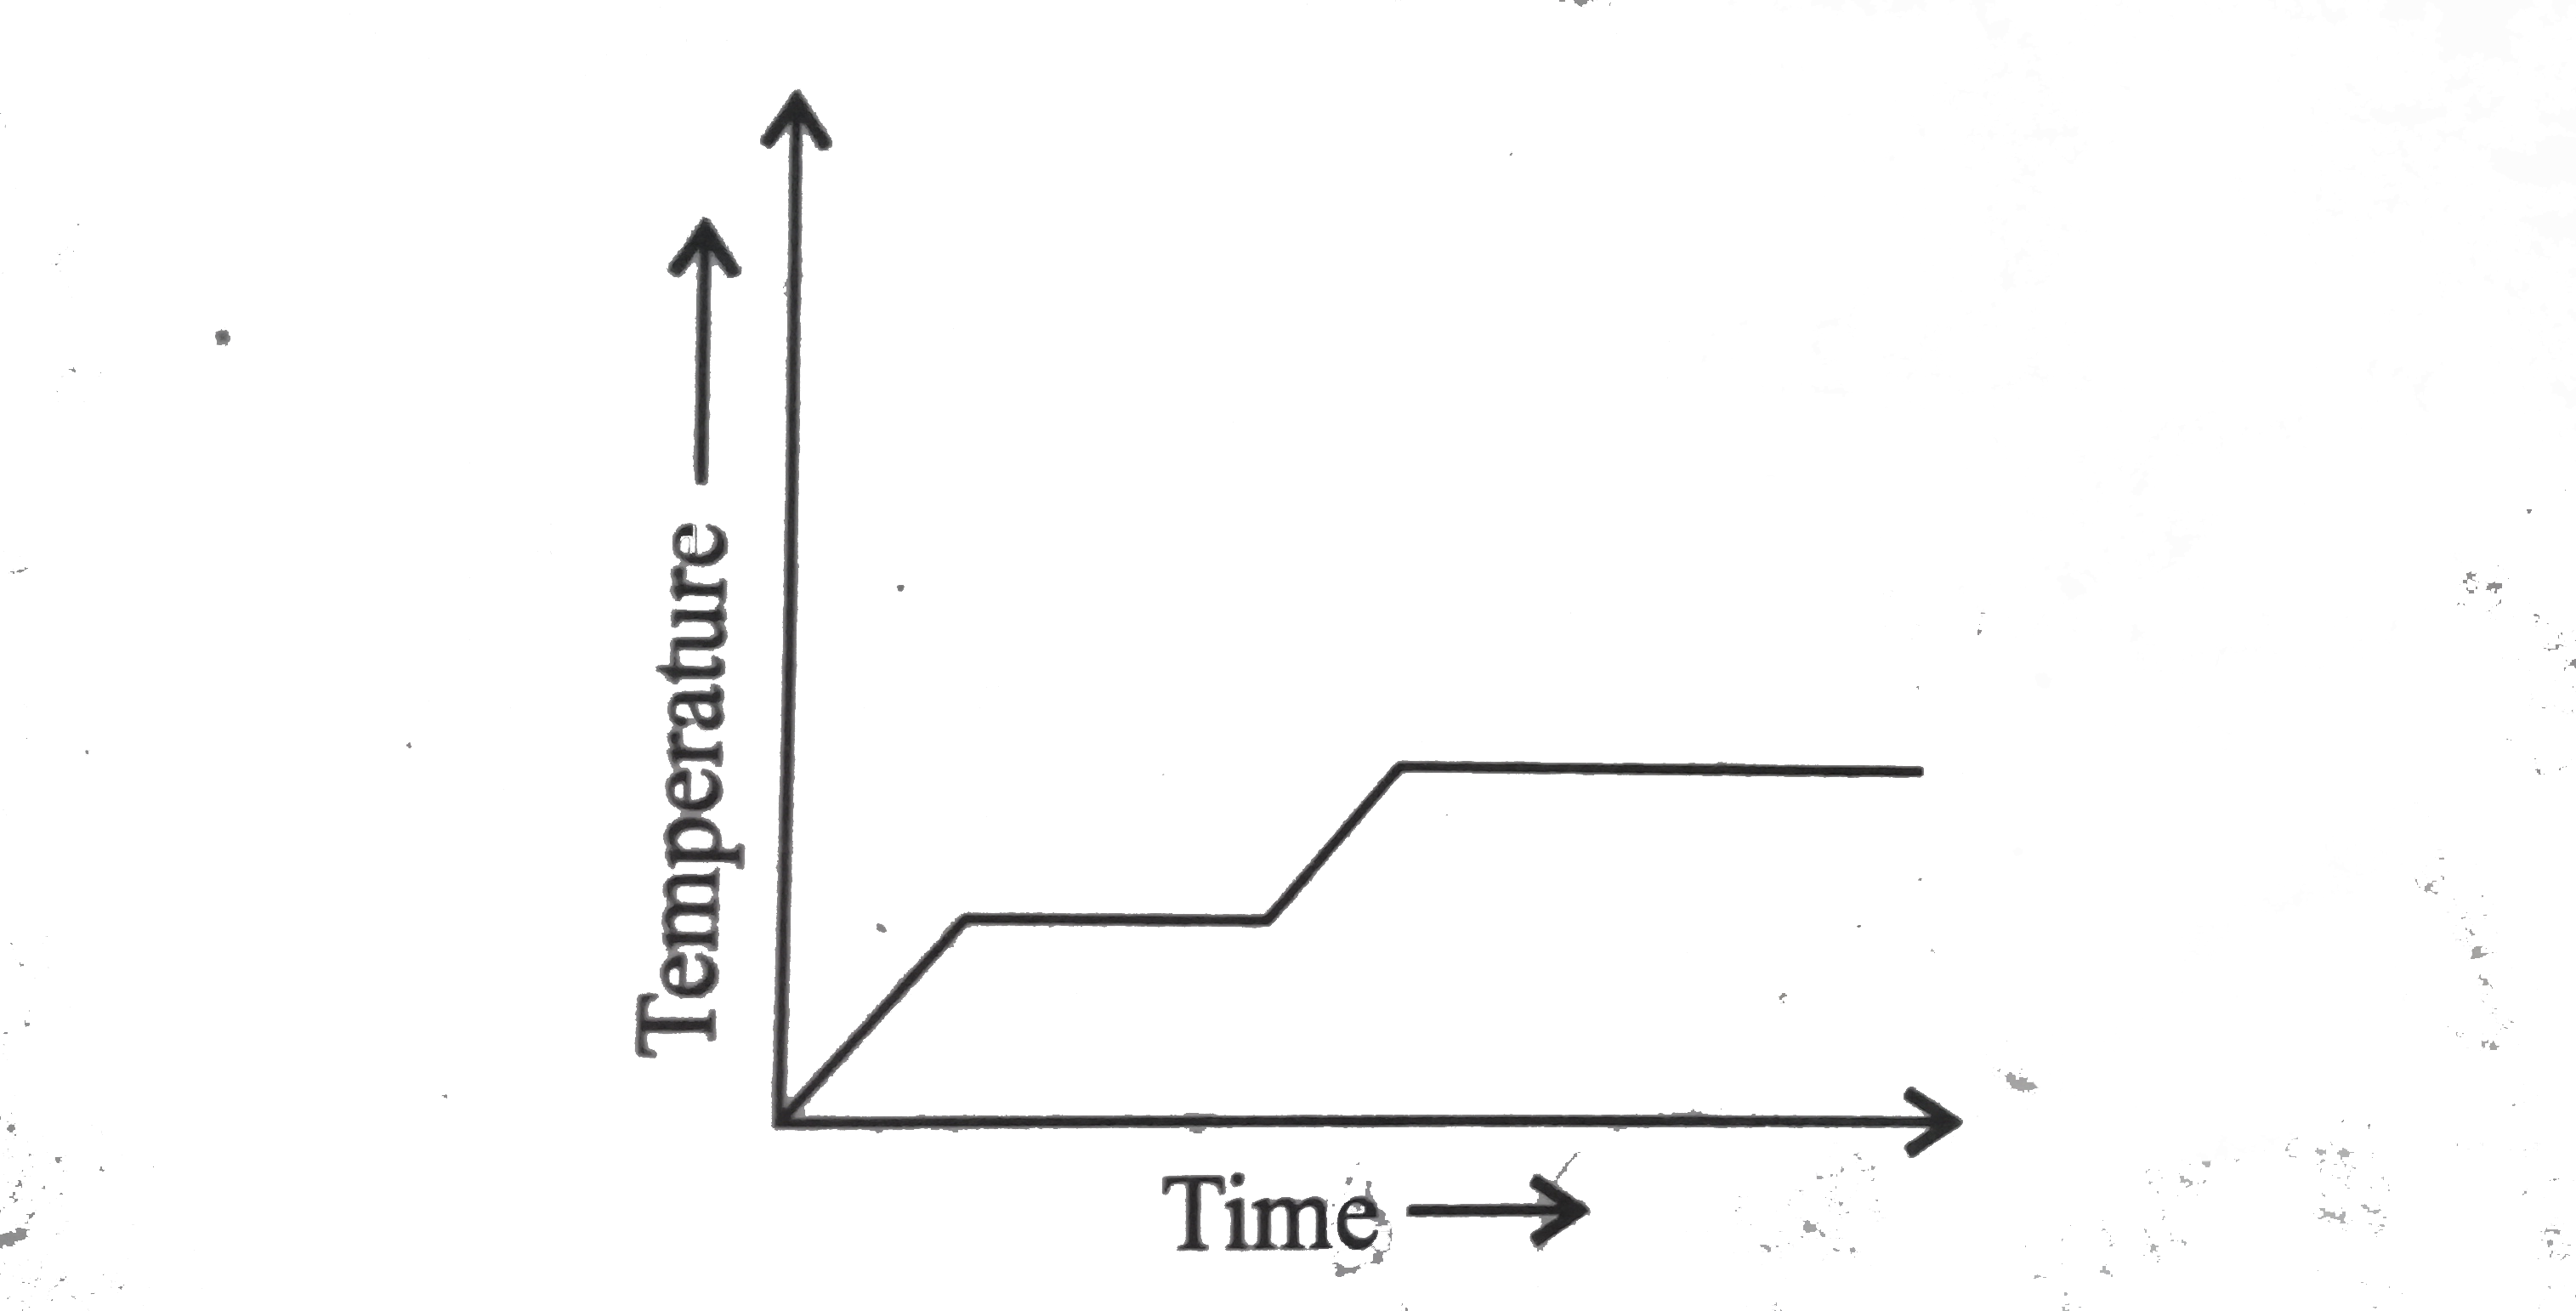
Its specific heat capacity is greater in the solid state than in the liquid state.
Its specific heat capacity is smaller in the solid state than in the liquid state.
Its latent heat of vaporisation is greater than its latent heat of fusion.
Its latent heat of vaporisation is smaller than its latent heat of fusion.
The latent heat of vaporisation is greater them its latent heat of fusion.
Topper's Solved these Questions
- THERMODYNAMICSBOOK - CENGAGE CHEMISTRY ENGLISHCHAPTER - THERMODYNAMICSEXERCISE - Exercise
1 Videos
- THERMODYNAMICSBOOK - CENGAGE CHEMISTRY ENGLISHCHAPTER - THERMODYNAMICSEXERCISE - Ex 6.1
26 Videos
- STOICHIOMETRYBOOK - CENGAGE CHEMISTRY ENGLISHCHAPTER - STOICHIOMETRYEXERCISE - Archives Subjective
33 Videos
Similar Questions
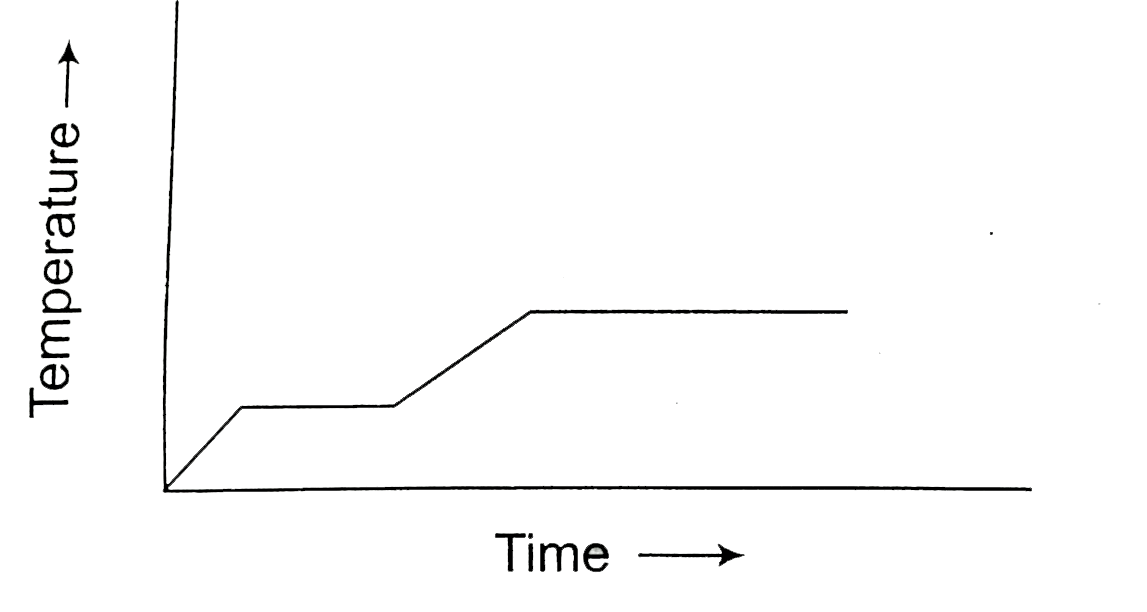
Heat is supplied to a certain homogeneous sample of matter, at a uniform rate. Its temperature is plotted against time, as shown Which of the following conclusions can be drawn?
(i) Its specific heat capacity is greater in the solid state than the liquid state.
(ii) Its specific heat capacity is greater in the liquid state than in the solid state.
(iii) Its latent heat of vaporization is greater than its latent heat of fusion.
(iv) Its latent heat of vaporization is smaller than its latent heat of fusion
View SolutionThe age pyramid for human population is shown below
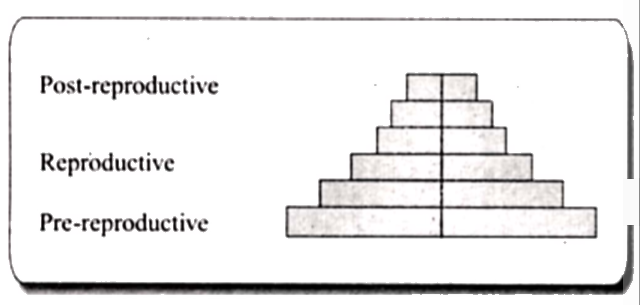
Which of the following conclusion can be drawn from the given age pyramid?
View Solution
Knowledge Check
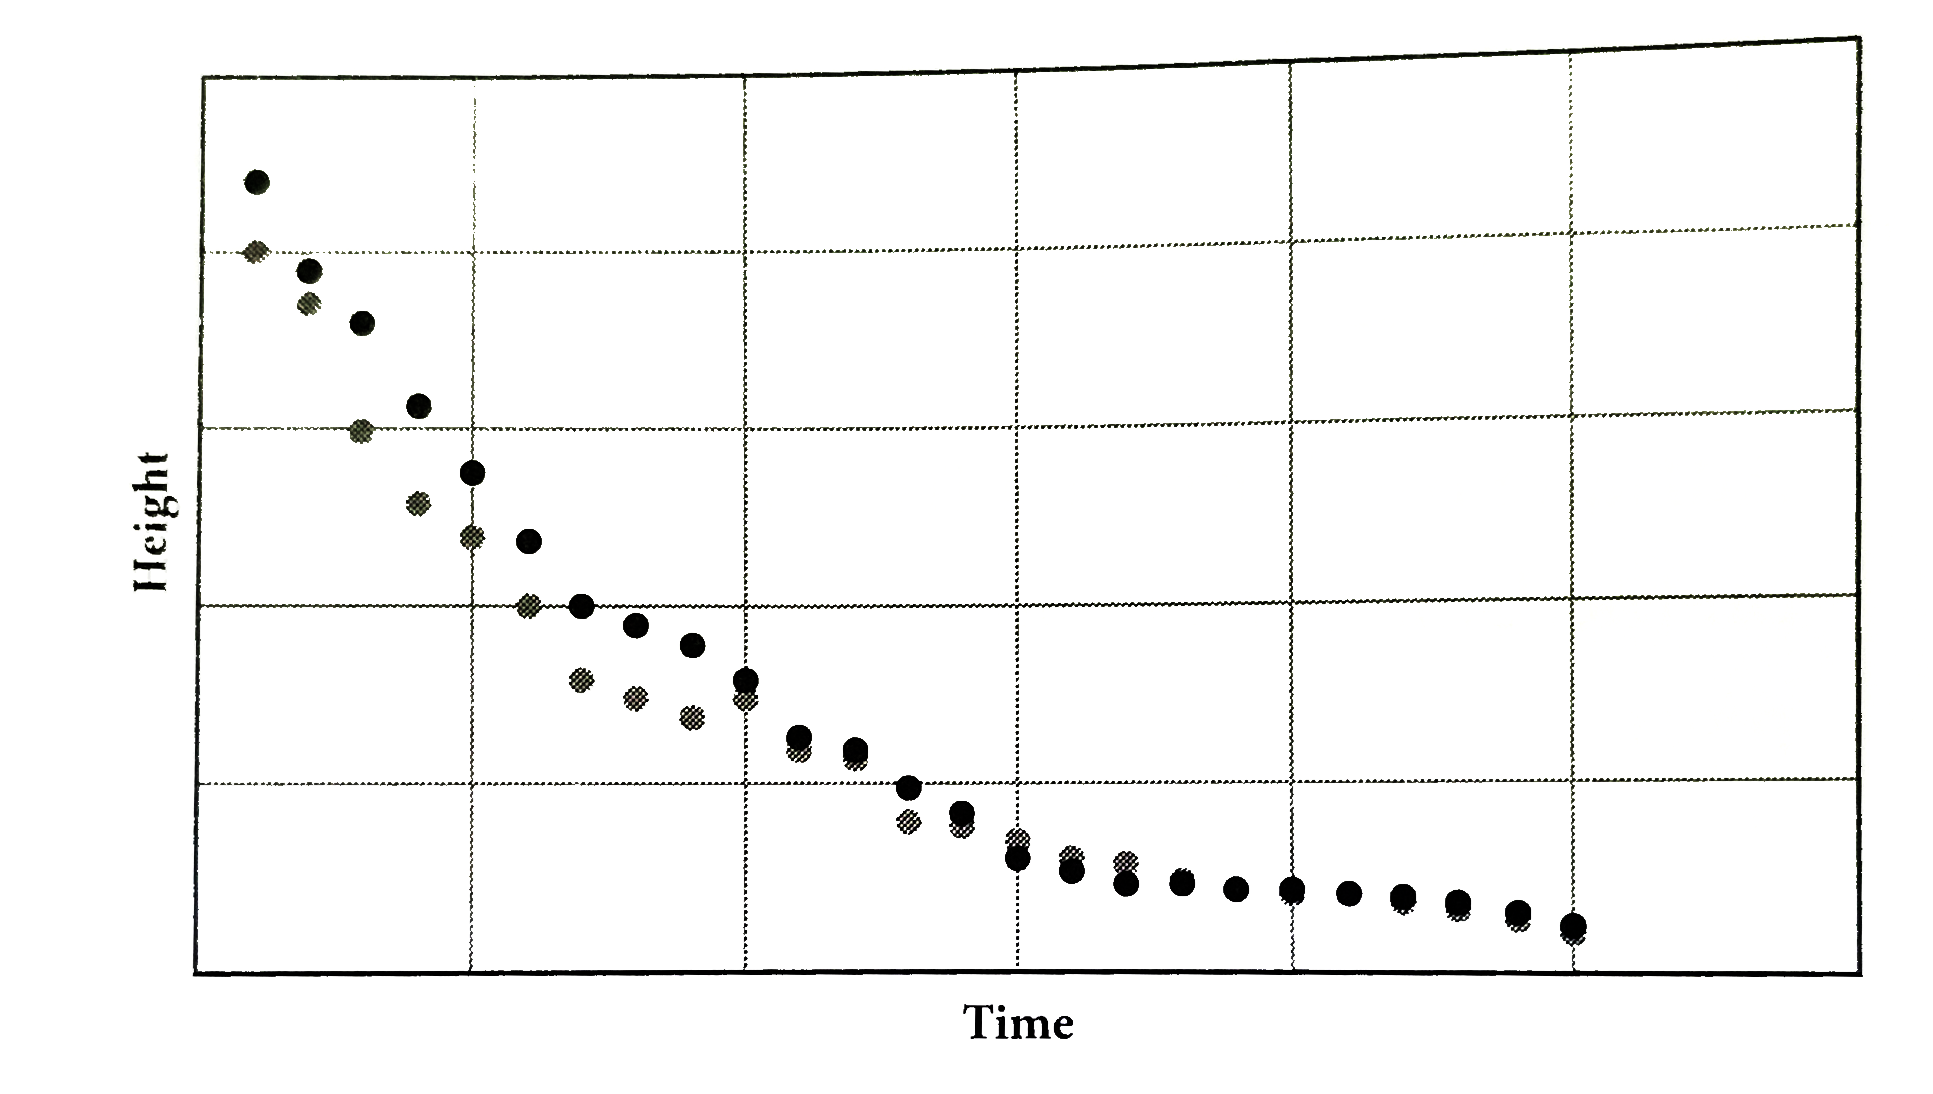
A drain at the bottom of a cylondrical water tank is opened and the height of the water is measured at regular time intervals. The tank is refilled and the process is then repeated. The scatterplot above shows the measured height on the y-axis and time on the x-axis for the trials. Which of the following conclusions can be drawn from the observations in the scatterplot?AWater flows out of the drain at a constant rate.BThe flow rate from the tank decreases as the height of the water in the tank decreases.CThe drain is inefficinetly designed.DThe is no relationship between the height of the water in the tank and time.
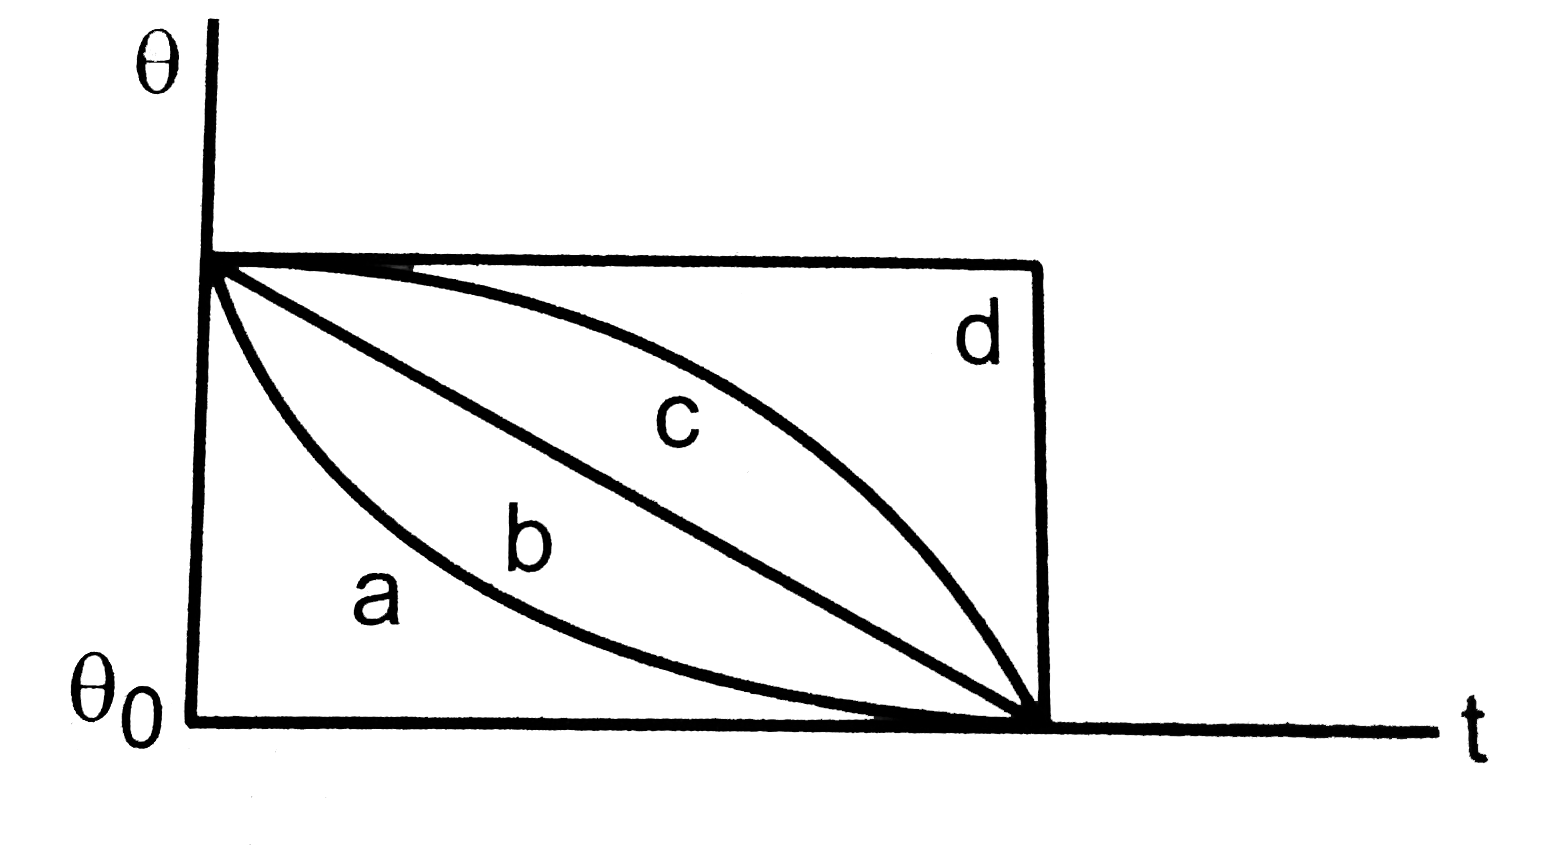
A hot liquid is kept in a big room. Its temperature is plotted as a function of time. Which of the following curves may represent the plot?
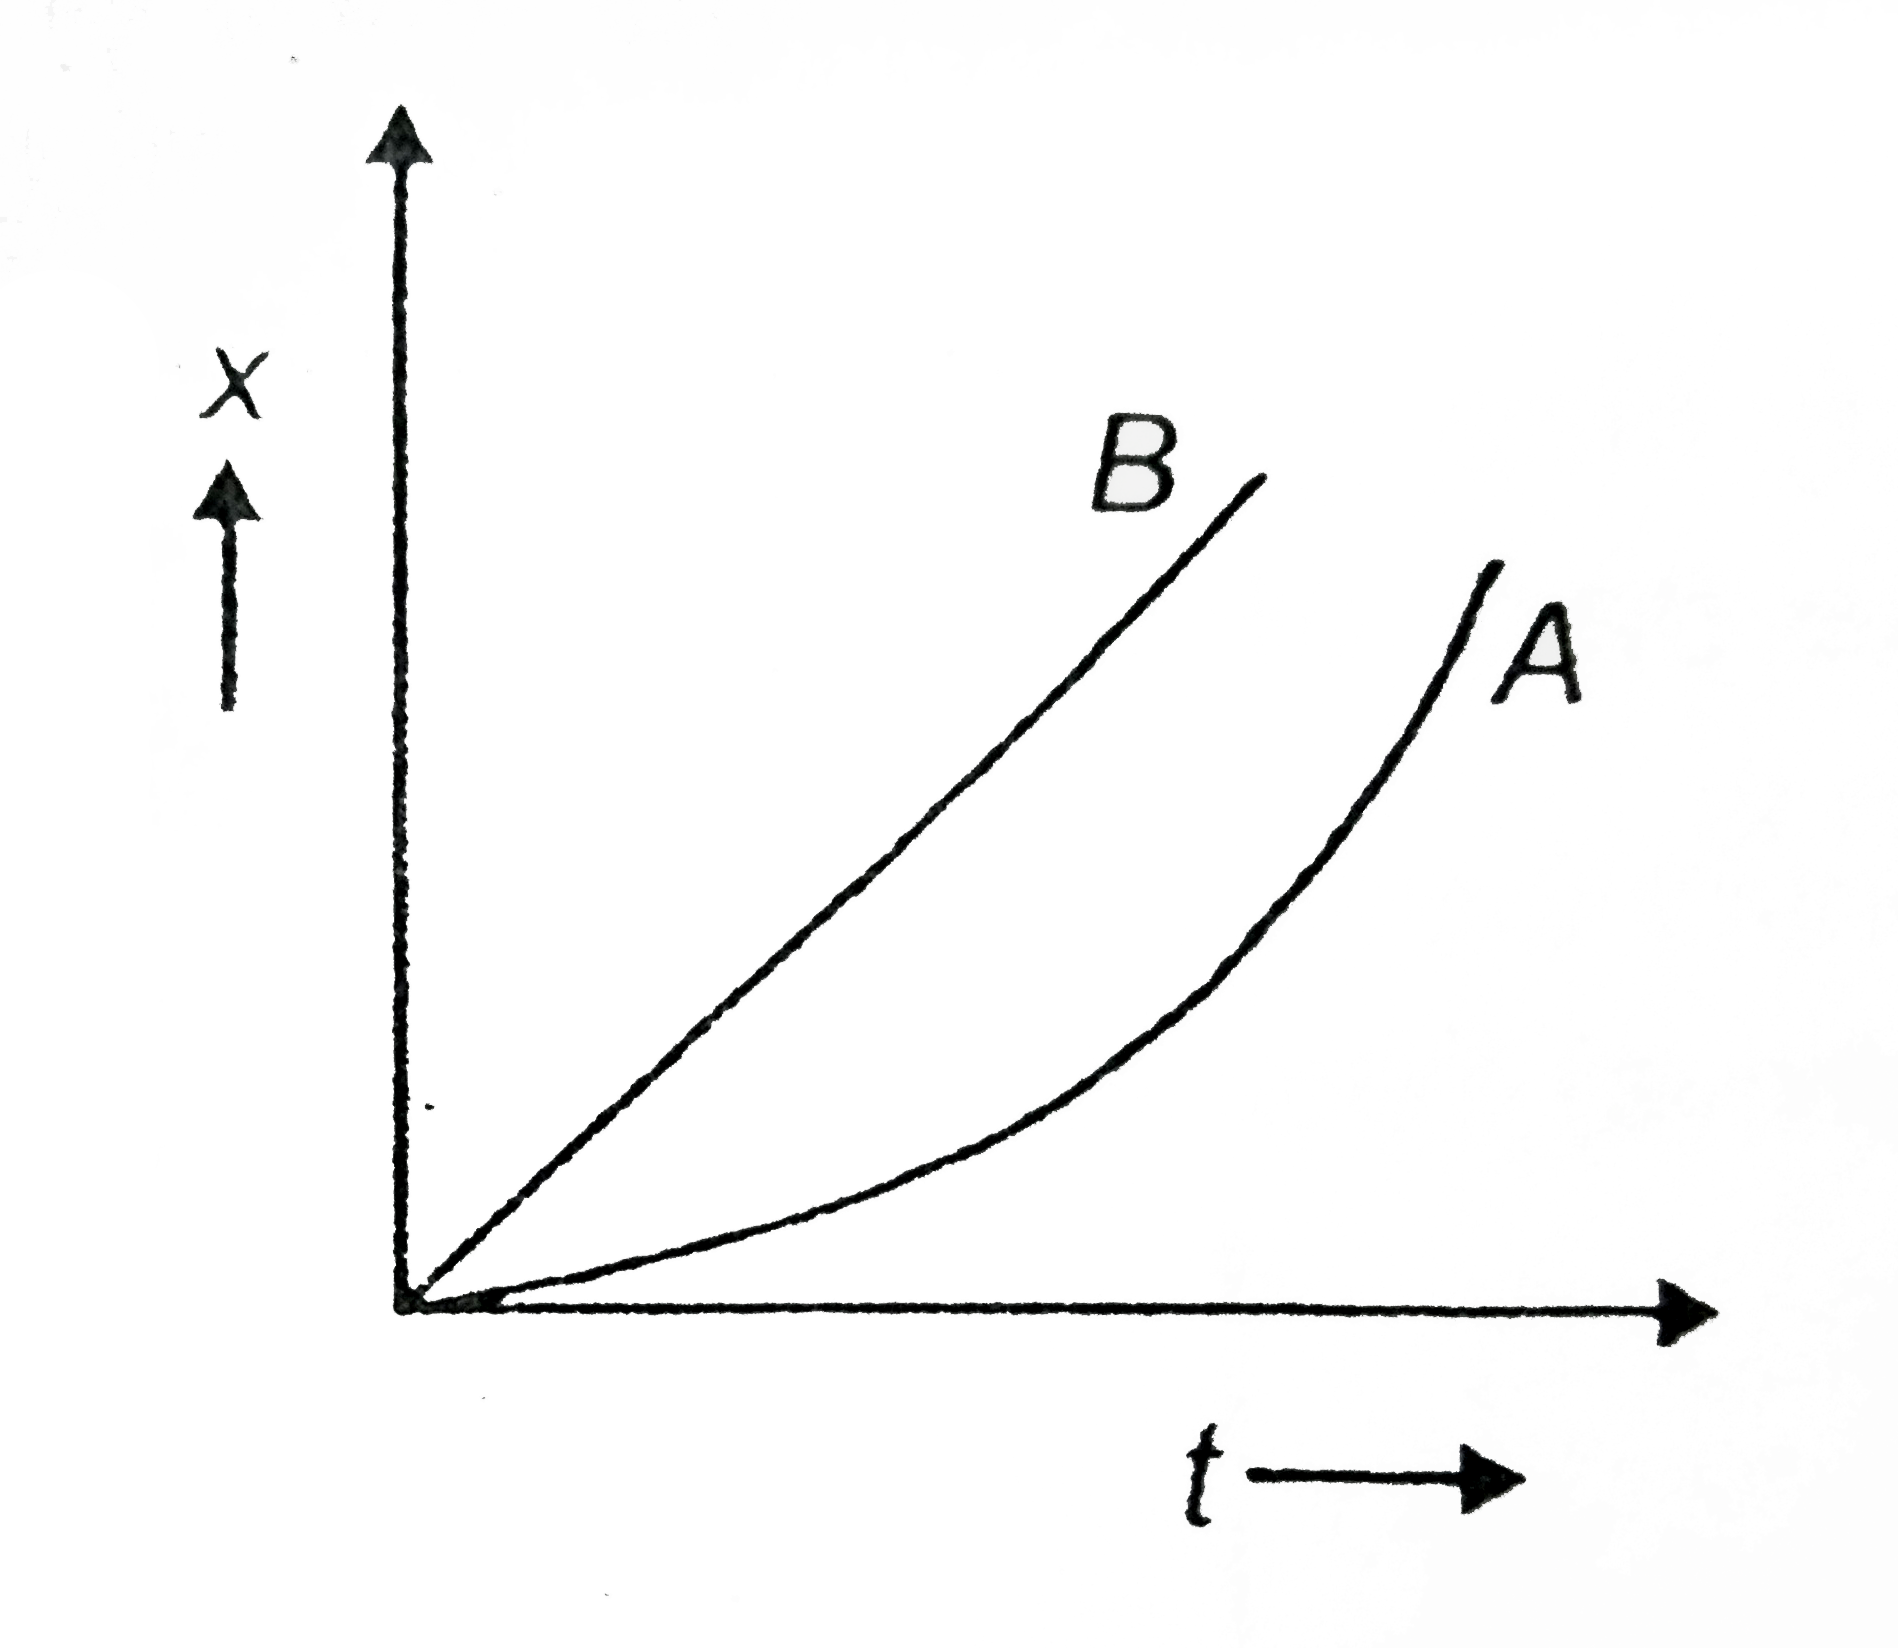
View SolutionThe displacement-time graph of two moving objects A and B are shown in the figure given below. Which of the following is incorrect?
View SolutionThe variation of decay rate of two radioactive samples A and B with time is shown in fig.
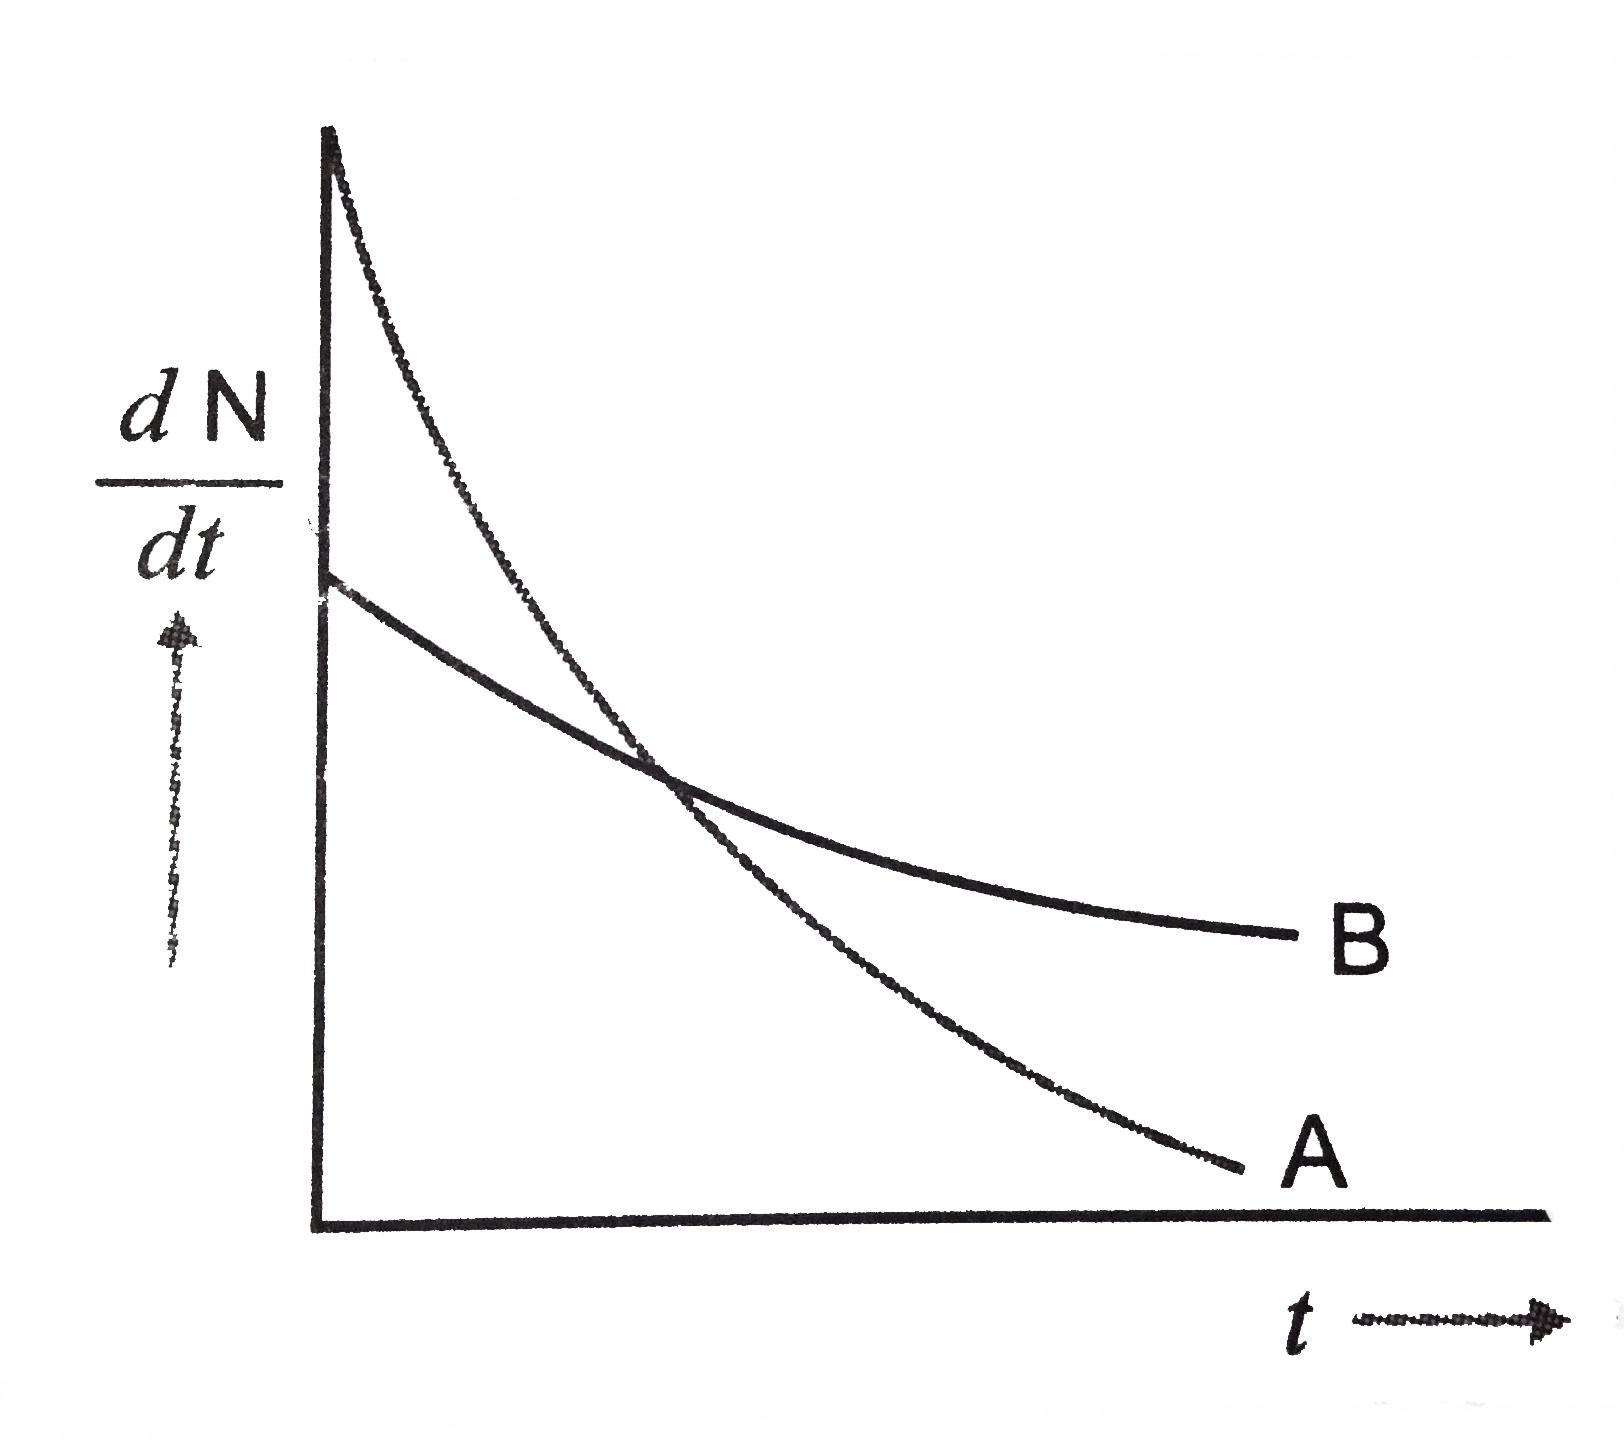
Which of the following statements are true?
View SolutionThe variation of decay rate of two radioactive samples A and B with time is shown in fig.

Which of the following statements are true?
View SolutionRate of reaction (r ) is plotted against temperature (T) for an enzyme catalysed reaction. Which of the following is correct representation ?
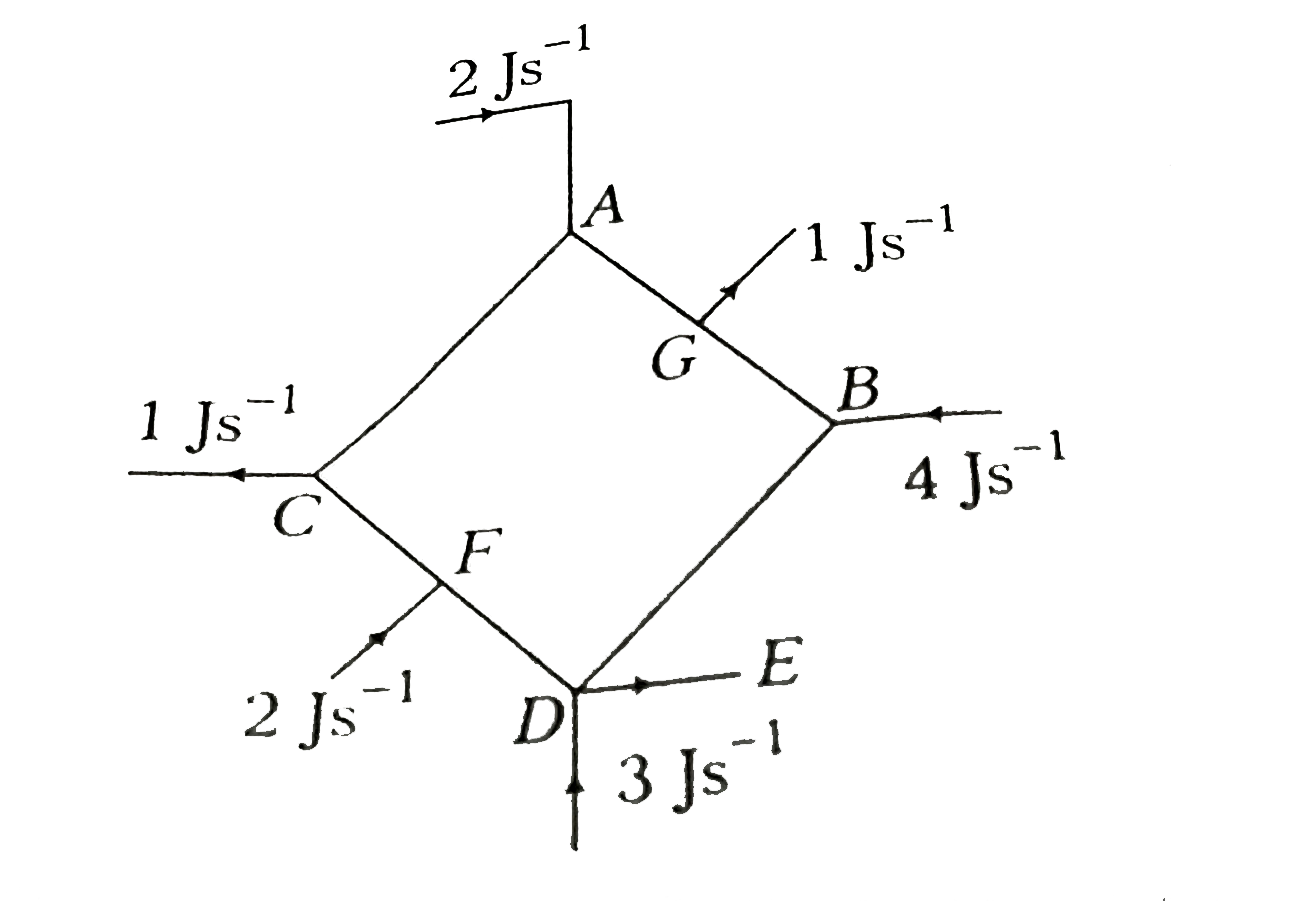
View SolutionThe rate of flow of heat through 12 identical conductors made of same material is shown in the figure. Then, which of the following is correct ?
View SolutionA solid material is supplied heat at a constant rate. The temperature of material is changing with heat input as shown in the figure. What does the slope of DE represent ?
View Solution
