Which graph will show equilibrium condition?
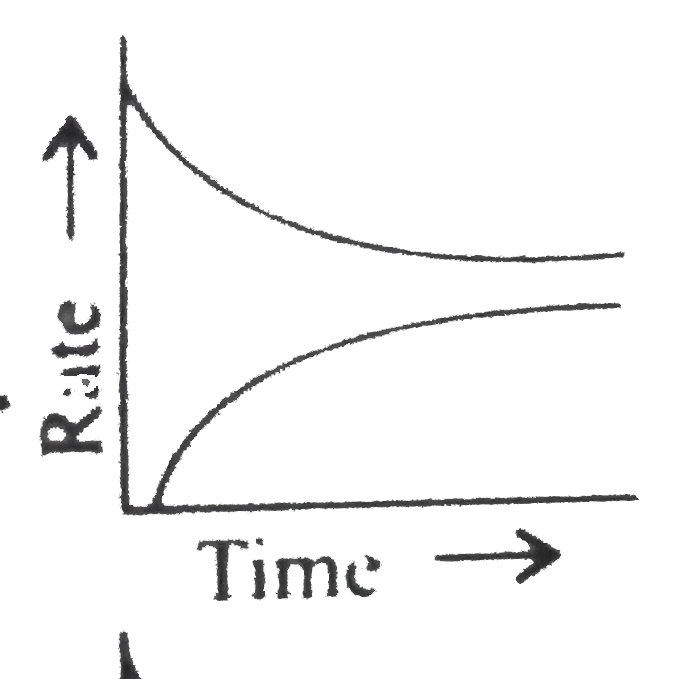
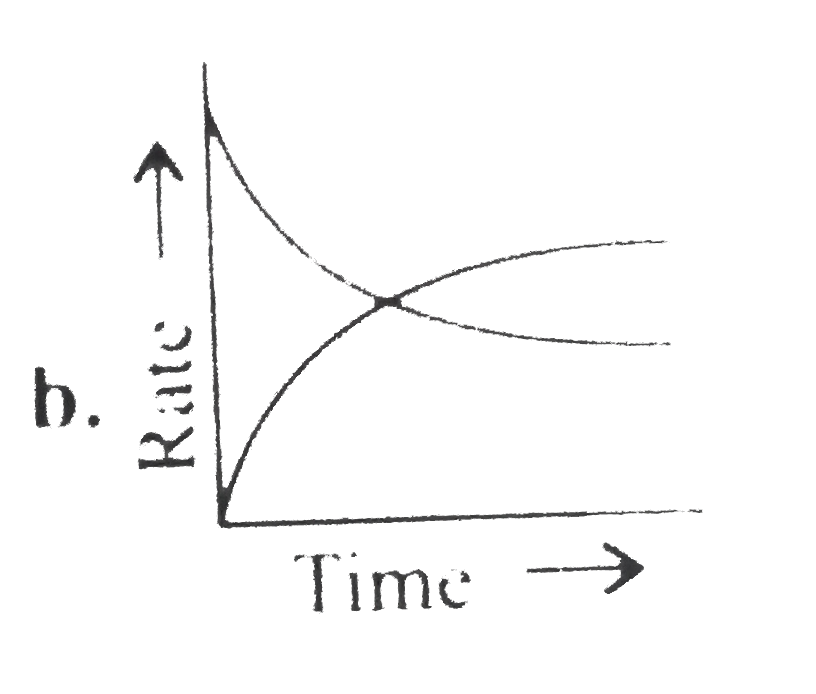
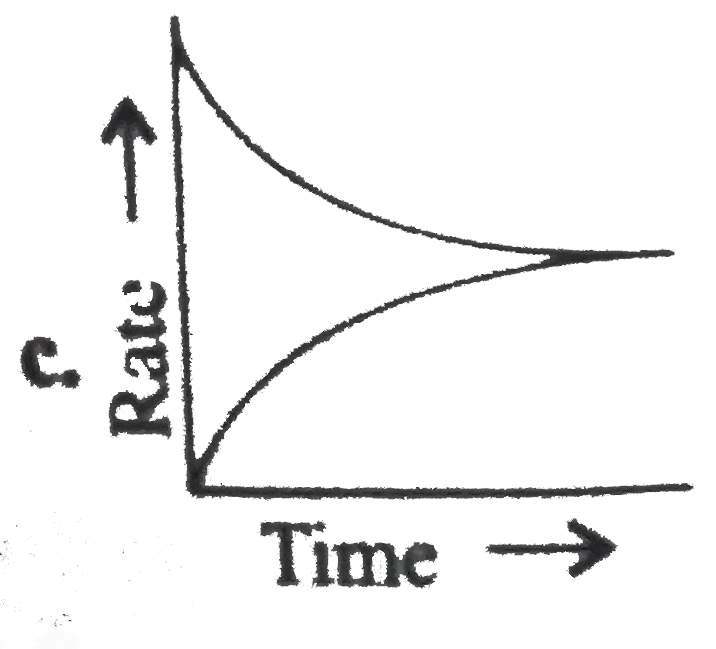
None of these
The correct Answer is:C
To determine which graph shows the equilibrium condition in a chemical reaction, we can follow these steps:
Step 1: Understand the Concept of Equilibrium
In a reversible reaction, equilibrium is reached when the rate of the forward reaction equals the rate of the backward reaction. At this point, the concentrations of reactants and products remain constant over time.
Step 2: Analyze the Given Graphs
We have three graphs to analyze, each representing the concentration of reactants and products over time. We need to identify which graph indicates that the concentrations have stabilized, showing that equilibrium has been reached.
Step 3: Evaluate Each Graph
1. Graph 1: Initially shows a higher concentration of reactants and a lower concentration of products. As time progresses, the concentration of reactants decreases, and that of products increases. However, it does not indicate a point where concentrations become constant.
2. Graph 2: Similar to Graph 1, it shows the concentration of reactants decreasing and products increasing over time. Again, it does not clearly show a stable point indicating equilibrium.
3. Graph 3: This graph starts with a higher concentration of reactants and a concentration of products at zero. As time progresses, the concentration of reactants decreases, and the concentration of products increases. Importantly, it indicates a point where both concentrations become constant, suggesting that equilibrium has been reached.
Step 4: Identify the Correct Graph
Based on the analysis, Graph 3 is the only graph that shows the concentrations of reactants and products stabilizing over time, indicating that equilibrium has been achieved.
Final Answer
The correct answer is Option 3.
---
In a reversible reaction, equilibrium is reached when the rate of the forward reaction equals the rate of the backward reaction. At this point, the concentrations of reactants and products remain constant over time.
We have three graphs to analyze, each representing the concentration of reactants and products over time. We need to identify which graph indicates that the concentrations have stabilized, showing that equilibrium has been reached.
1. Graph 1: Initially shows a higher concentration of reactants and a lower concentration of products. As time progresses, the concentration of reactants decreases, and that of products increases. However, it does not indicate a point where concentrations become constant.
2. Graph 2: Similar to Graph 1, it shows the concentration of reactants decreasing and products increasing over time. Again, it does not clearly show a stable point indicating equilibrium.
Based on the analysis, Graph 3 is the only graph that shows the concentrations of reactants and products stabilizing over time, indicating that equilibrium has been achieved.
The correct answer is Option 3.
Topper's Solved these Questions
- CHEMICAL EQUILIBRIUMBOOK - CENGAGE CHEMISTRY ENGLISHCHAPTER - CHEMICAL EQUILIBRIUMEXERCISE - Concept Applicationexercise 7.1
53 Videos
- CHEMICAL EQUILIBRIUMBOOK - CENGAGE CHEMISTRY ENGLISHCHAPTER - CHEMICAL EQUILIBRIUMEXERCISE - Ex 7.2
40 Videos
- CHEMICAL BONDING AND MOLECULAR STRUCTUREBOOK - CENGAGE CHEMISTRY ENGLISHCHAPTER - CHEMICAL BONDING AND MOLECULAR STRUCTUREEXERCISE - Archives Subjective
15 Videos
- CLASSIFICATION AND NOMENCLATURE OF ORGANIC COMPOUNDSBOOK - CENGAGE CHEMISTRY ENGLISHCHAPTER - CLASSIFICATION AND NOMENCLATURE OF ORGANIC COMPOUNDSEXERCISE - Analytical and Descriptive Type
3 Videos
Similar Questions
Knowledge Check
Animal cells are suspended in a culture medium that contains excess glucose. The graph below shows glucose utilisation under different growth conditions (A),(B), and (C) in the graph indicate
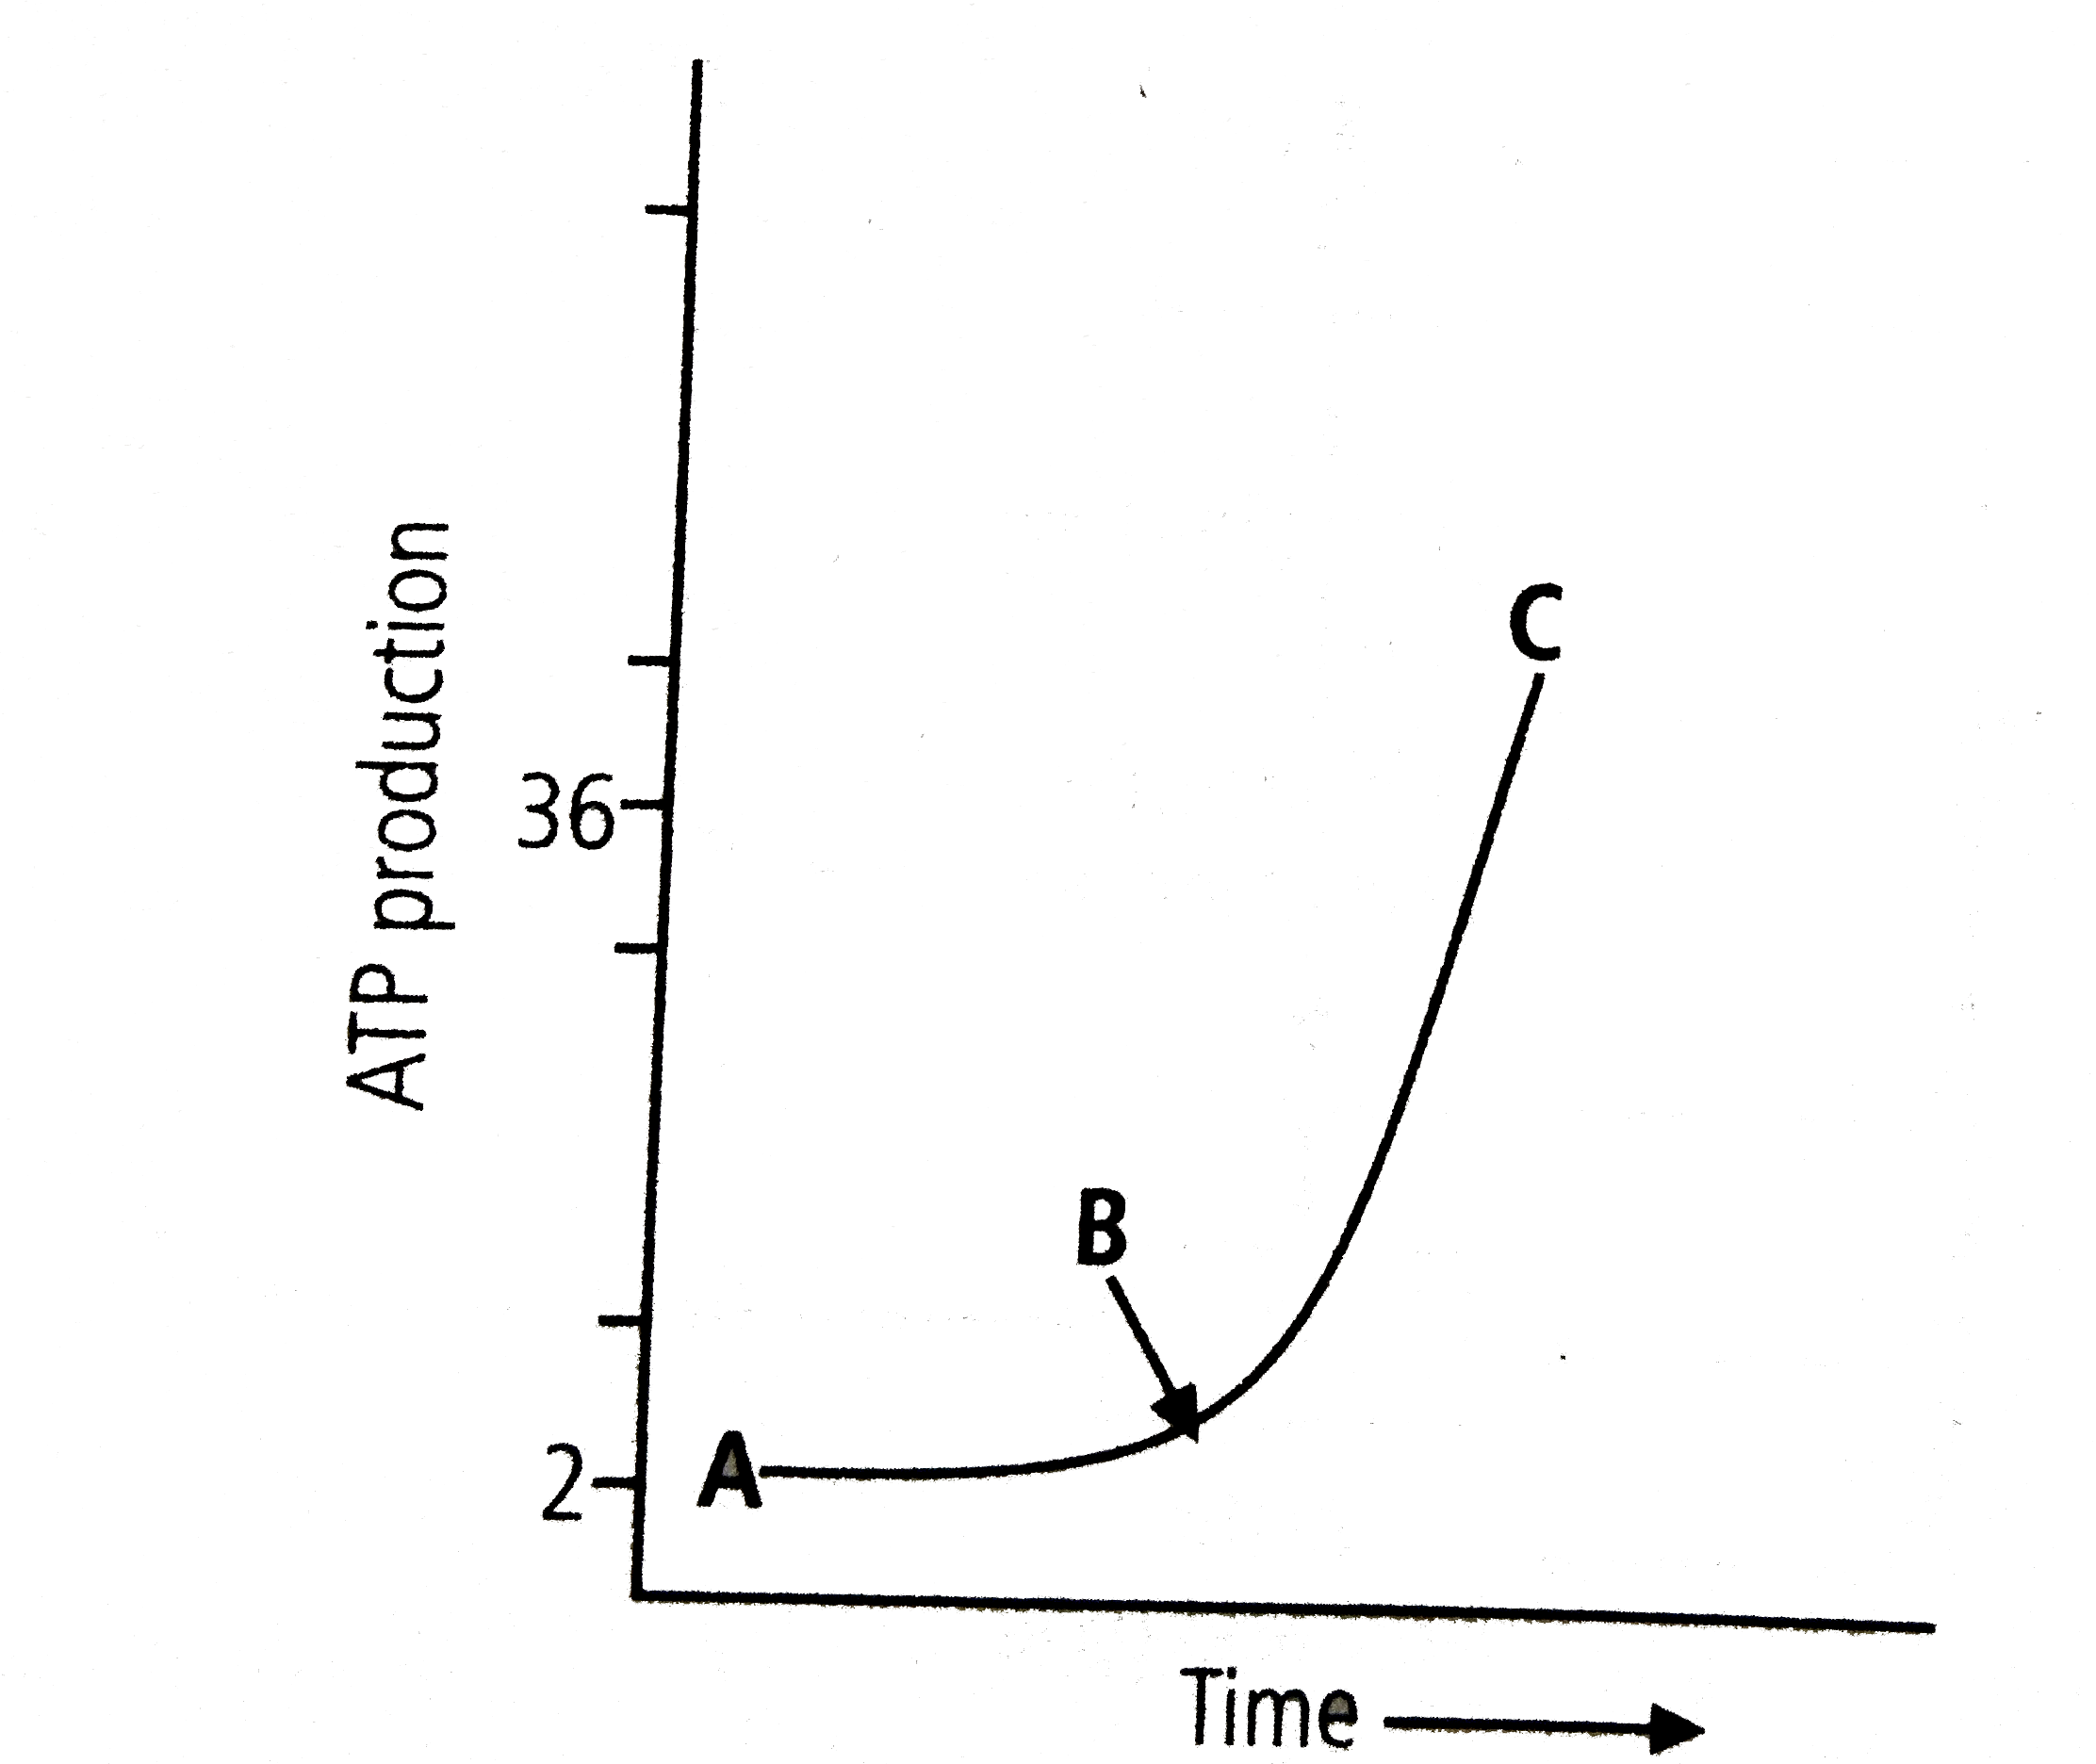 AA-Anaerobic respiration
B-Introduction of O2 to culture medium
C- Aerobic respirationBA-Aerobic respiration
B-Introduction of O2 to culture medium
C- Anaerobic respirationCA-Aerobic respiration
B-Supply of organic triphosphate
C-Aerobic respirationDA-Aerobic respiration
B-Introduction of CO to culture medium
C-Anaerobic respiration.
N2+3H2⇔2NH3
Which of the following statements is correct if N2 added at equilibrium condition?
View SolutionWhich graph shows zero activation energy ?
View SolutionWhich of the following organisms will show a condition as depicted in the following diagram ?
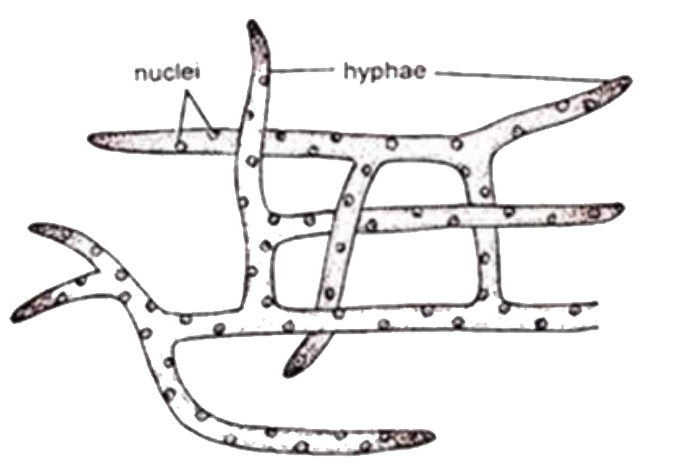
View SolutionThe figure below shows four graphs of x versus time,which graph shows a constant,positive ,non-zero velocity?

View SolutionFor a system in equilibrium, ΔG=0, under conditions of constant
View SolutionThe correct graph which shows the variation of paramagnetic susceptibility S with temperature T is
View SolutionWhich of the following graph correctly represent for equilibrium reaction whose Kp>1?
View Solution

