X, Y and Z react in the 1:1:1 stoichiometric ratio.
The concentration of X, Y and Z we are found to vary with time as shown in the figure below:
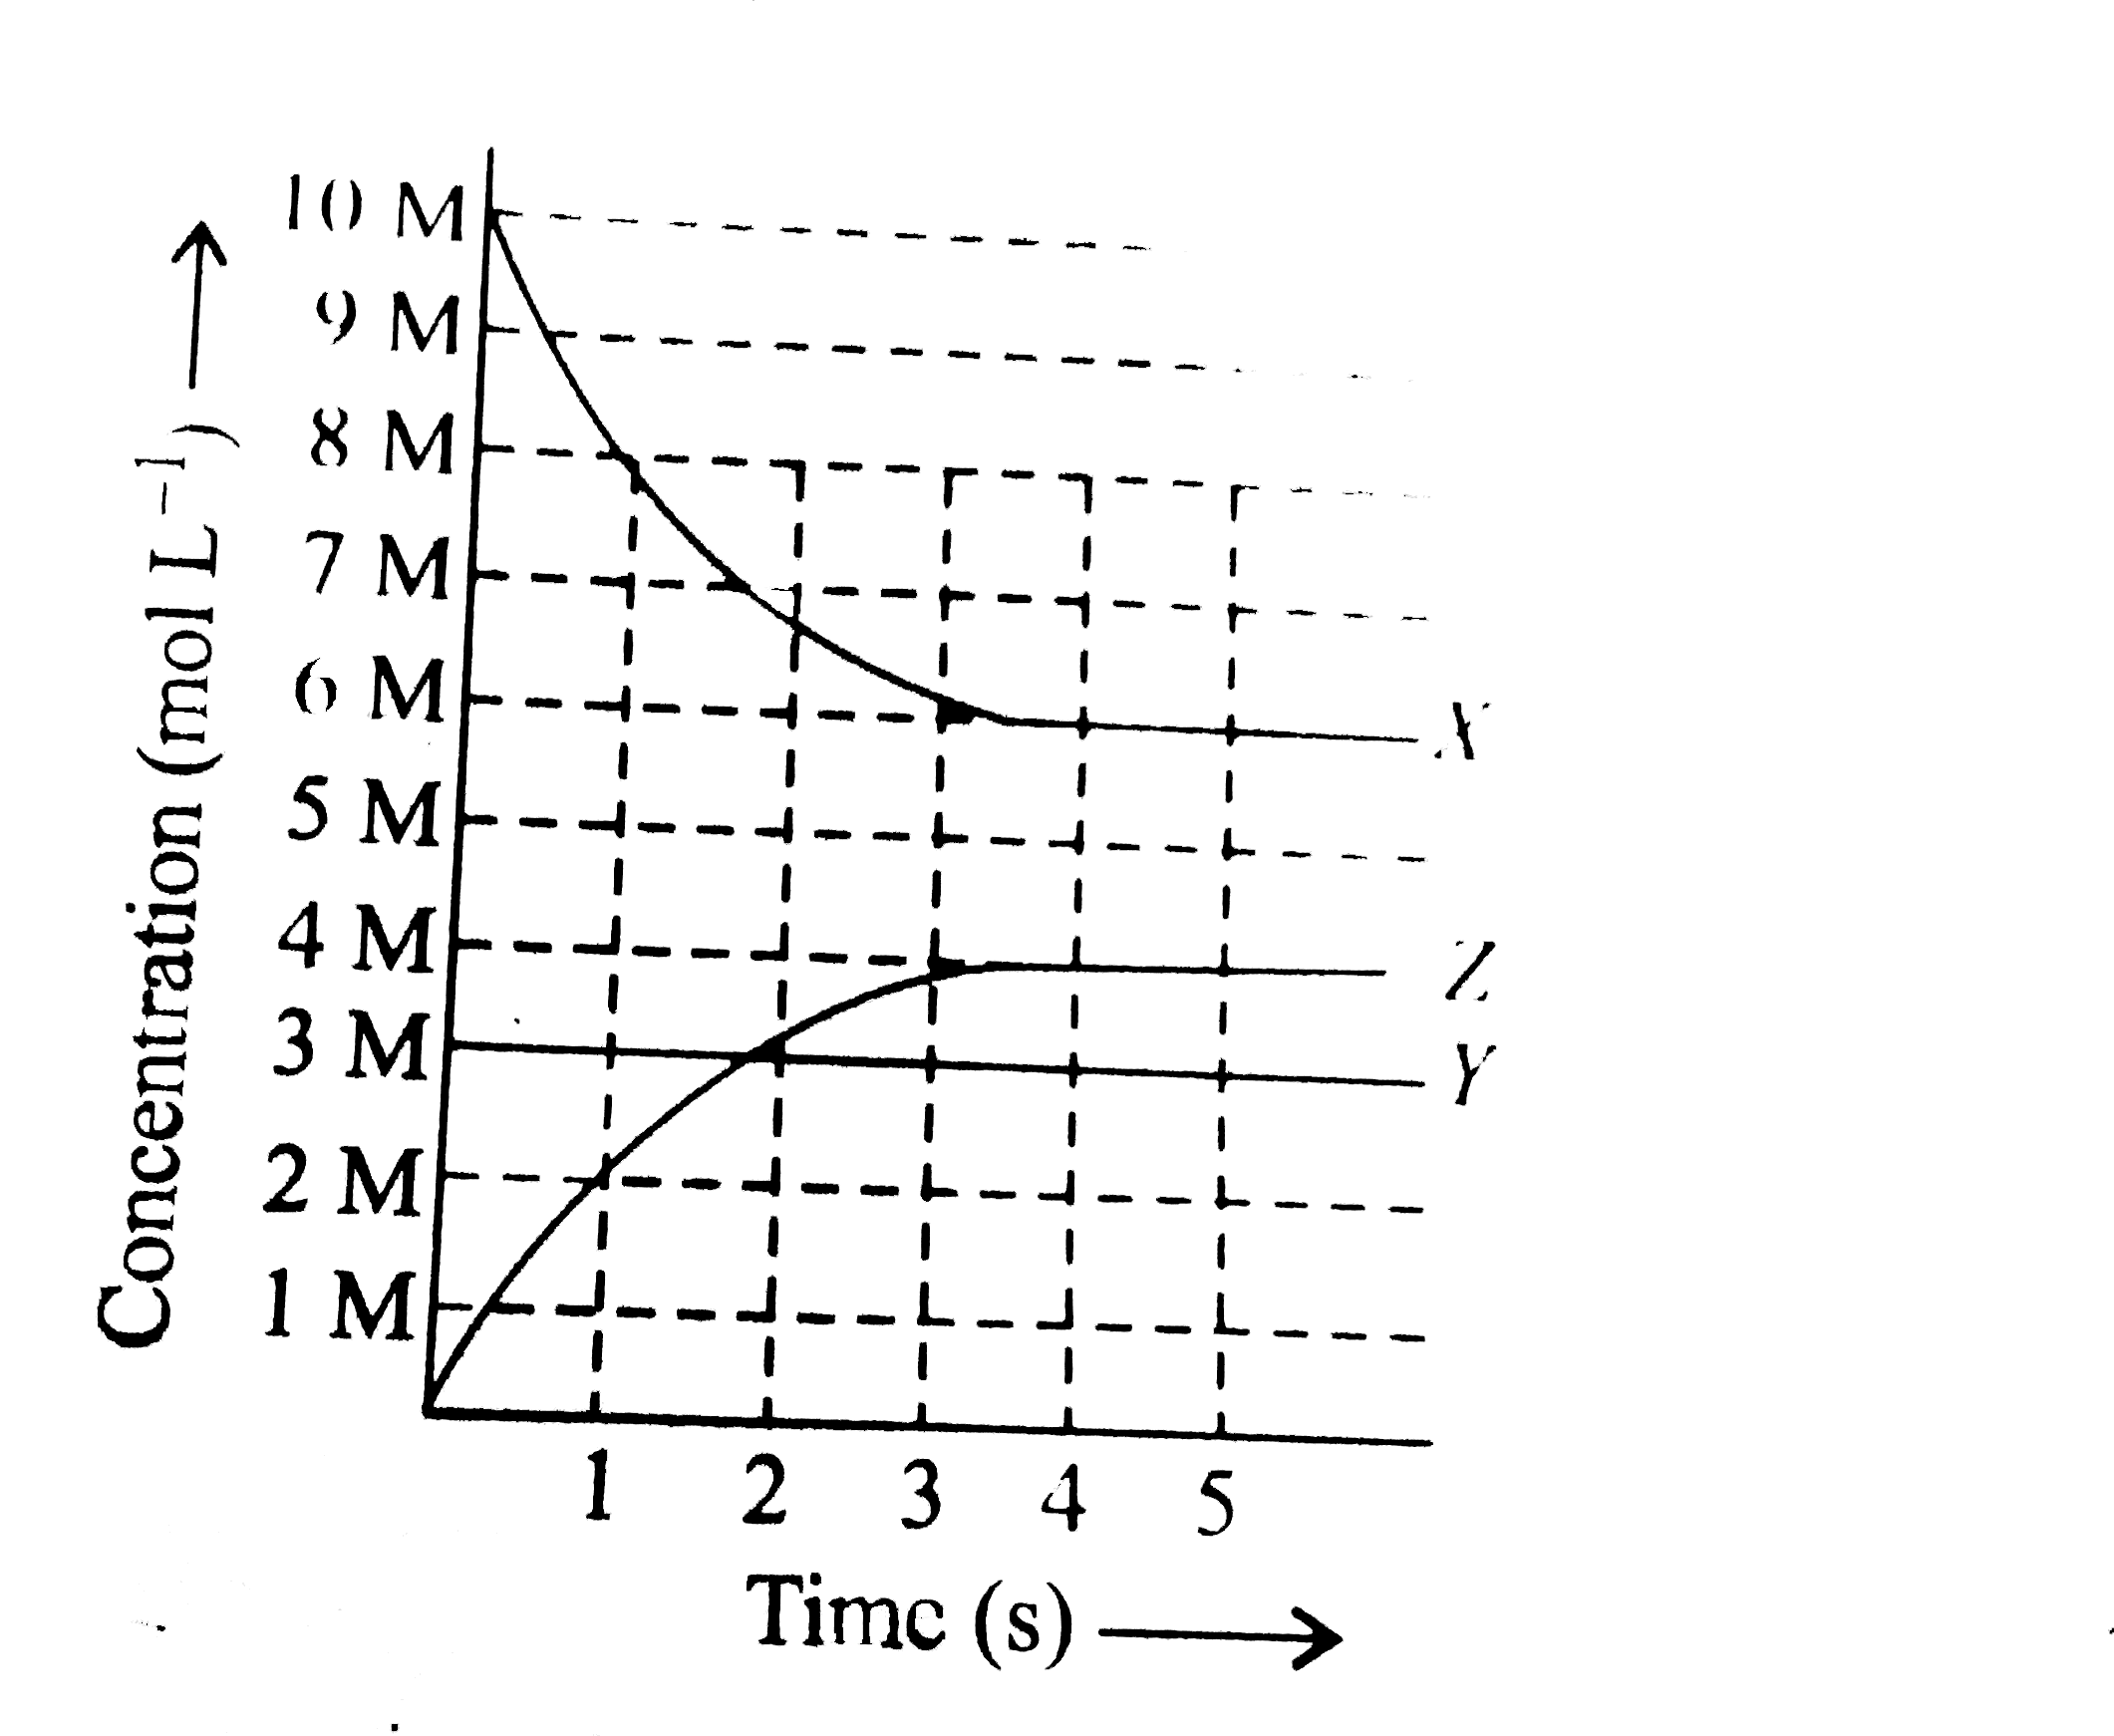
Which of the following equilibrium reaction represents the correct variation of concentration with time?
X(g)+Y(g)⇔Z(g)
X(g)+Y(s)⇔Z(g)
Z(g)+Y(g)⇔X(g)
Z(g)+X(g)⇔Y(g)
The correct Answer is:C
The concentration of [Y]
is constant ⇒y must be solid. The concentration of X decreases white the concentration of Z increases.
Therefore X must be reactant and Z must be product.
Topper's Solved these Questions
- CHEMICAL EQUILIBRIUMBOOK - CENGAGE CHEMISTRY ENGLISHCHAPTER - CHEMICAL EQUILIBRIUMEXERCISE - Exercises (Multiple Correct)
26 Videos
- CHEMICAL EQUILIBRIUMBOOK - CENGAGE CHEMISTRY ENGLISHCHAPTER - CHEMICAL EQUILIBRIUMEXERCISE - Exercises (Single Correct)
58 Videos
- CHEMICAL EQUILIBRIUMBOOK - CENGAGE CHEMISTRY ENGLISHCHAPTER - CHEMICAL EQUILIBRIUMEXERCISE - Exercises (Subjective)
46 Videos
- CHEMICAL BONDING AND MOLECULAR STRUCTUREBOOK - CENGAGE CHEMISTRY ENGLISHCHAPTER - CHEMICAL BONDING AND MOLECULAR STRUCTUREEXERCISE - Archives Subjective
15 Videos
- CLASSIFICATION AND NOMENCLATURE OF ORGANIC COMPOUNDSBOOK - CENGAGE CHEMISTRY ENGLISHCHAPTER - CLASSIFICATION AND NOMENCLATURE OF ORGANIC COMPOUNDSEXERCISE - Analytical and Descriptive Type
3 Videos
Similar Questions
X, Y and Z react in the 1:1:1 stoichiometric ratio.
The concentration of X, Y and Z we are found to vary with time as shown in the figure below:
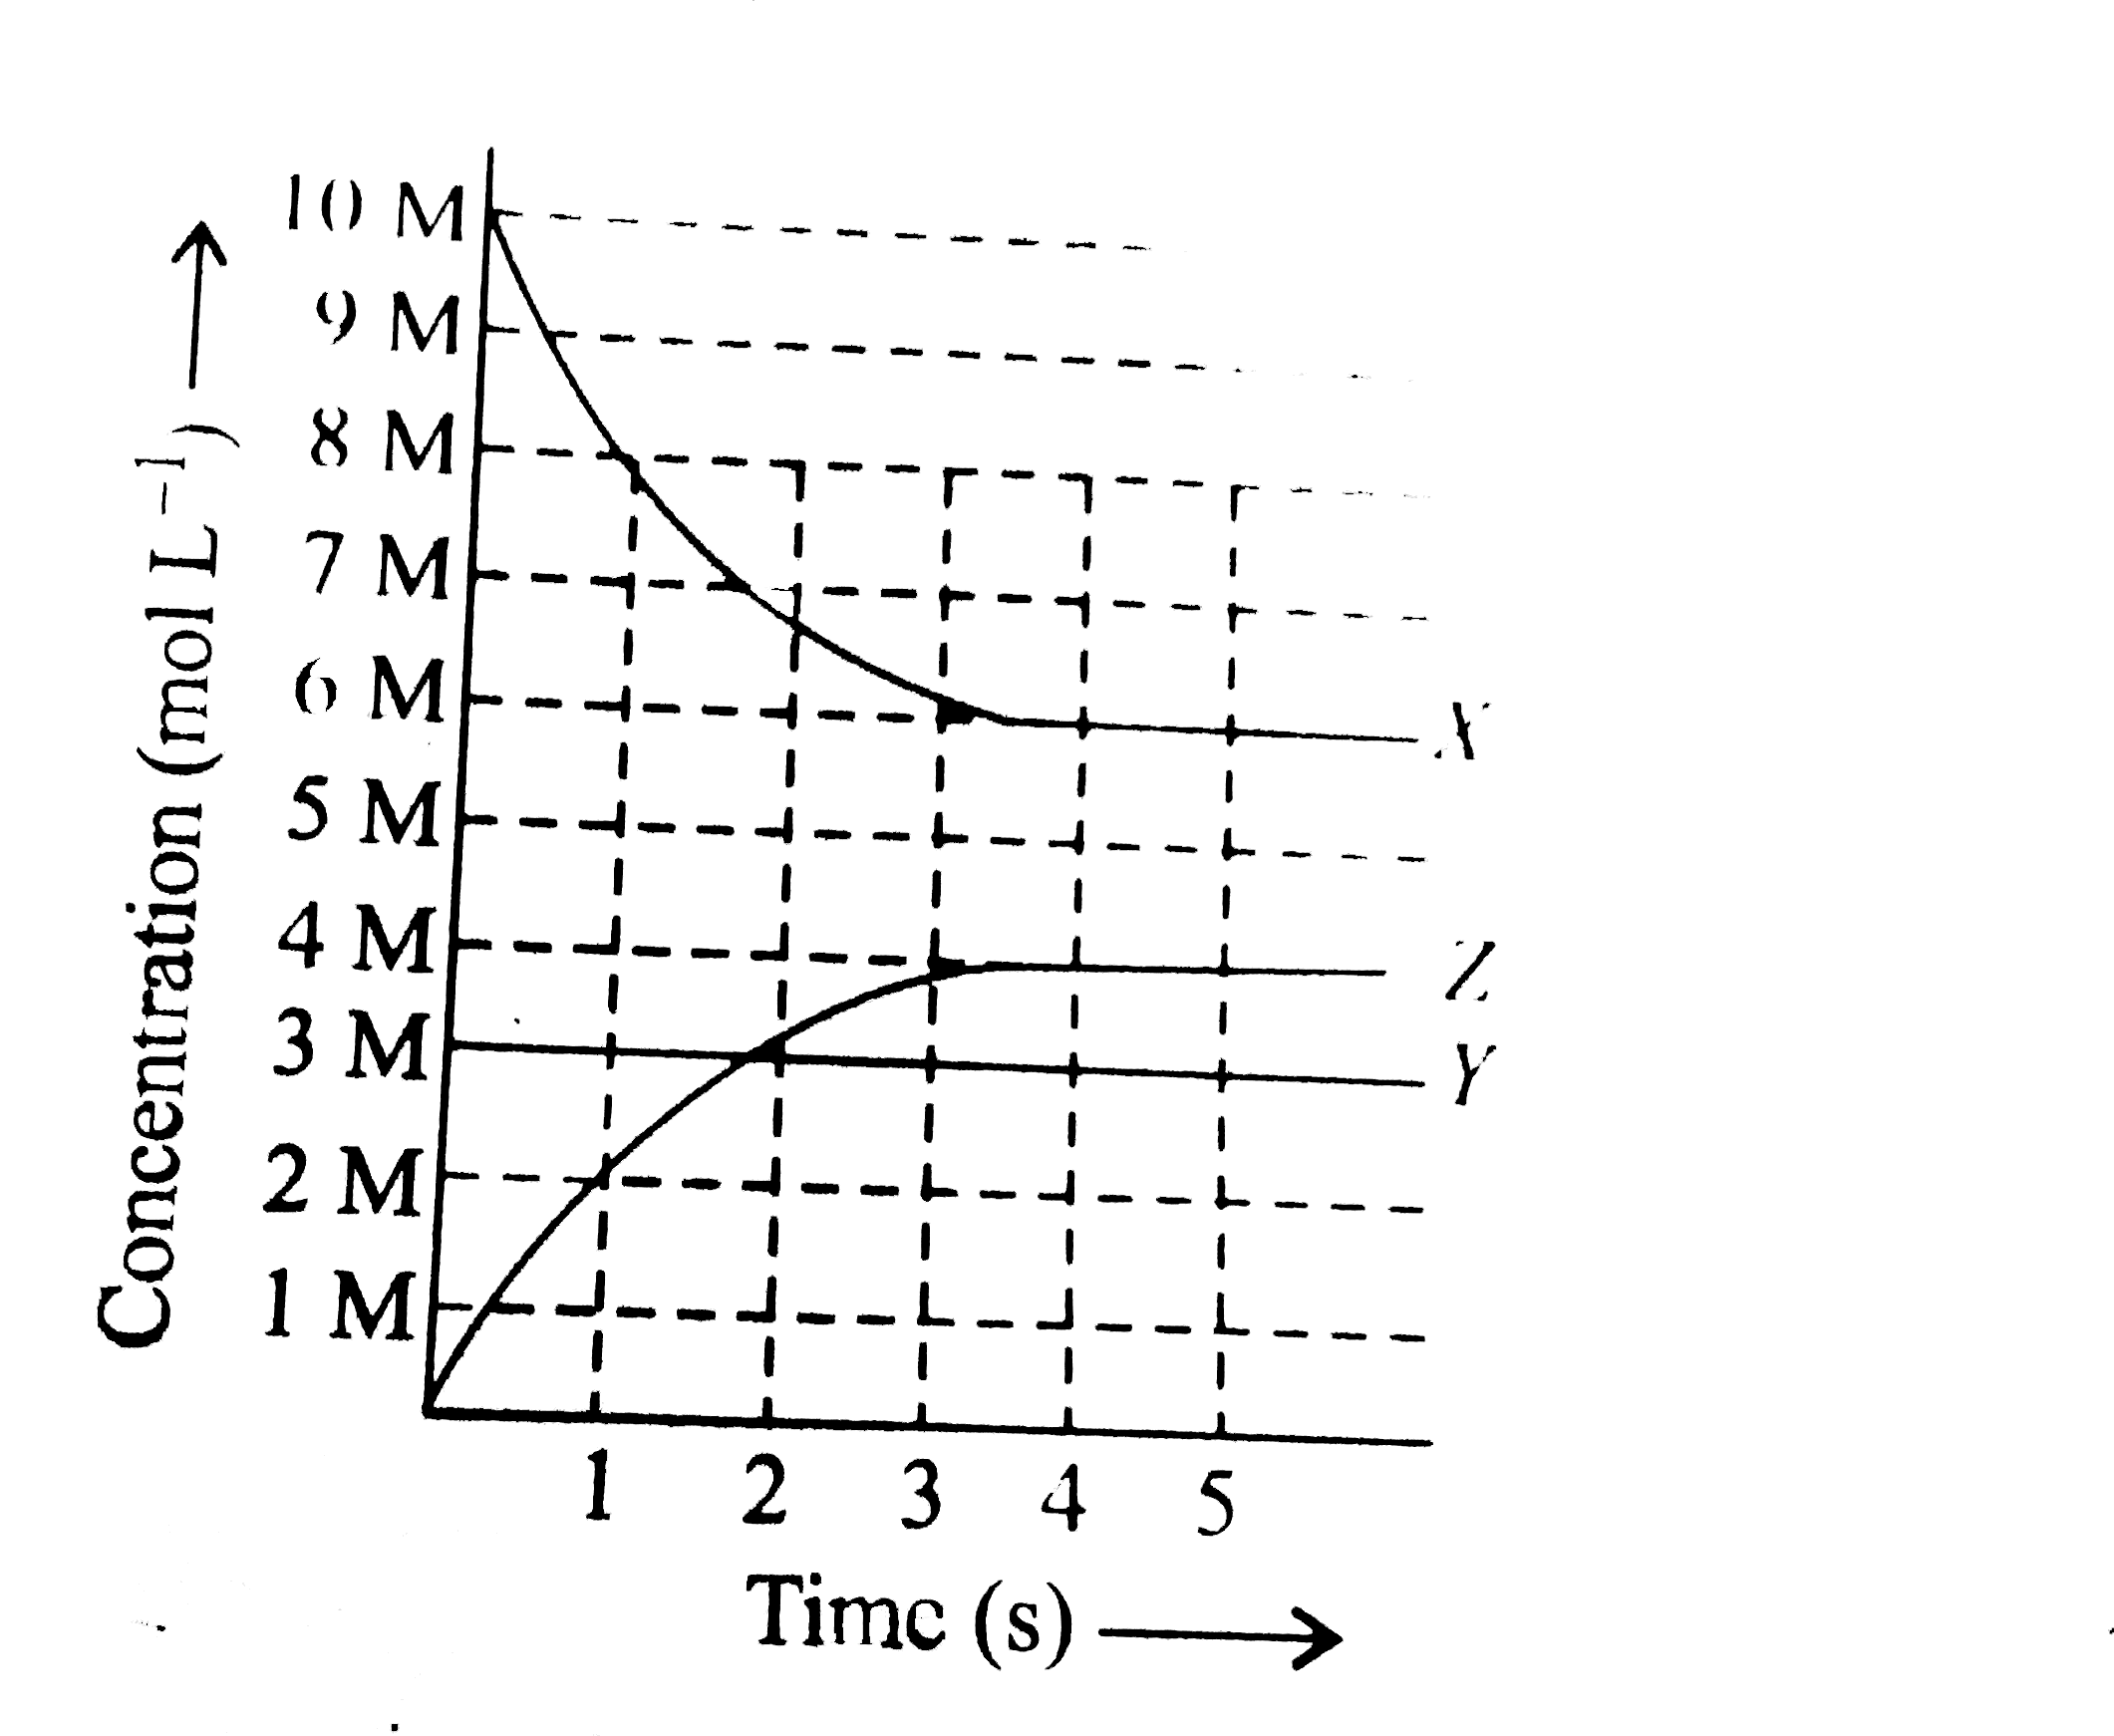
The value of the equilibrium constant (Kc) for the equilibrium represented the in above sketch will be
View SolutionX, Y and Z react in the 1:1:1 stoichiometric ratio.
The concentration of X, Y and Z we are found to vary with time as shown in the figure below:
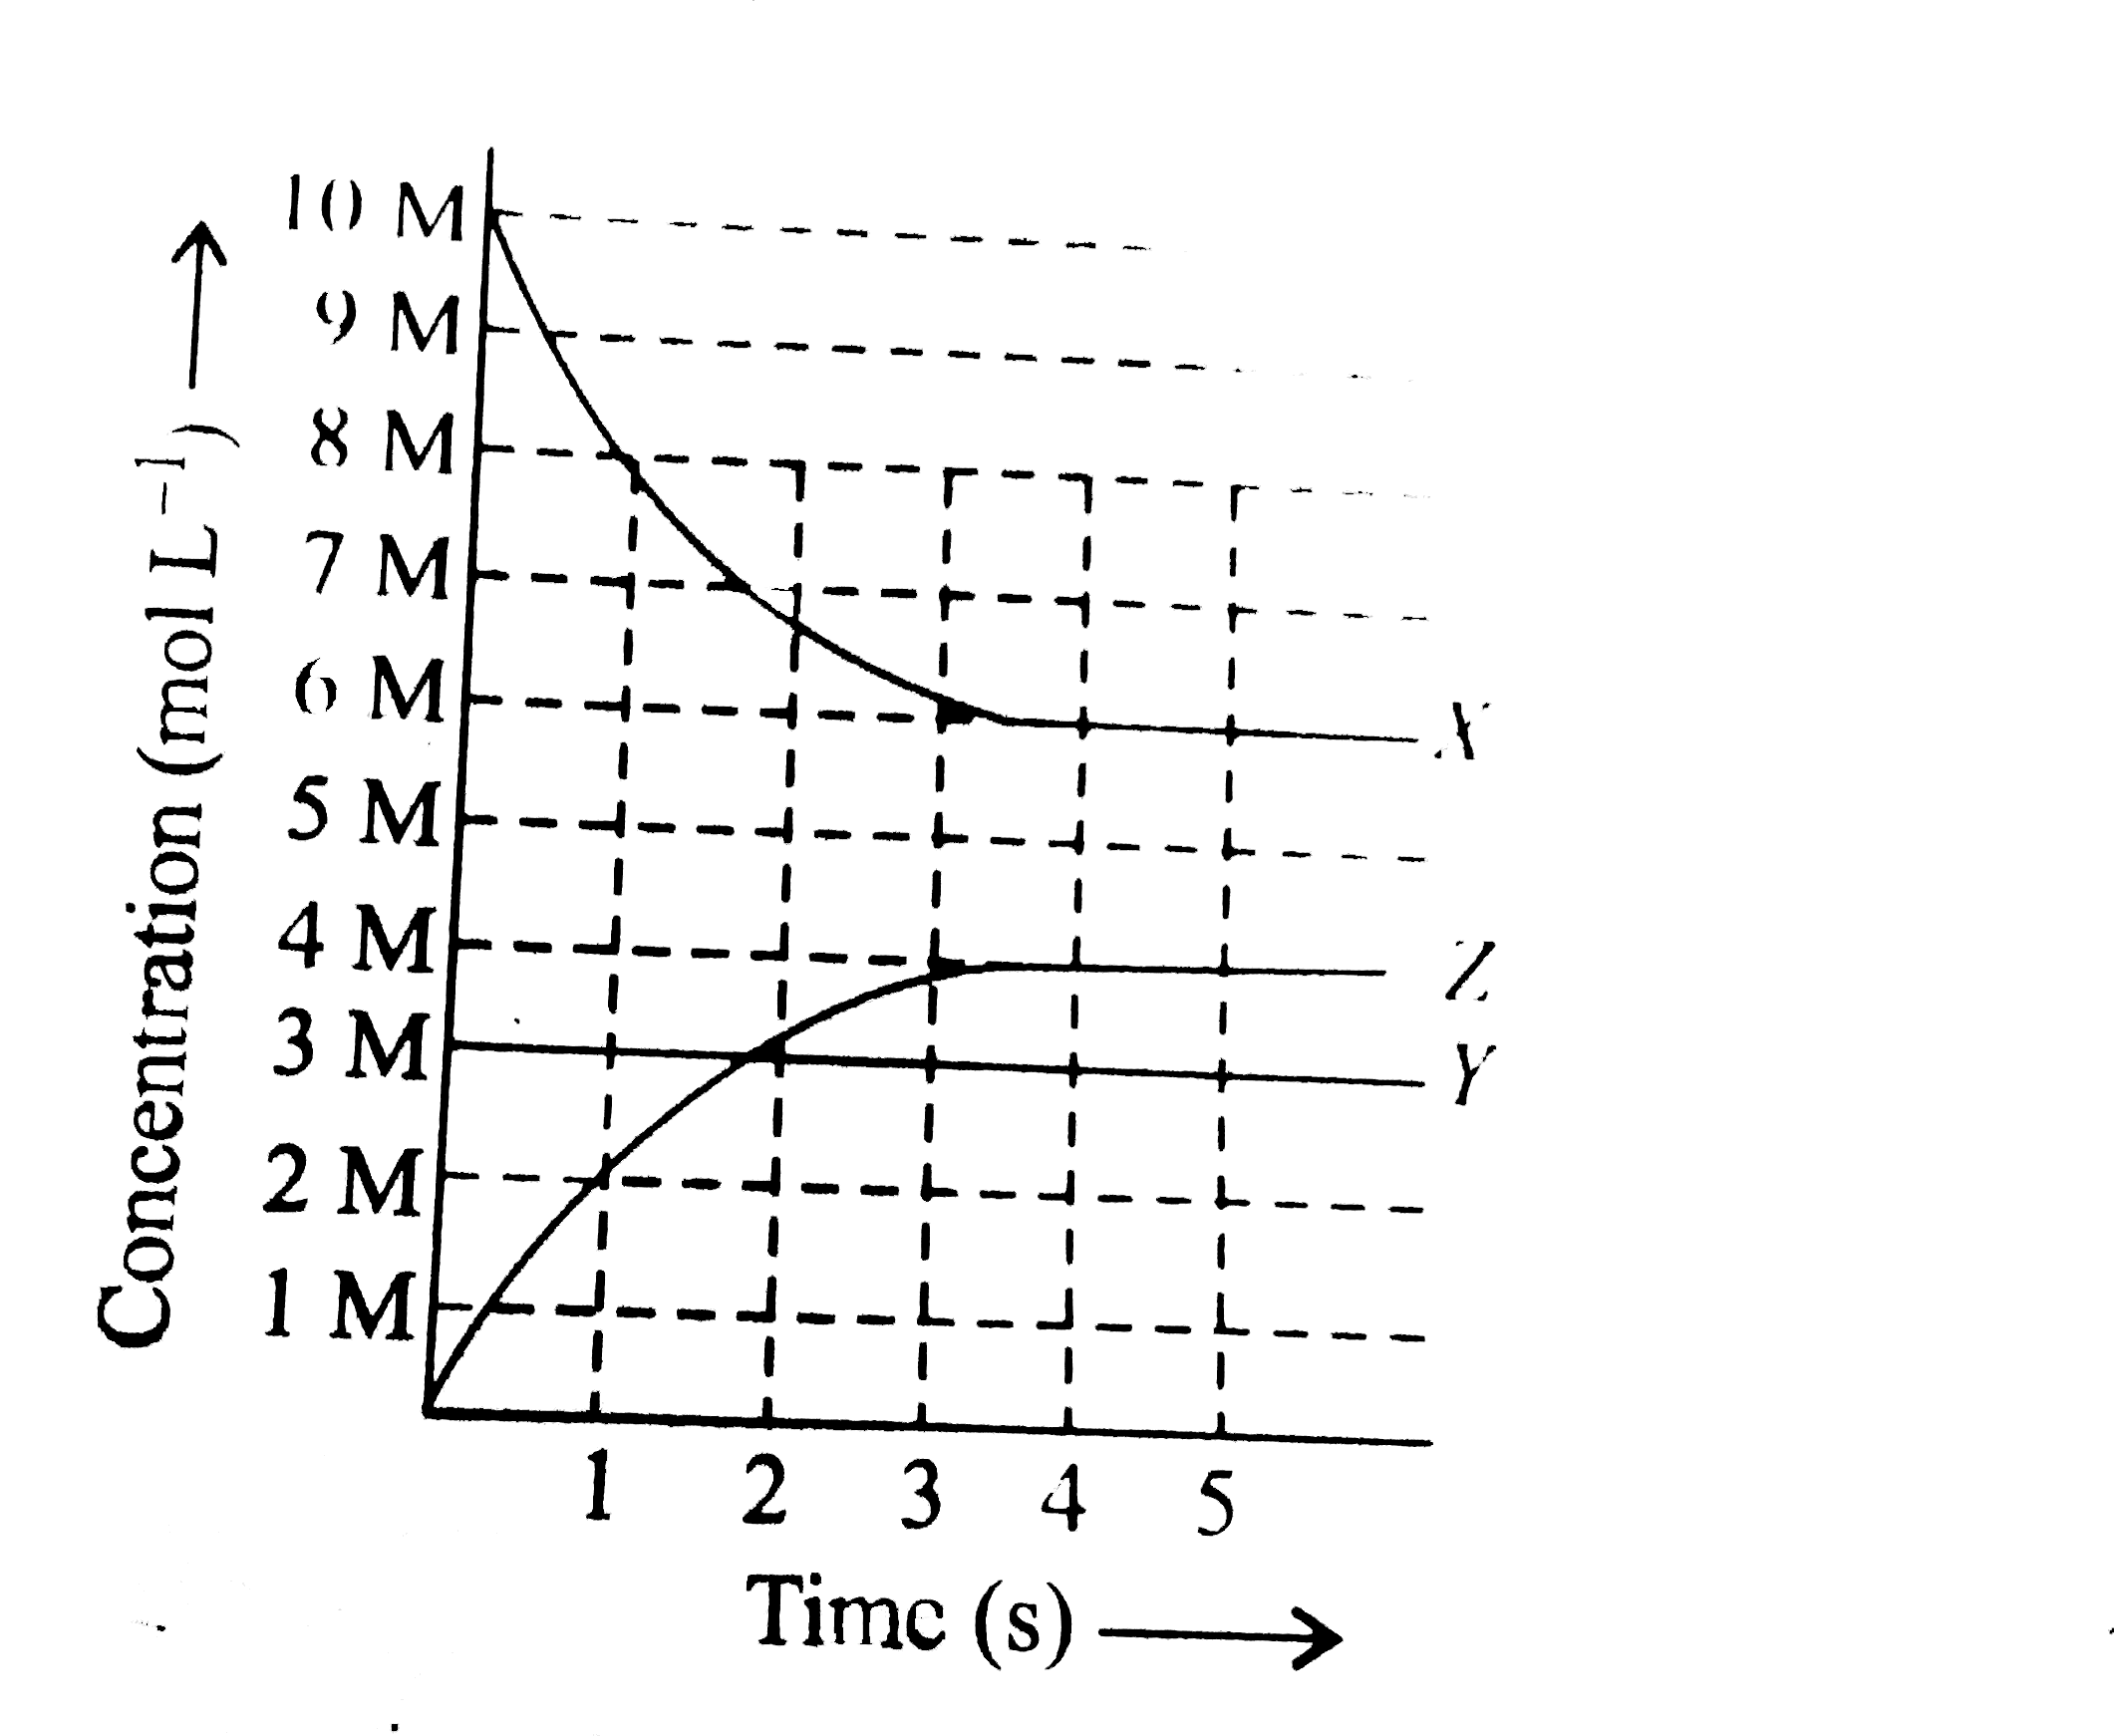
If the above equilibrium is established in a 2.0L container by taking reactants in sufficient amount then how many moles of components Y must have reacted to establish the equilibrium?
View Solution
Knowledge Check
Consider the reaction A→B. The concentration of both the reactants and the products varies exponentially with time. Which of the following figure correctly describes the change in concentration of reactants and products with time ?
A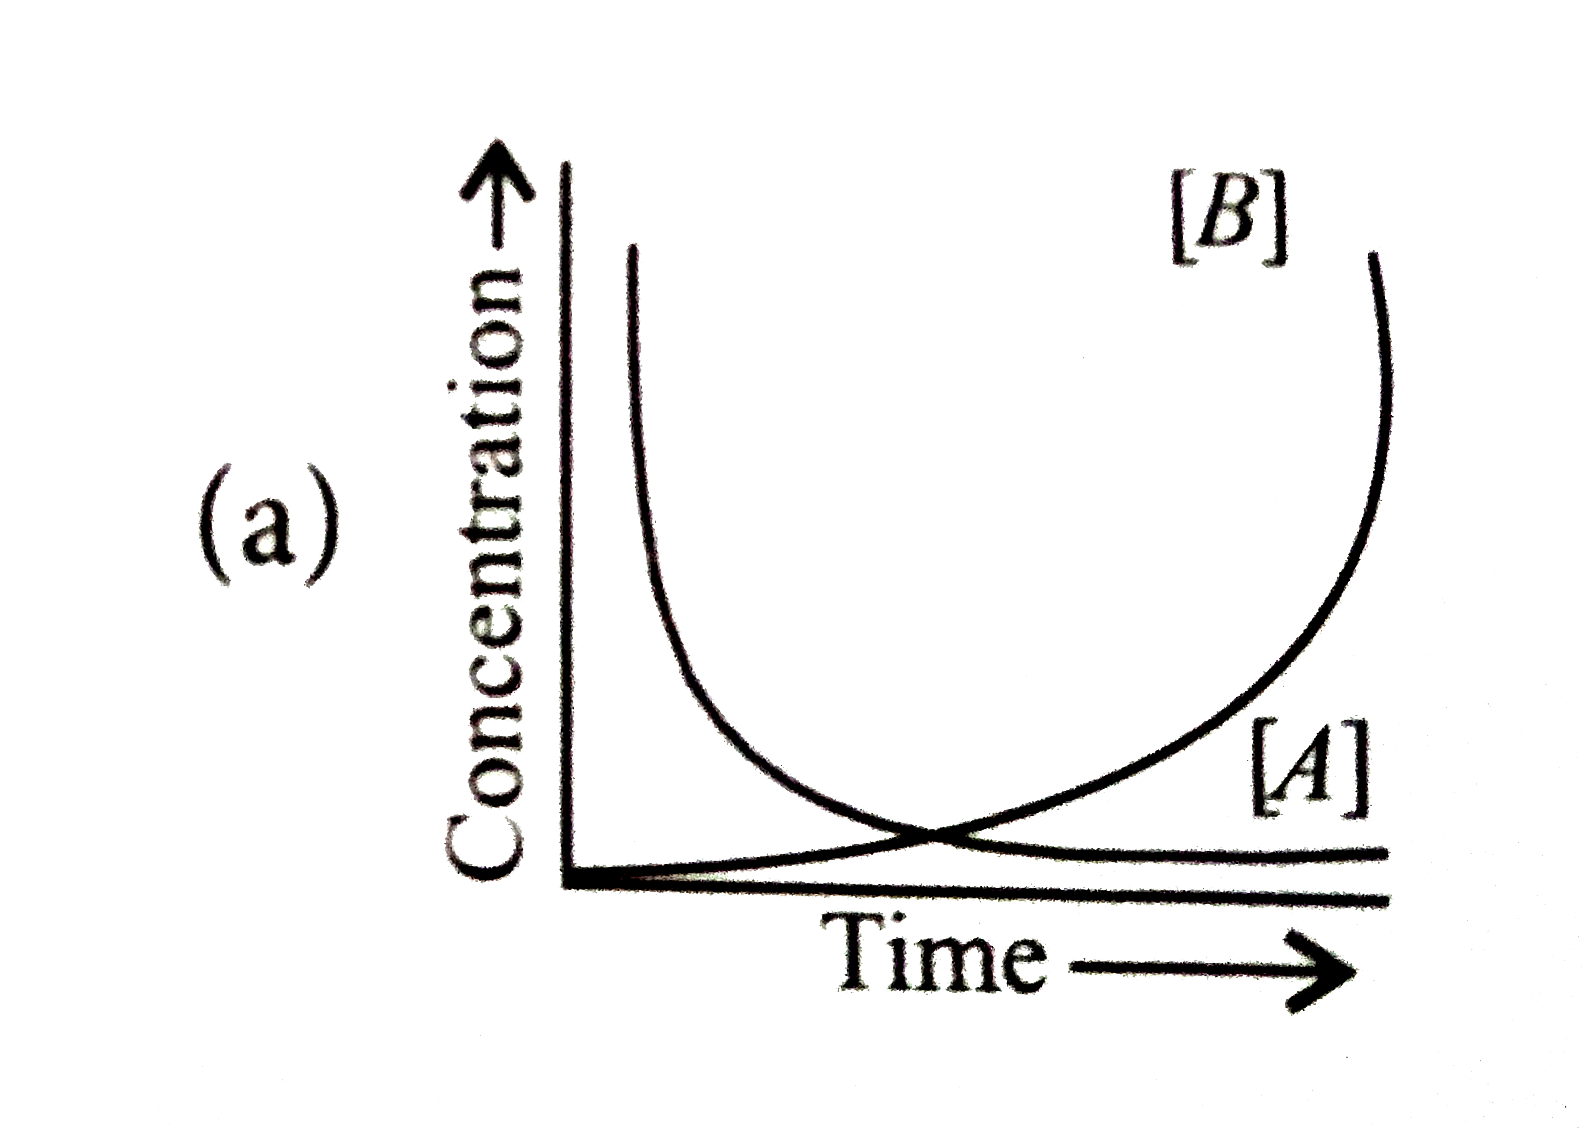 B
B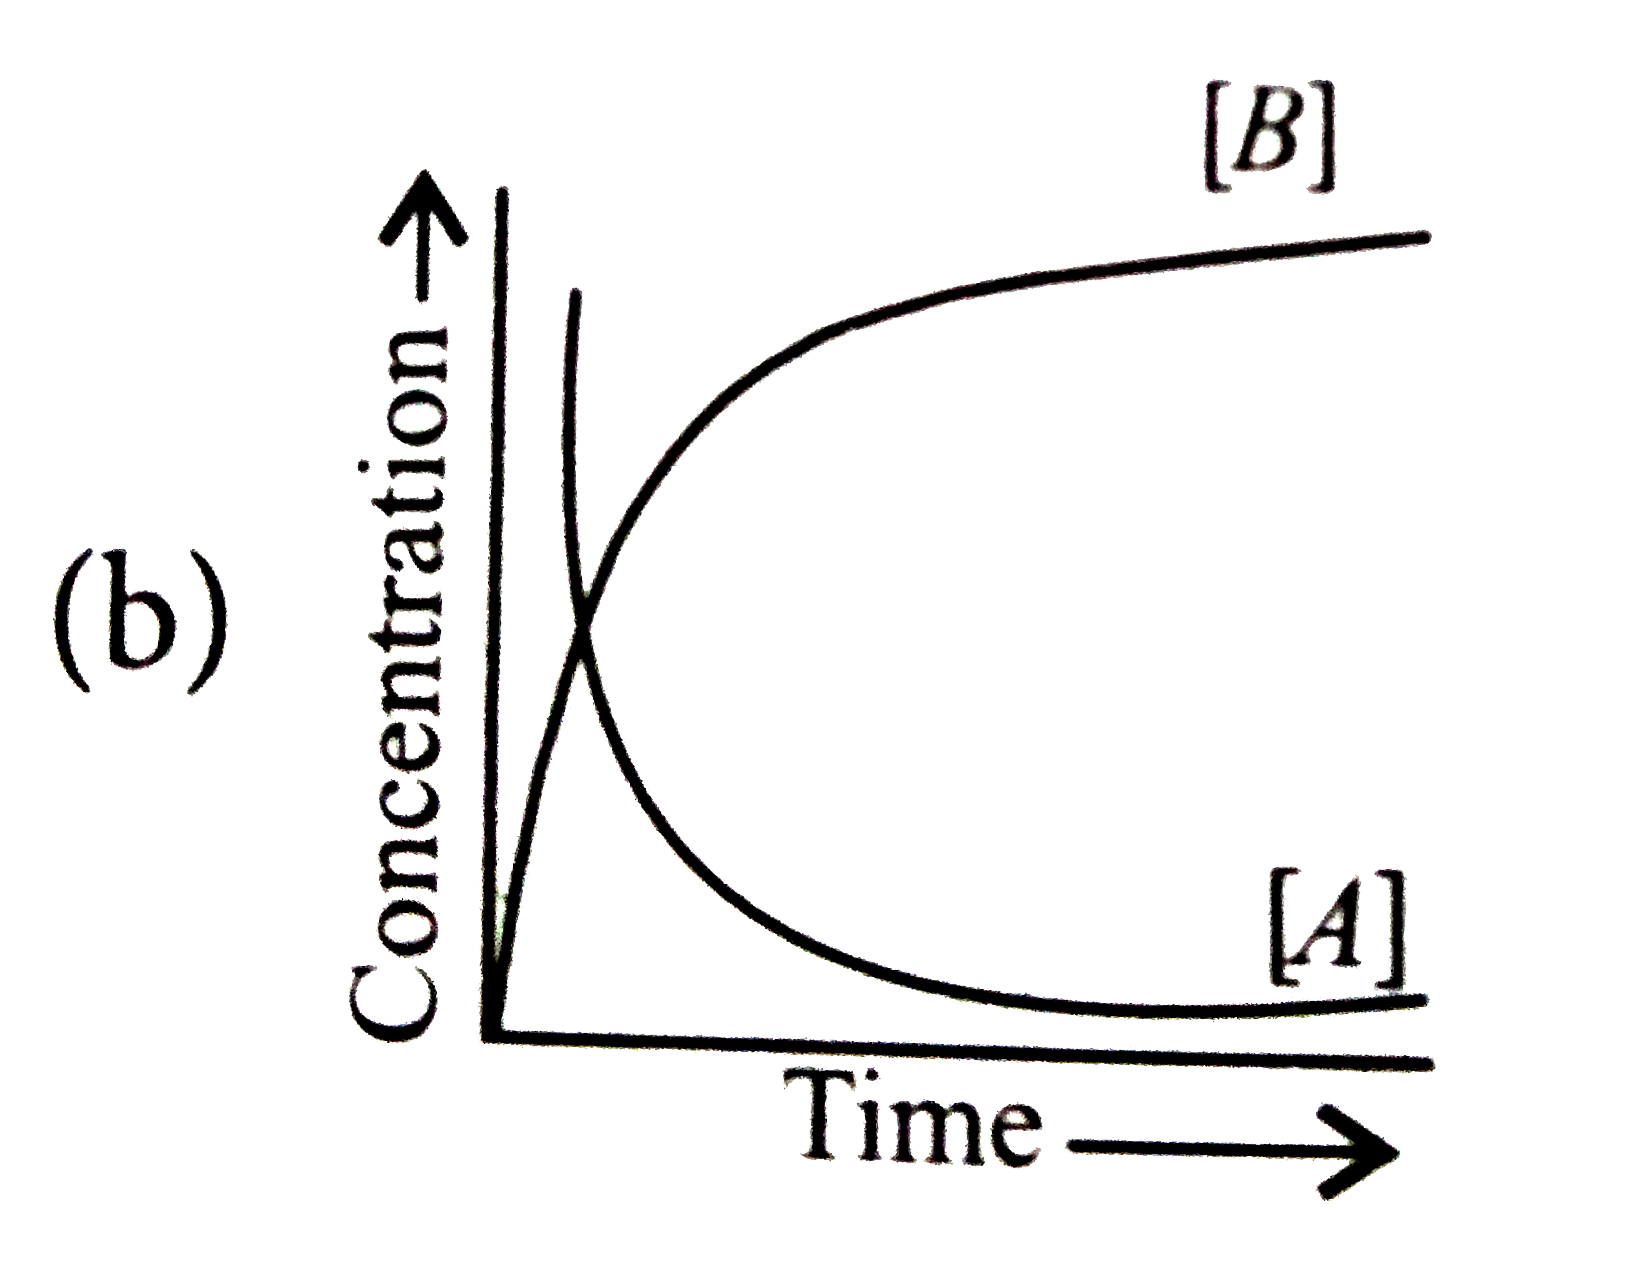 C
C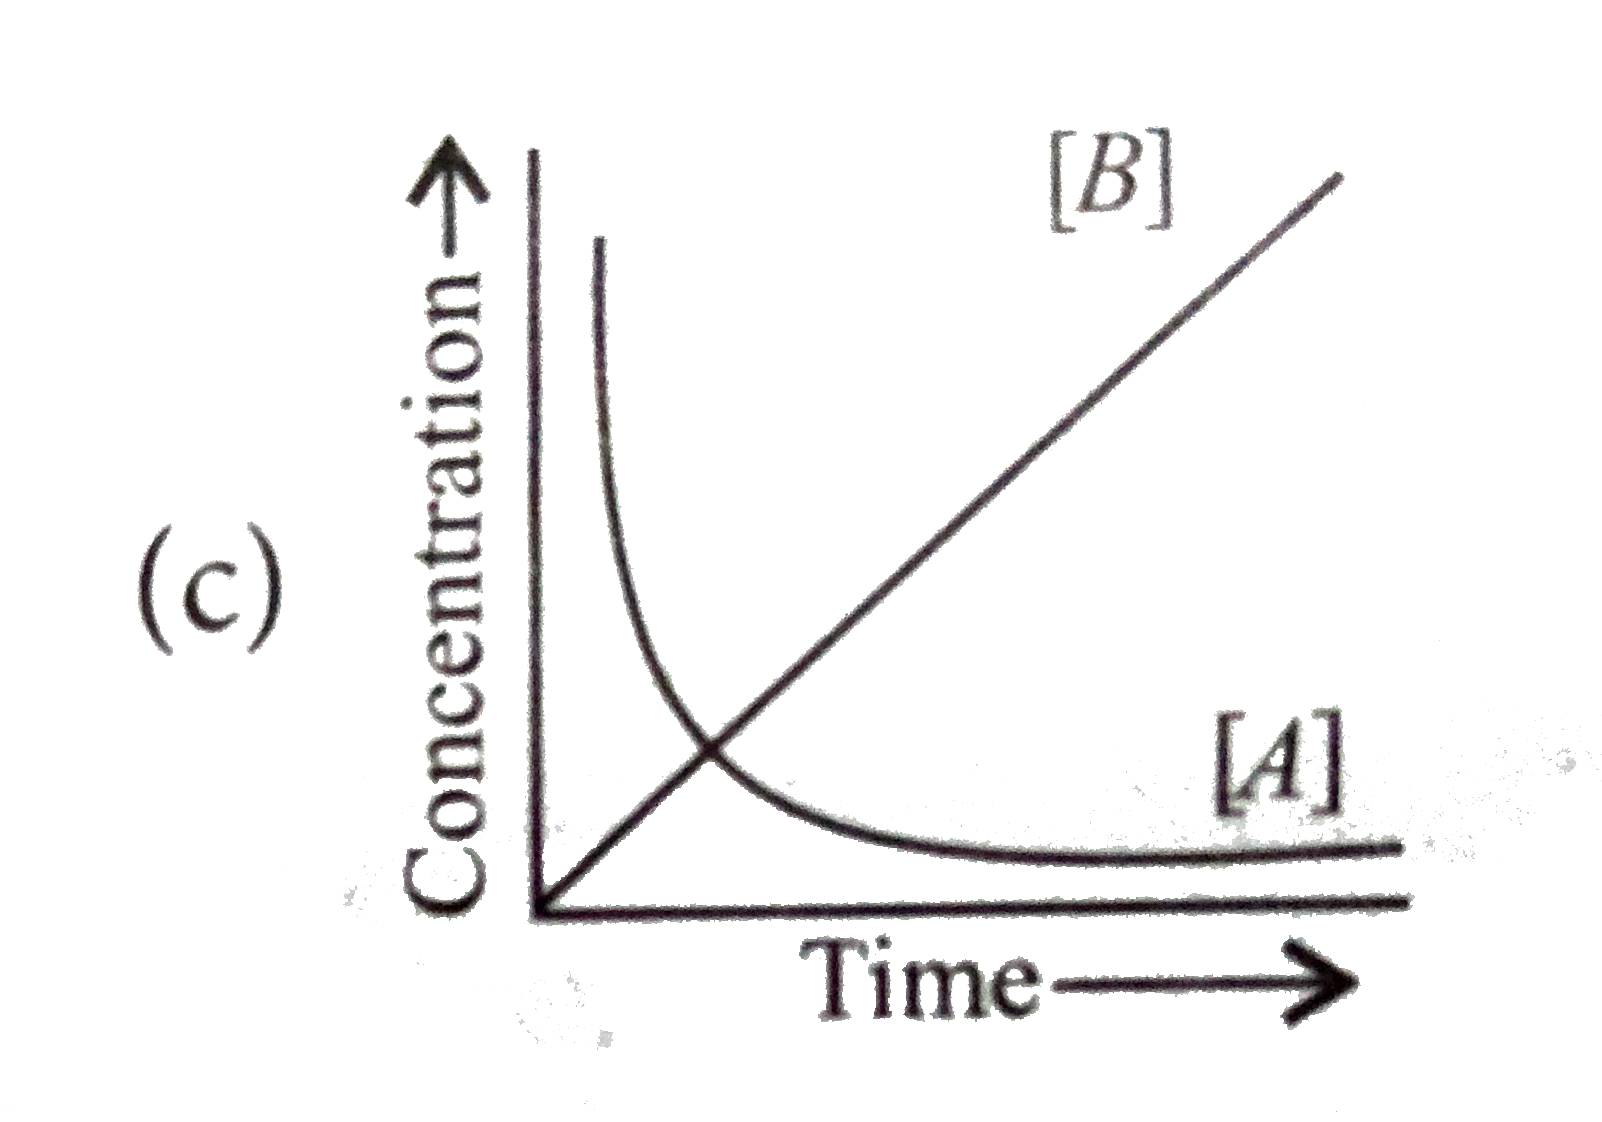 D
D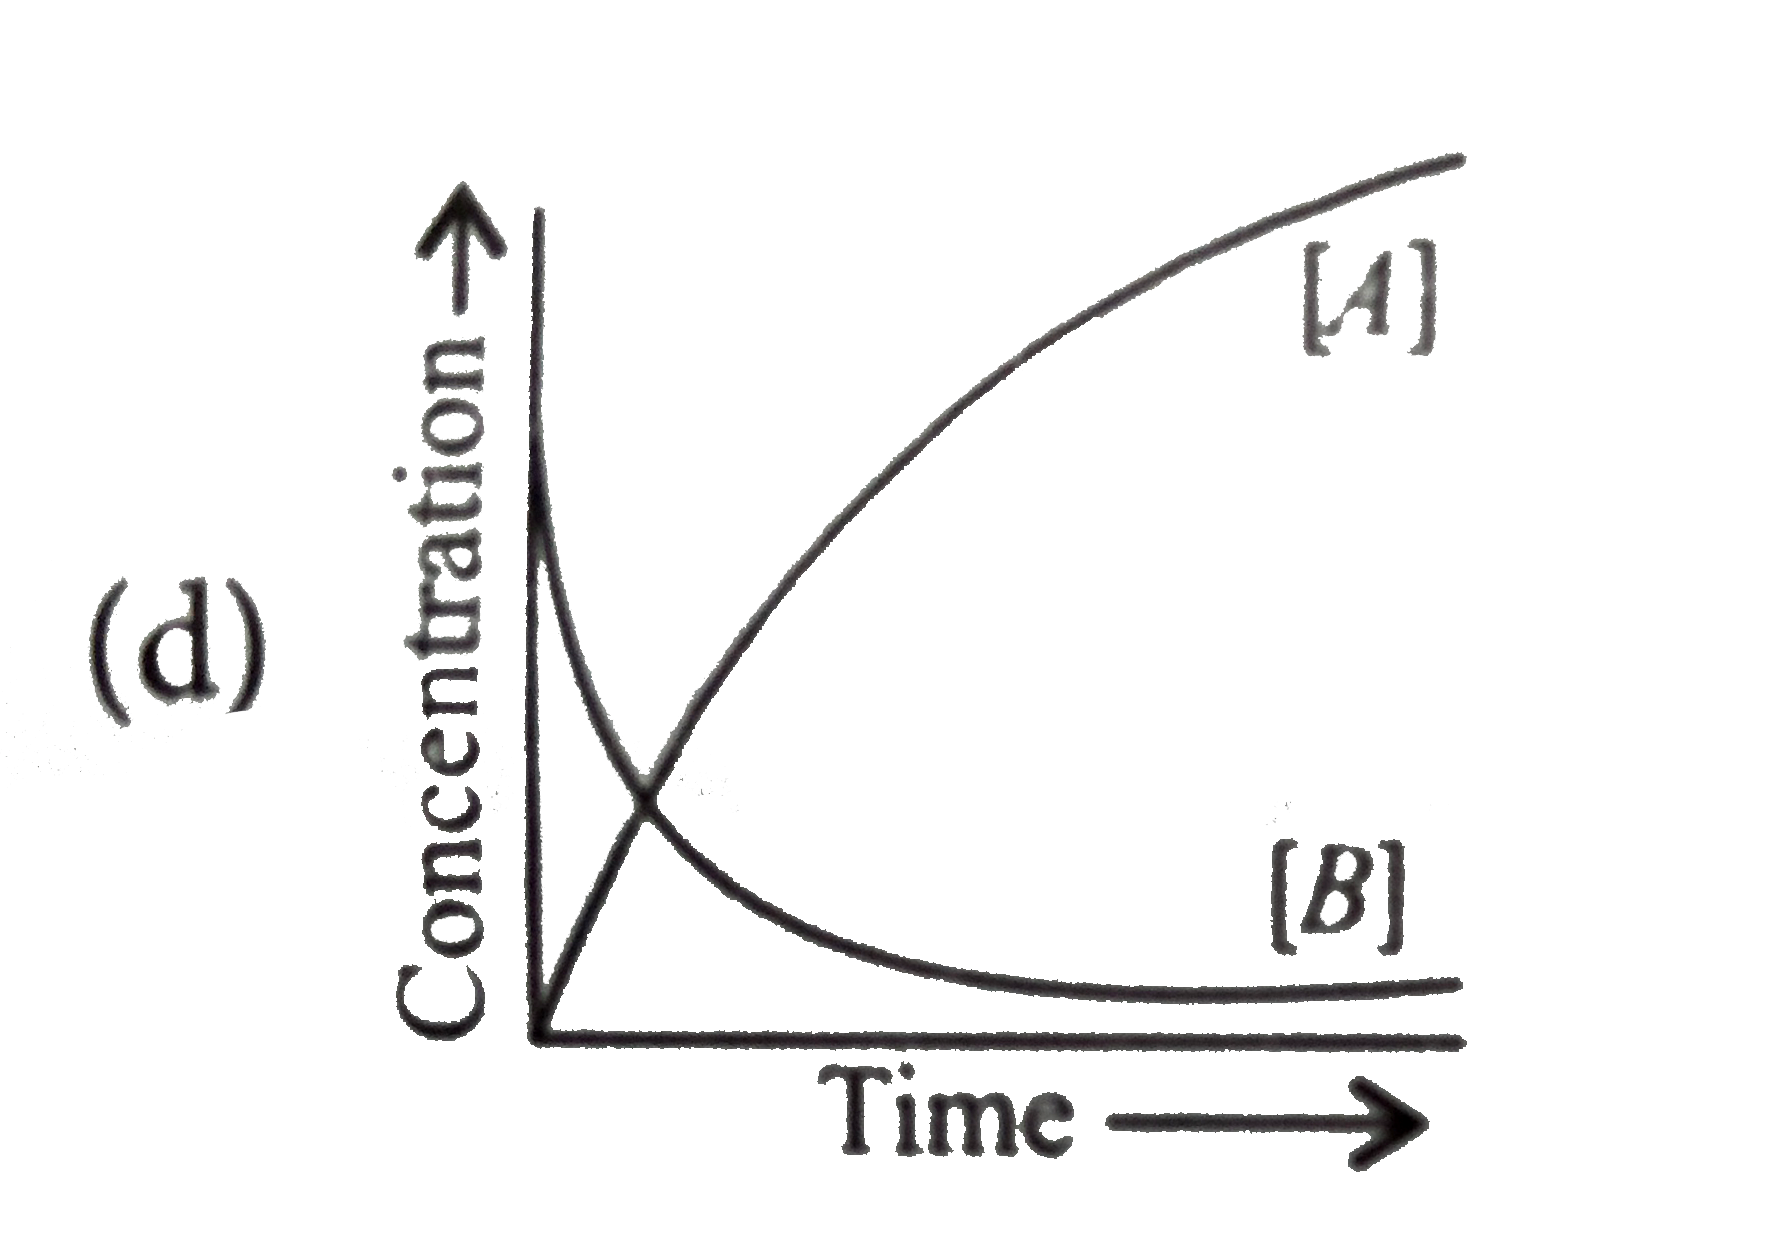
The graph of y=f(x) is shown below.
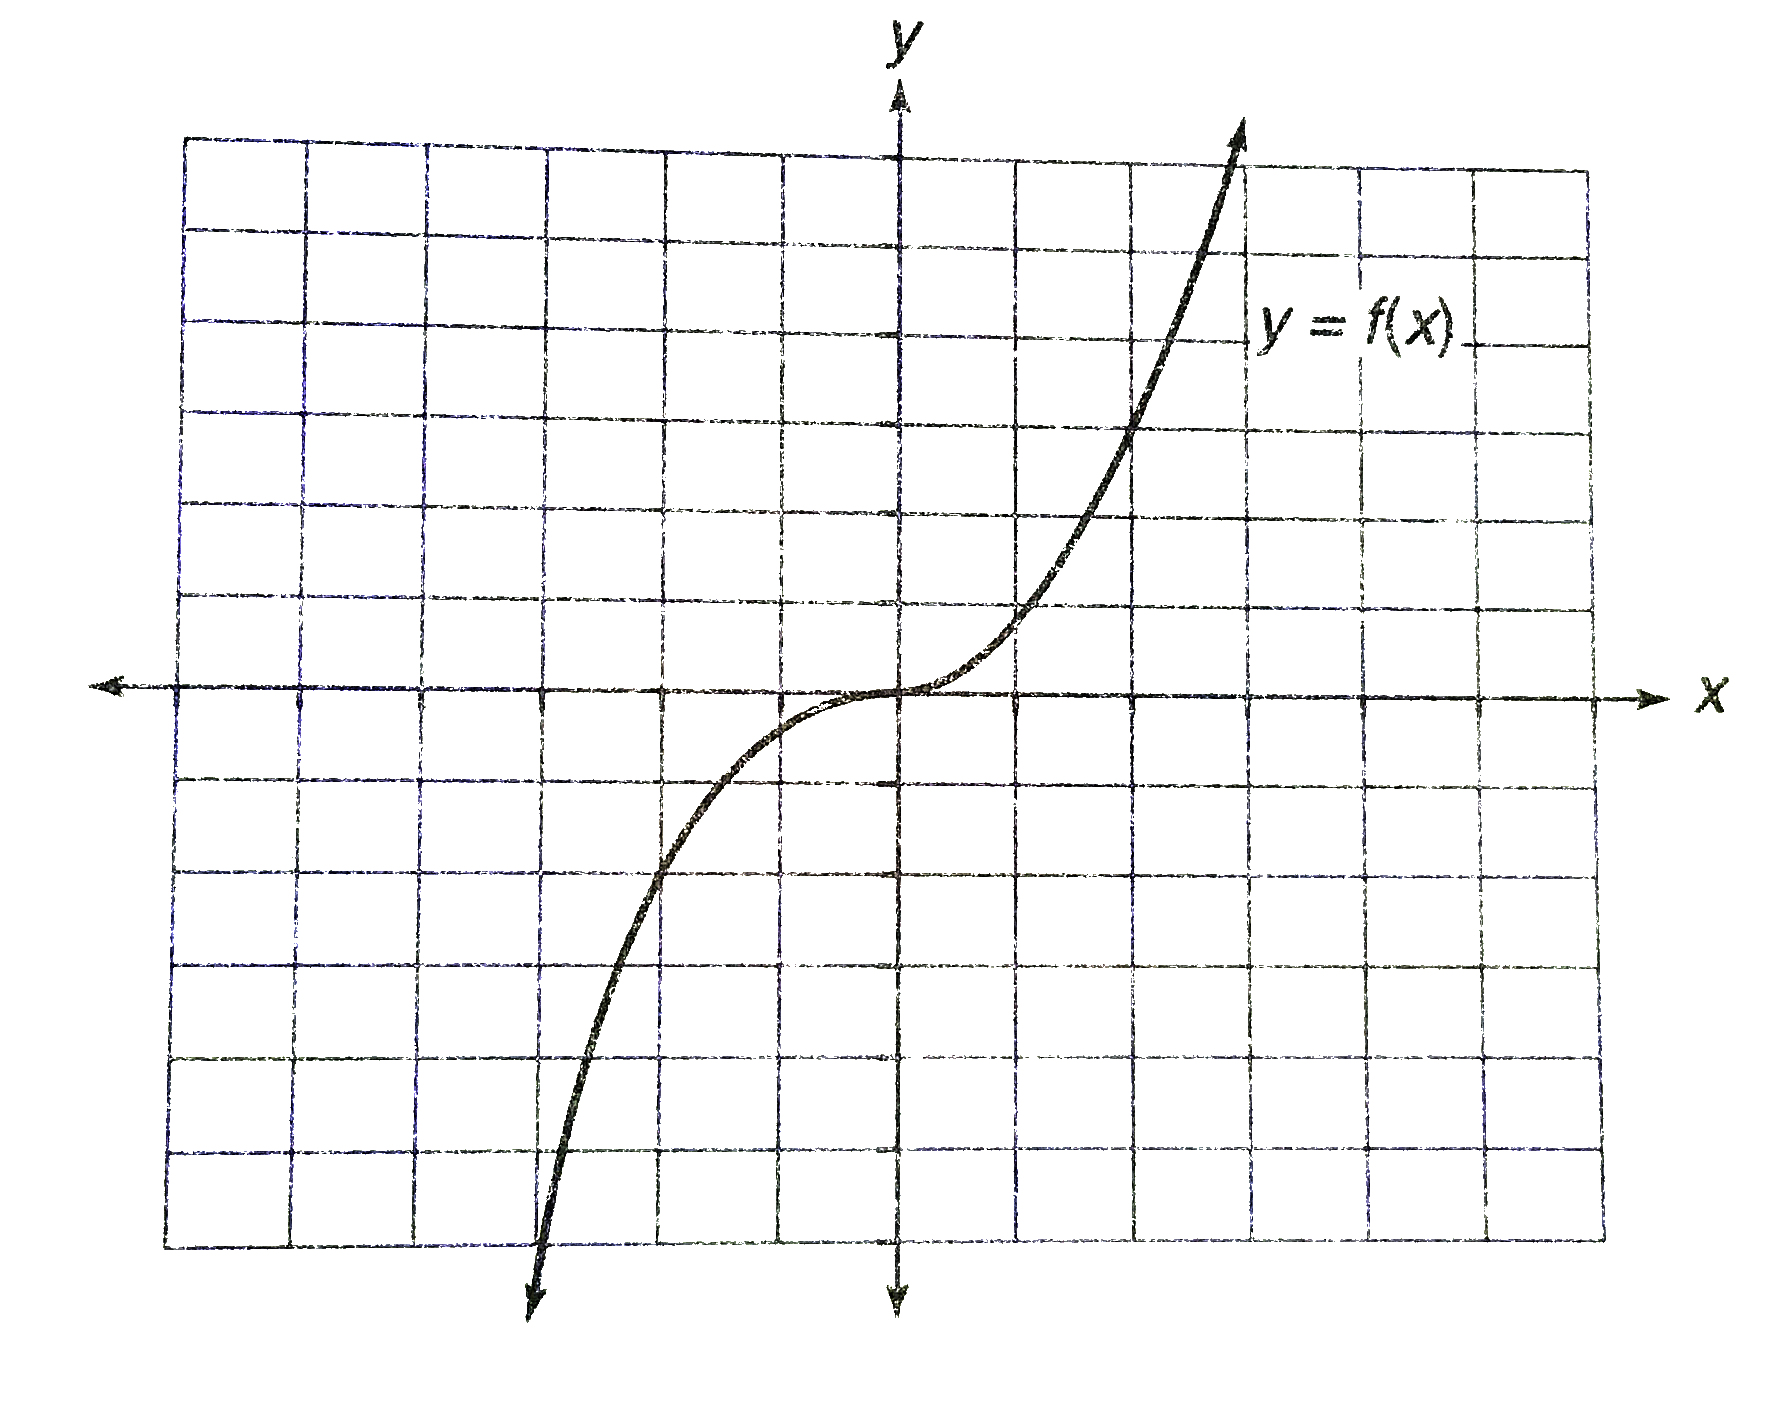
Which of the following could represents the graph of y=f(x−2)+1?A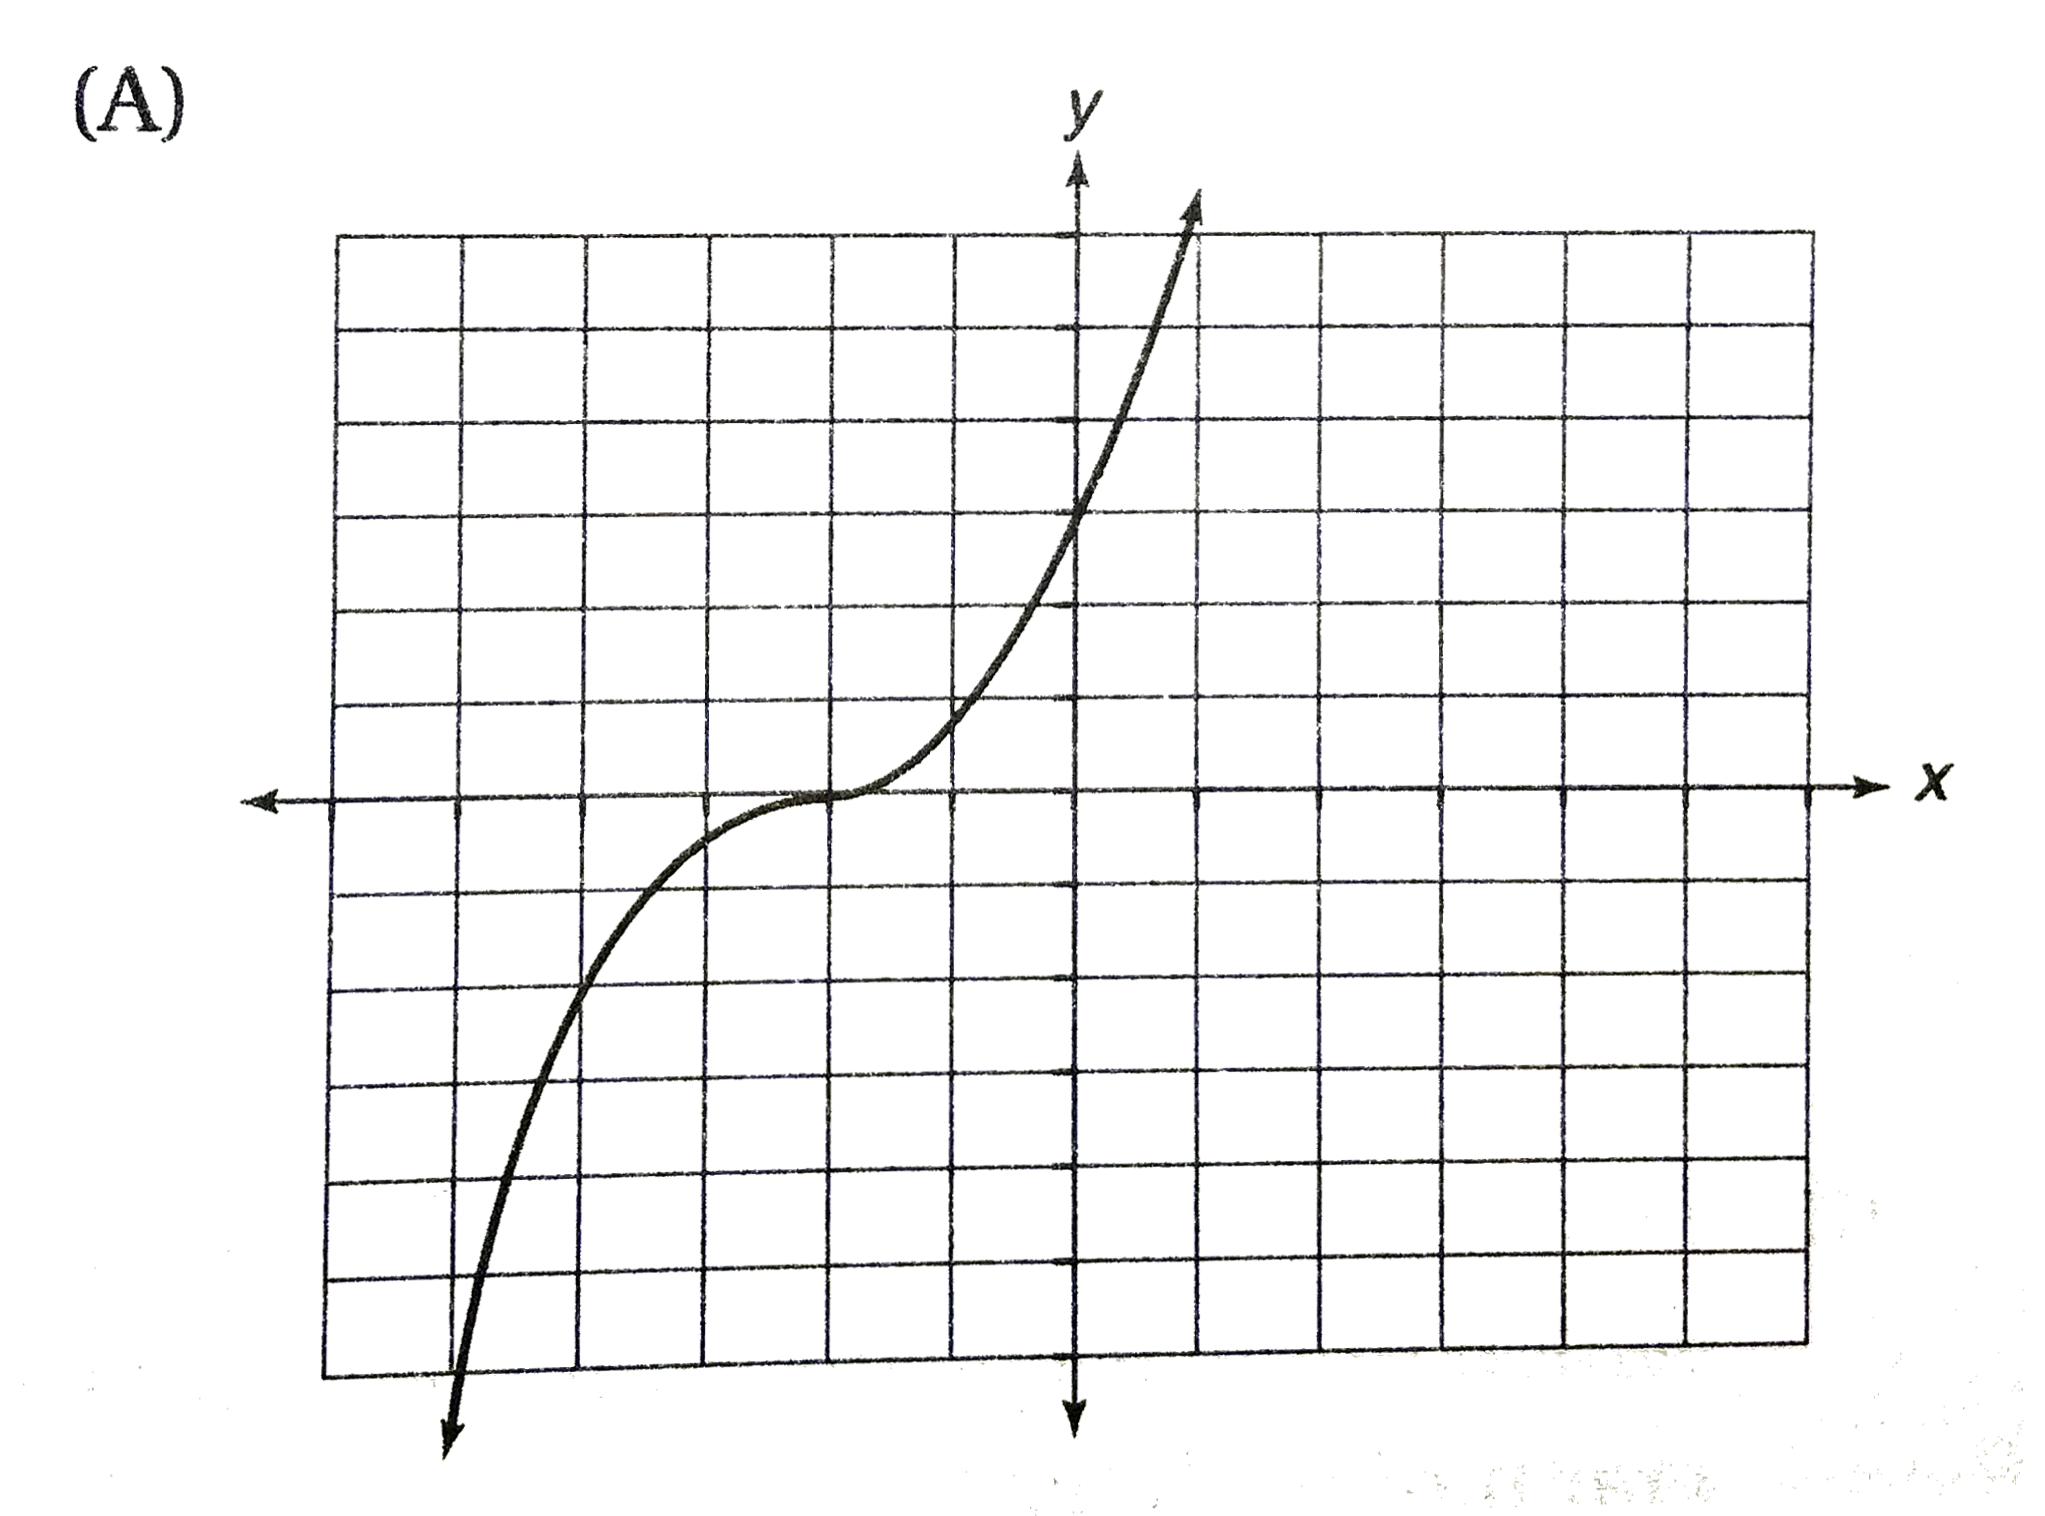 B
B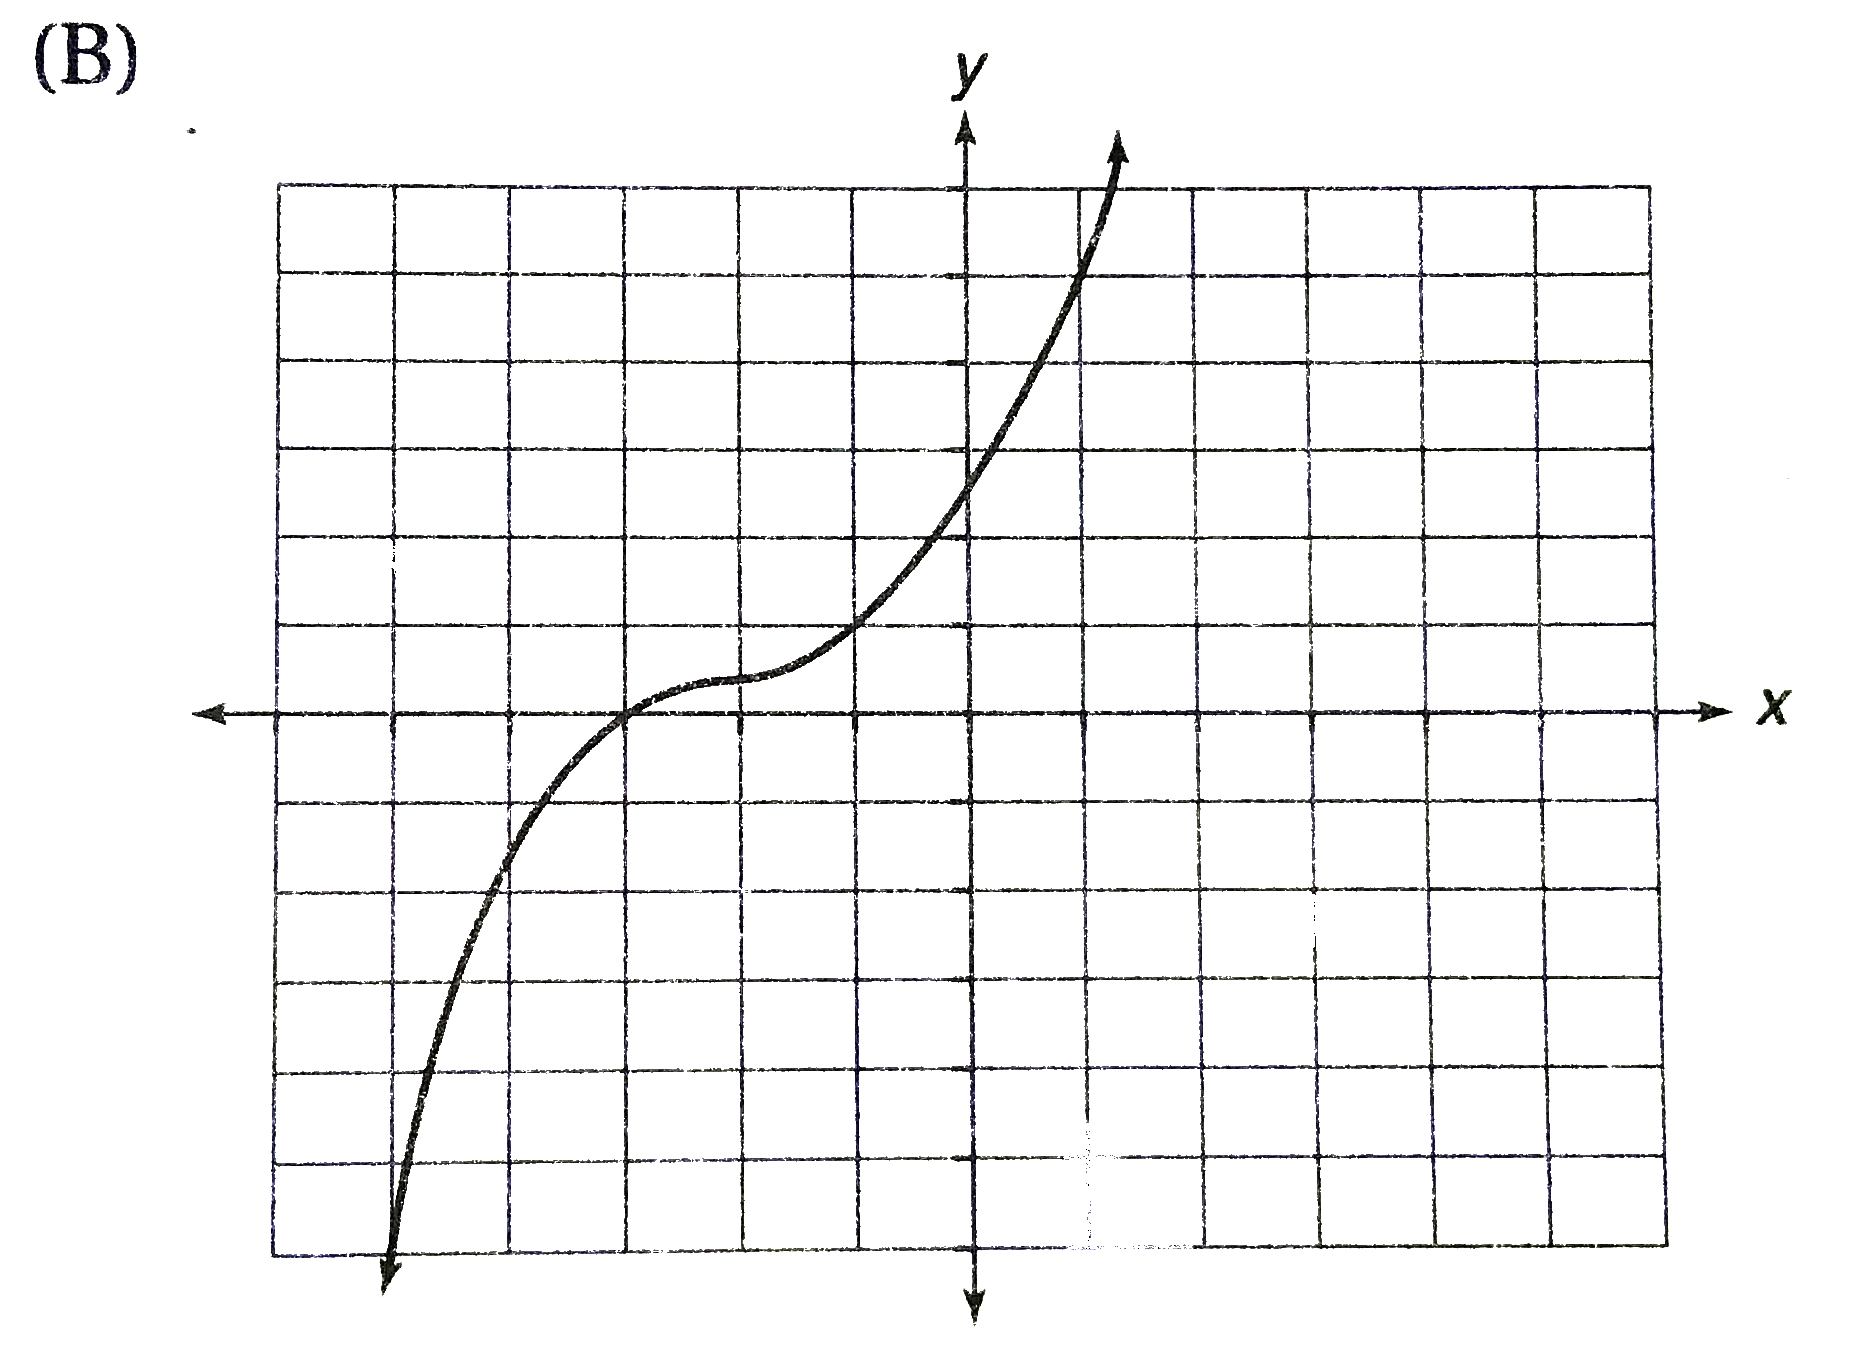 C
C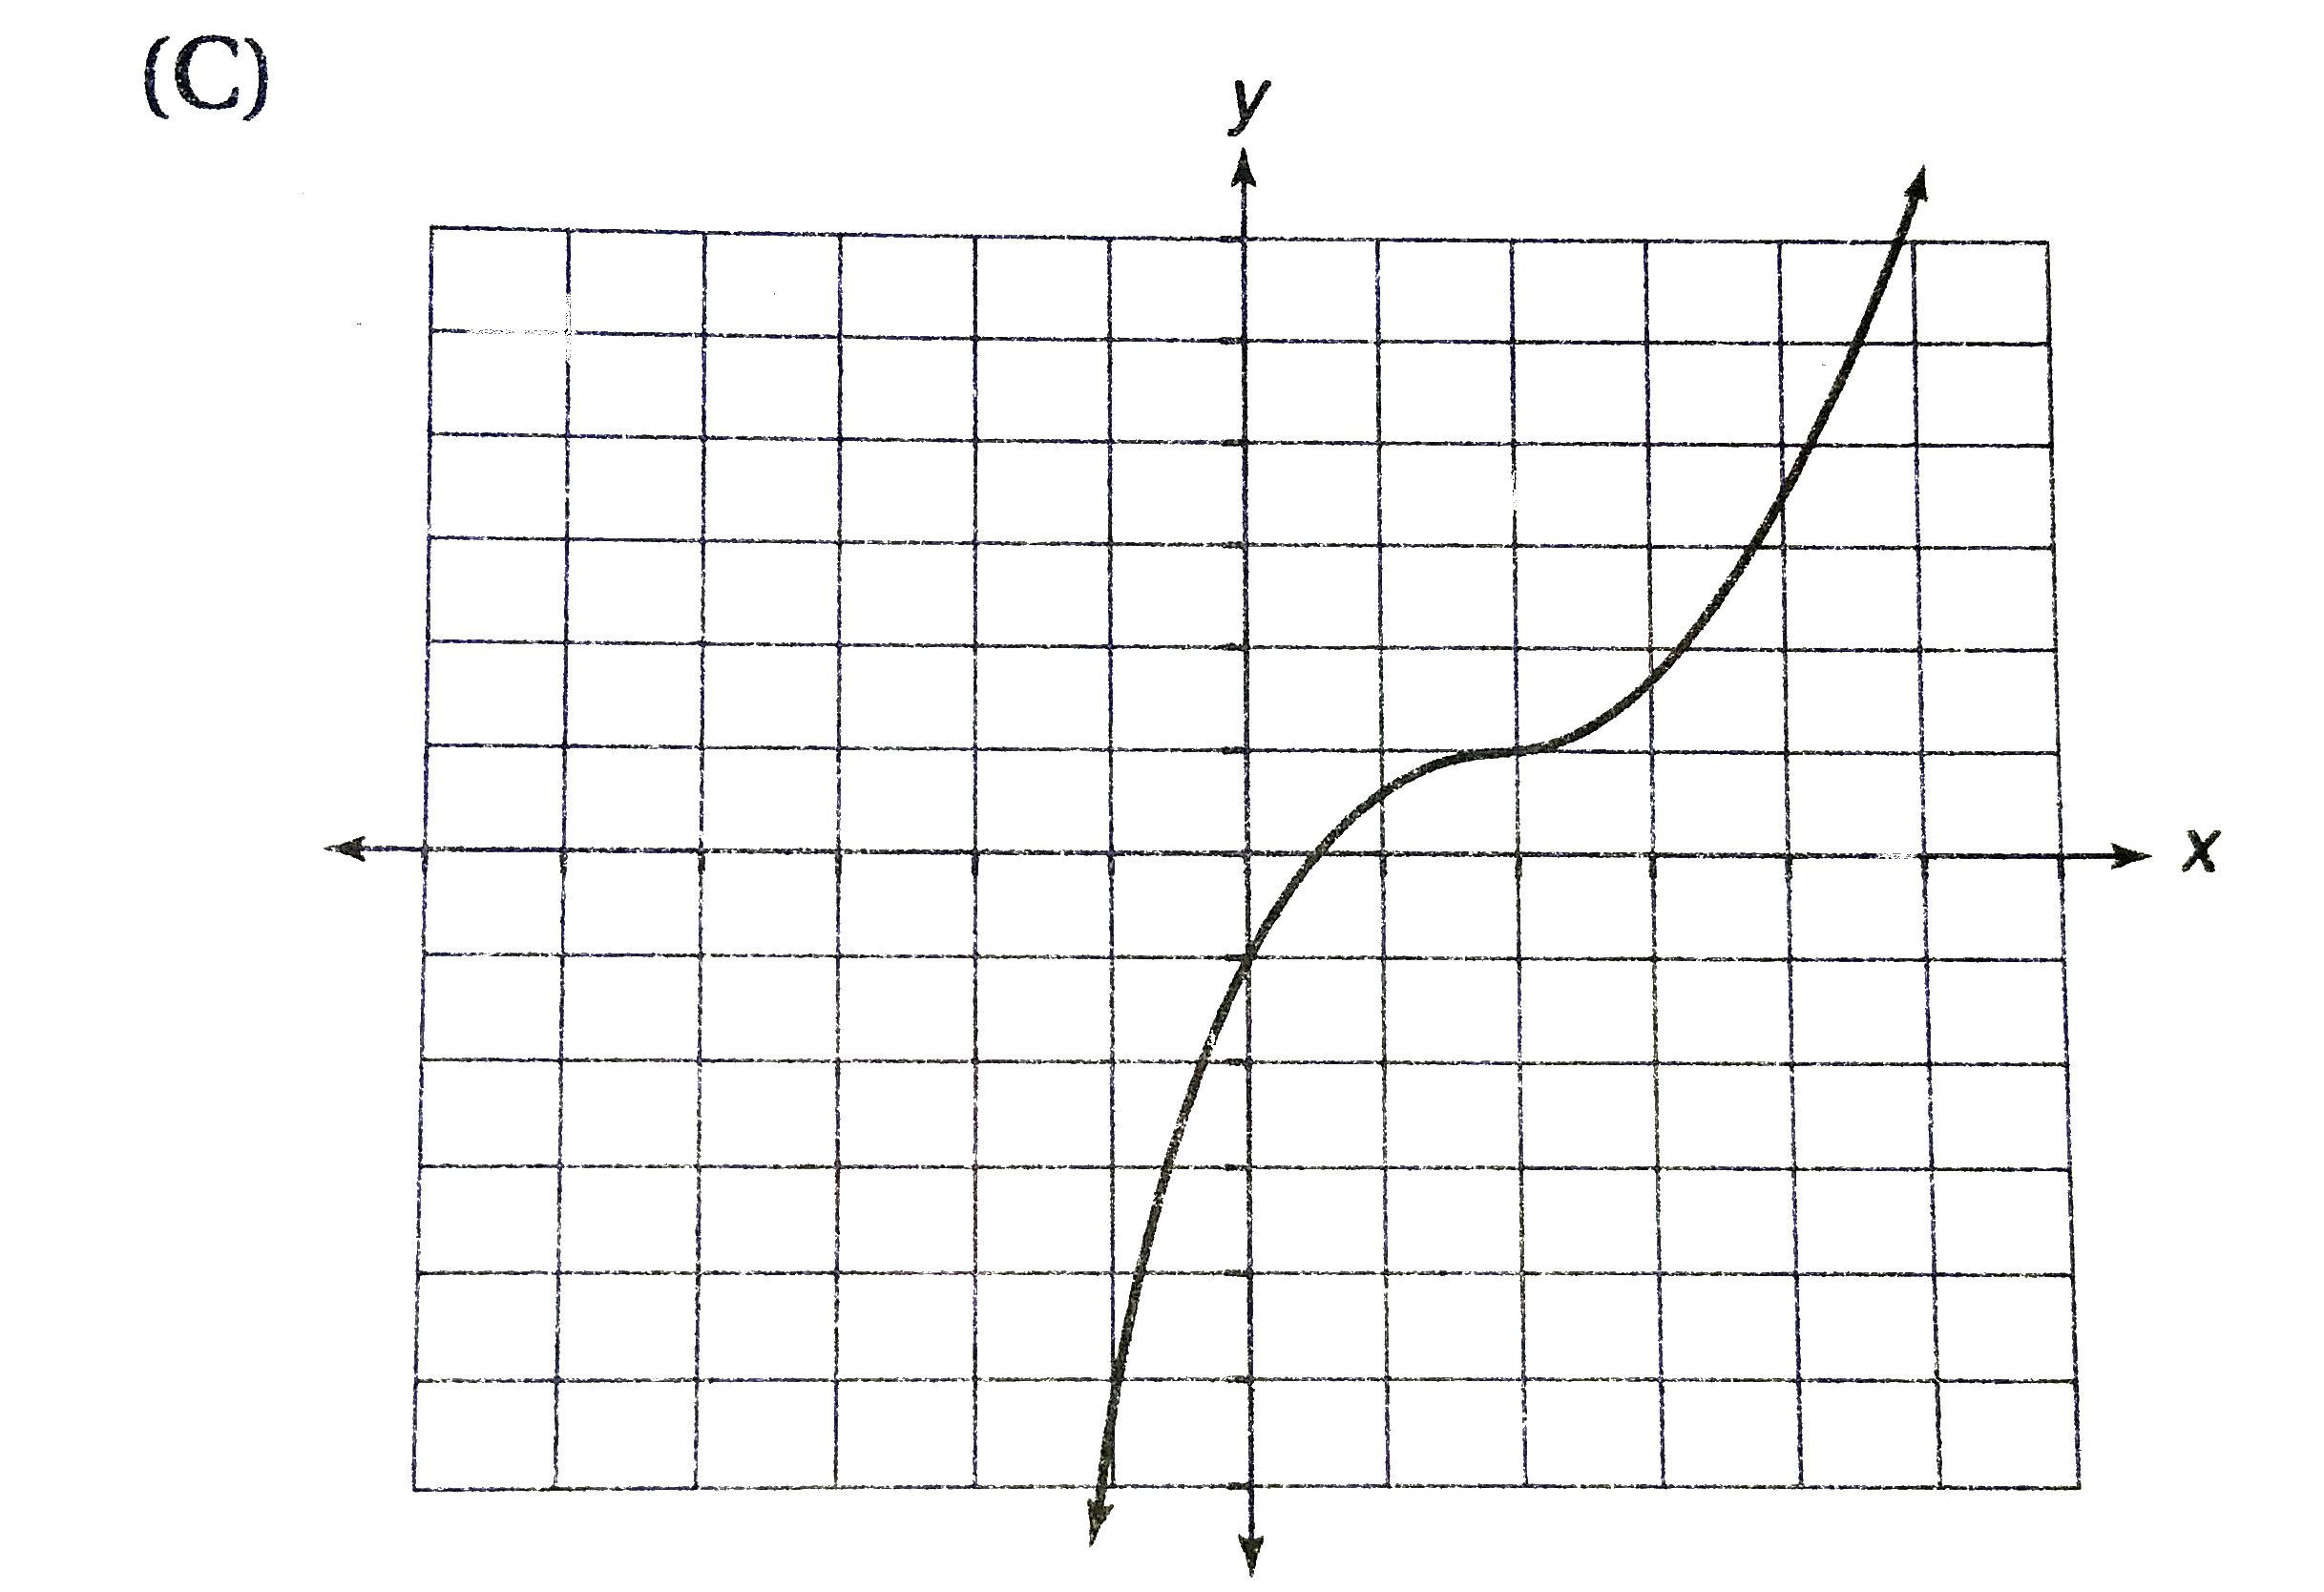 D
D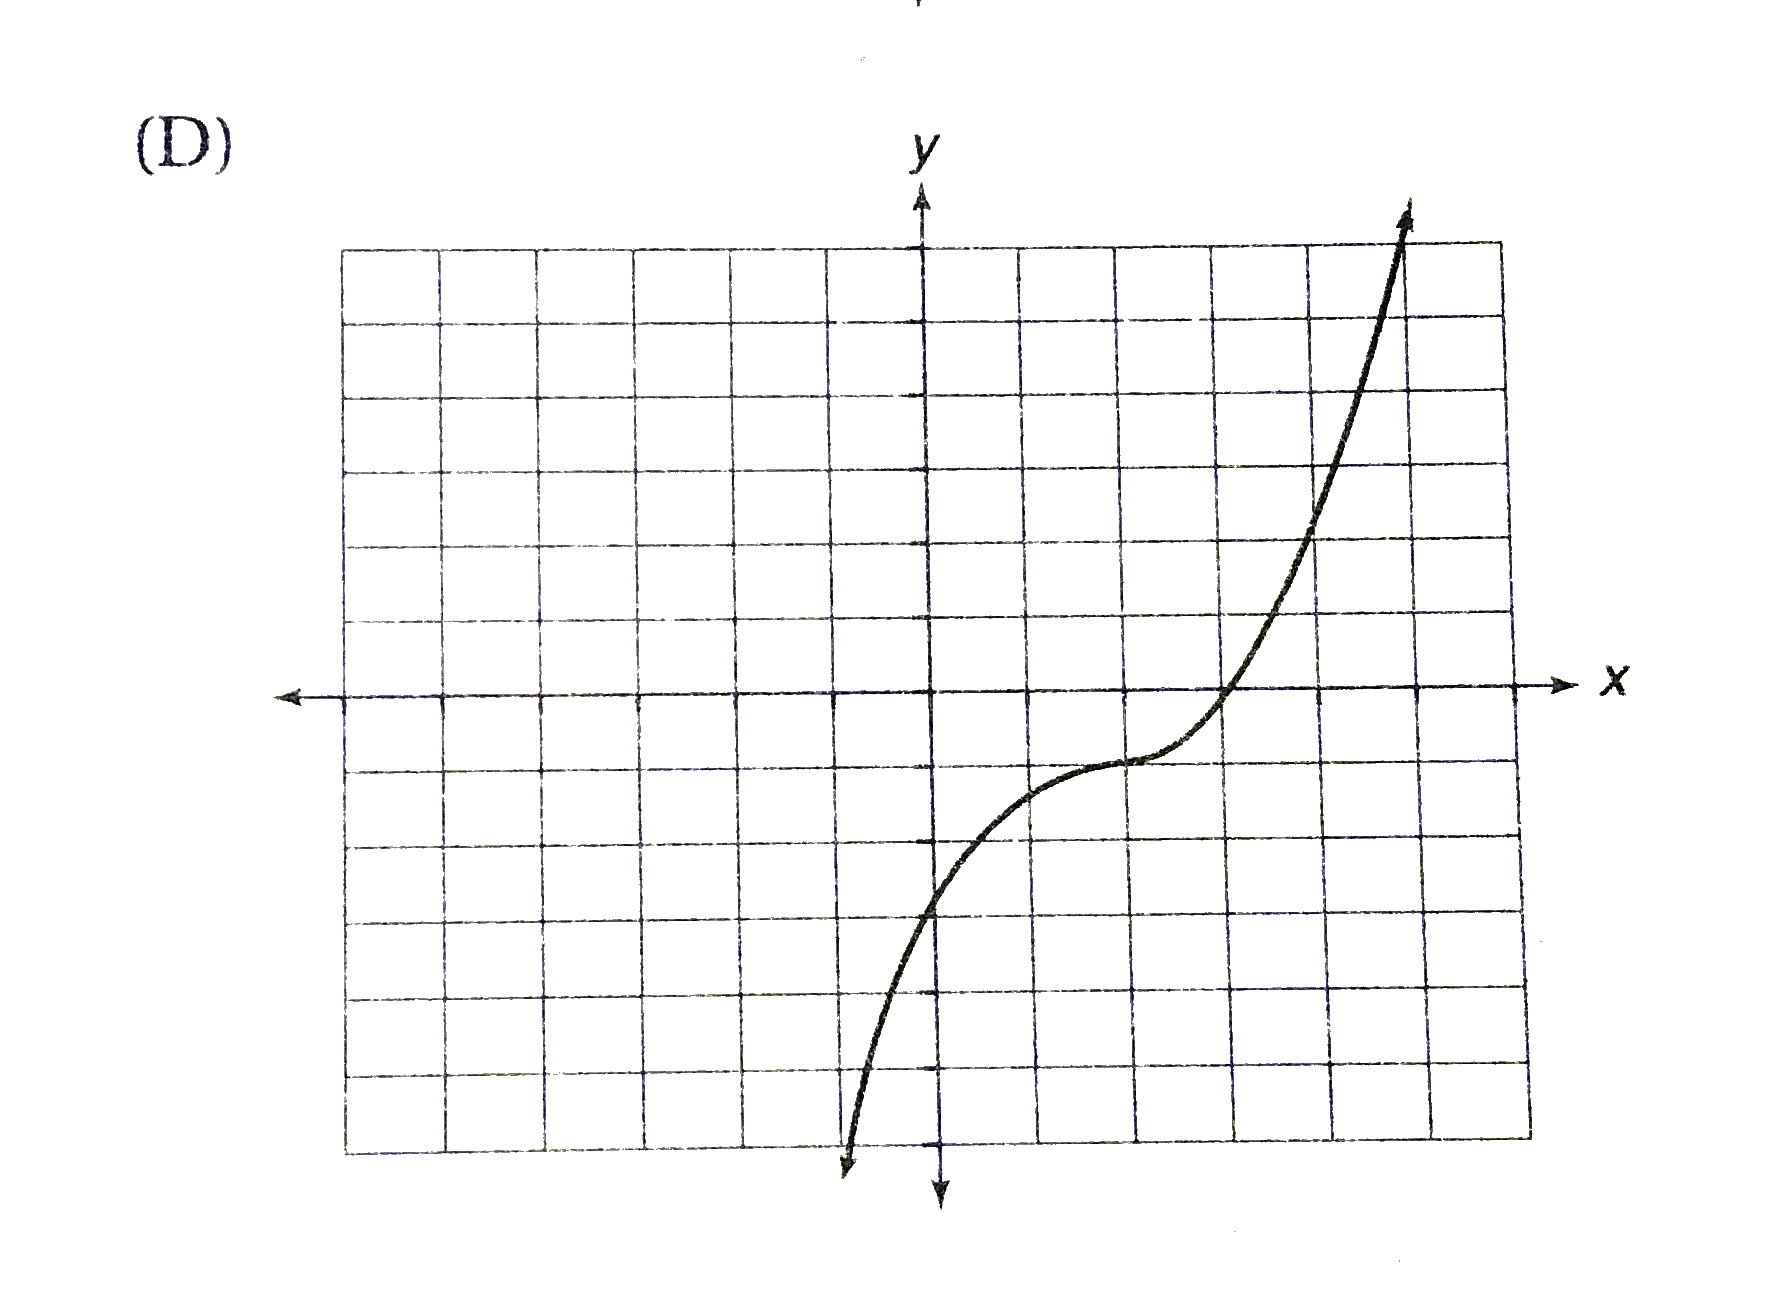
Consider the reaction A→B. The concentration of both the reactants and the products varies exponentially with time. Which of the following figure correctly describes the change in concentration of reactants and products with time ?
View SolutionThe initial concentration of X and Y were 2 and 4 mole / L respectively . For the following equilibrium X+2Y⇔Z which of the following relationship among equilibrium concentrations of x , y and z is not feasible ?
View SolutionFor the reaction R⇔P Variation of concentration is plotted against time
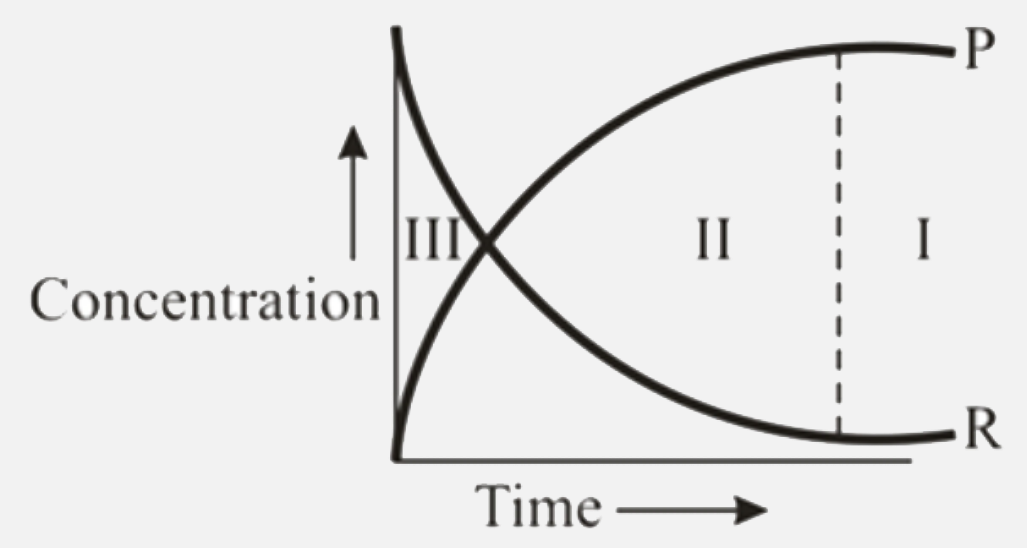
Which of the following regions show (s) equilibrium ?
View SolutionGiven the equation of the line 3x−y+z+1=0and5x−y+3z=0. Then,which of the following is correct?
View SolutionFor a reversible reaction: X+2Y→2Z, the equilibrium concentrations of X,Y and Z are 0.32,0.40 and 0.35 moles L−1 respectively at 25∘C.
a. If unitially the system contained only X and Y and then reached the state of equilibrium, what were the initial concentrations of X and Y.
b. If at the start only X and Z were present, what were the initial concentrations?
View SolutionThe equilibrium concentration of x, y and z are 4,2 and 2 mol L−1, respectively, at equilibrium of the reaction 2x+y⇔z. The value of Kc is ……………..
View Solution
