For the reaction R⇔P Variation of concentration is plotted against time
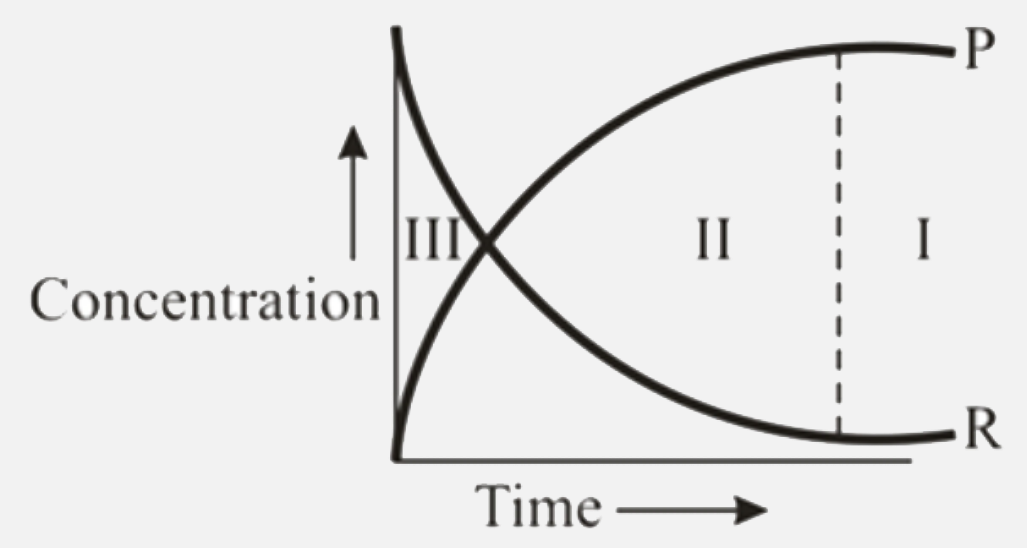
Which of the following regions show (s) equilibrium ?
III
II
I
II and III both
The correct Answer is:C
Step by step video & image solution for For the reaction RhArrP Variation of concentration is plotted against time Which of the following regions show (s) equilibrium ? by Chemistry experts to help you in doubts & scoring excellent marks in Class 12 exams.
Updated on:21/07/2023Similar Questions
Knowledge Check
Reactant A is placed in a beaker, to which Reactant B will be added. Reactants A and B will not react unless B gets to a certain concentration. Once the reaction starts, both concentrations decreases until B has been consumed . Which of the following graphs showing concentration in moles as a function of time in seconds, represent the reaction?
A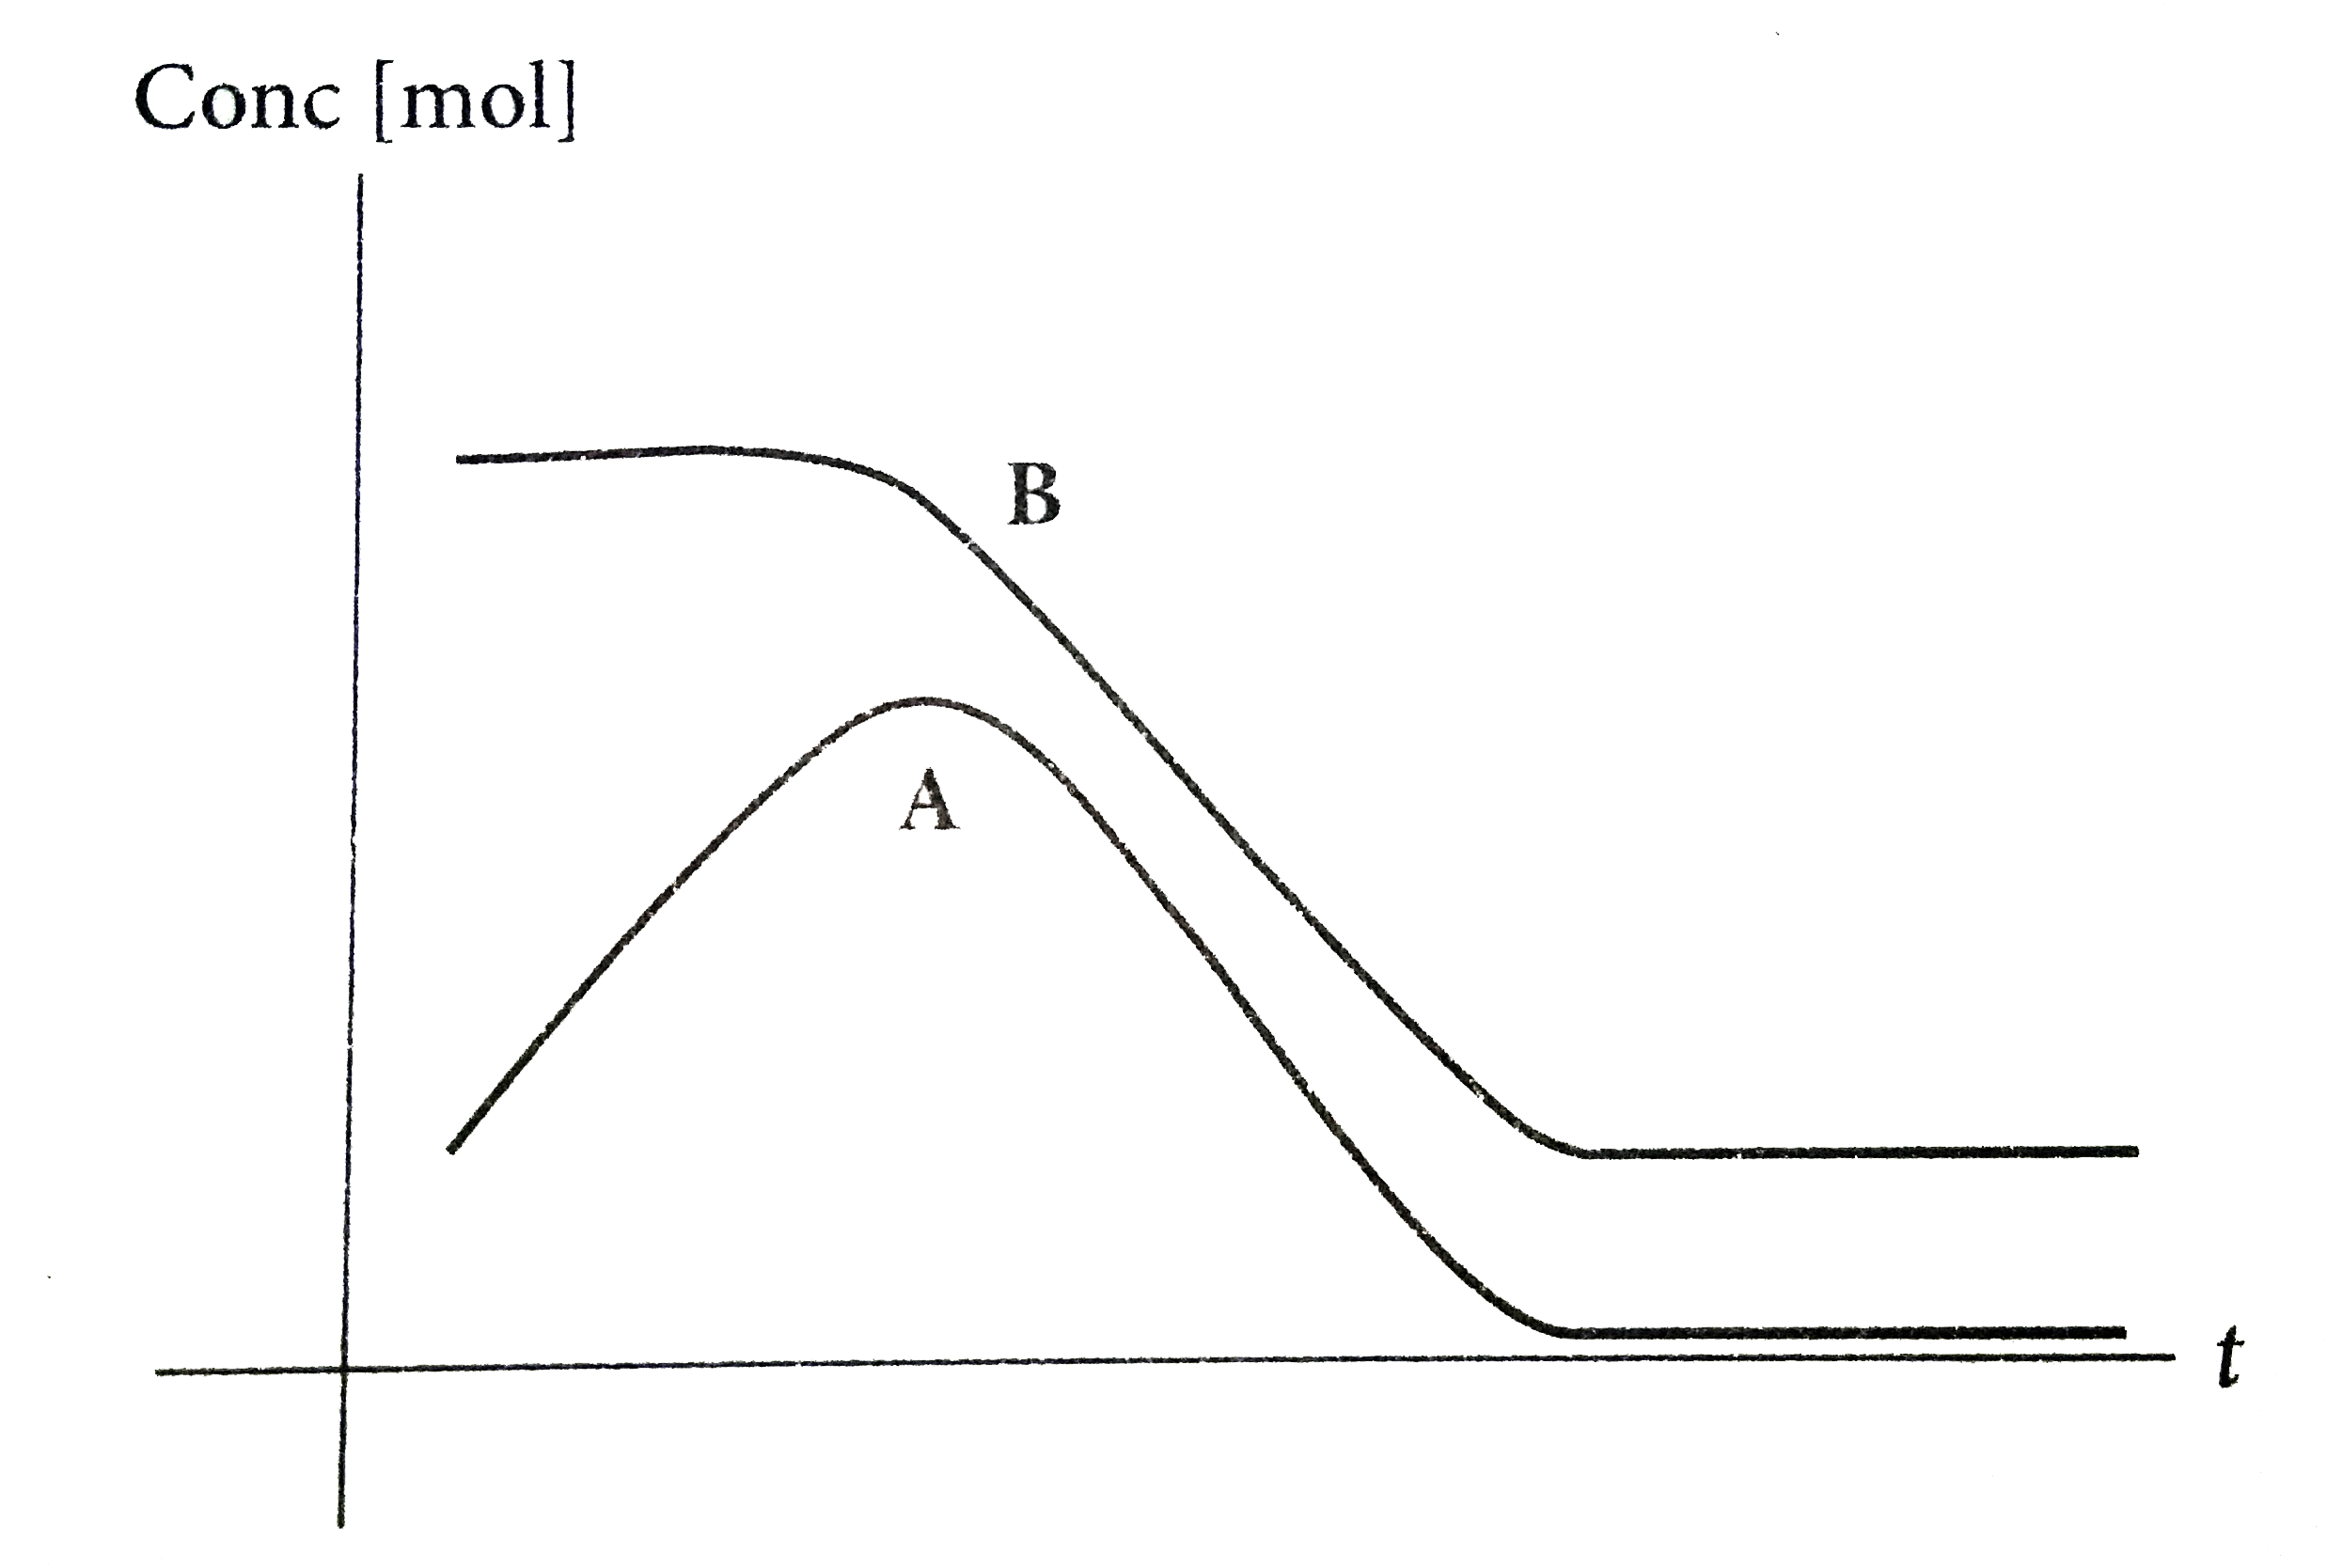 B
B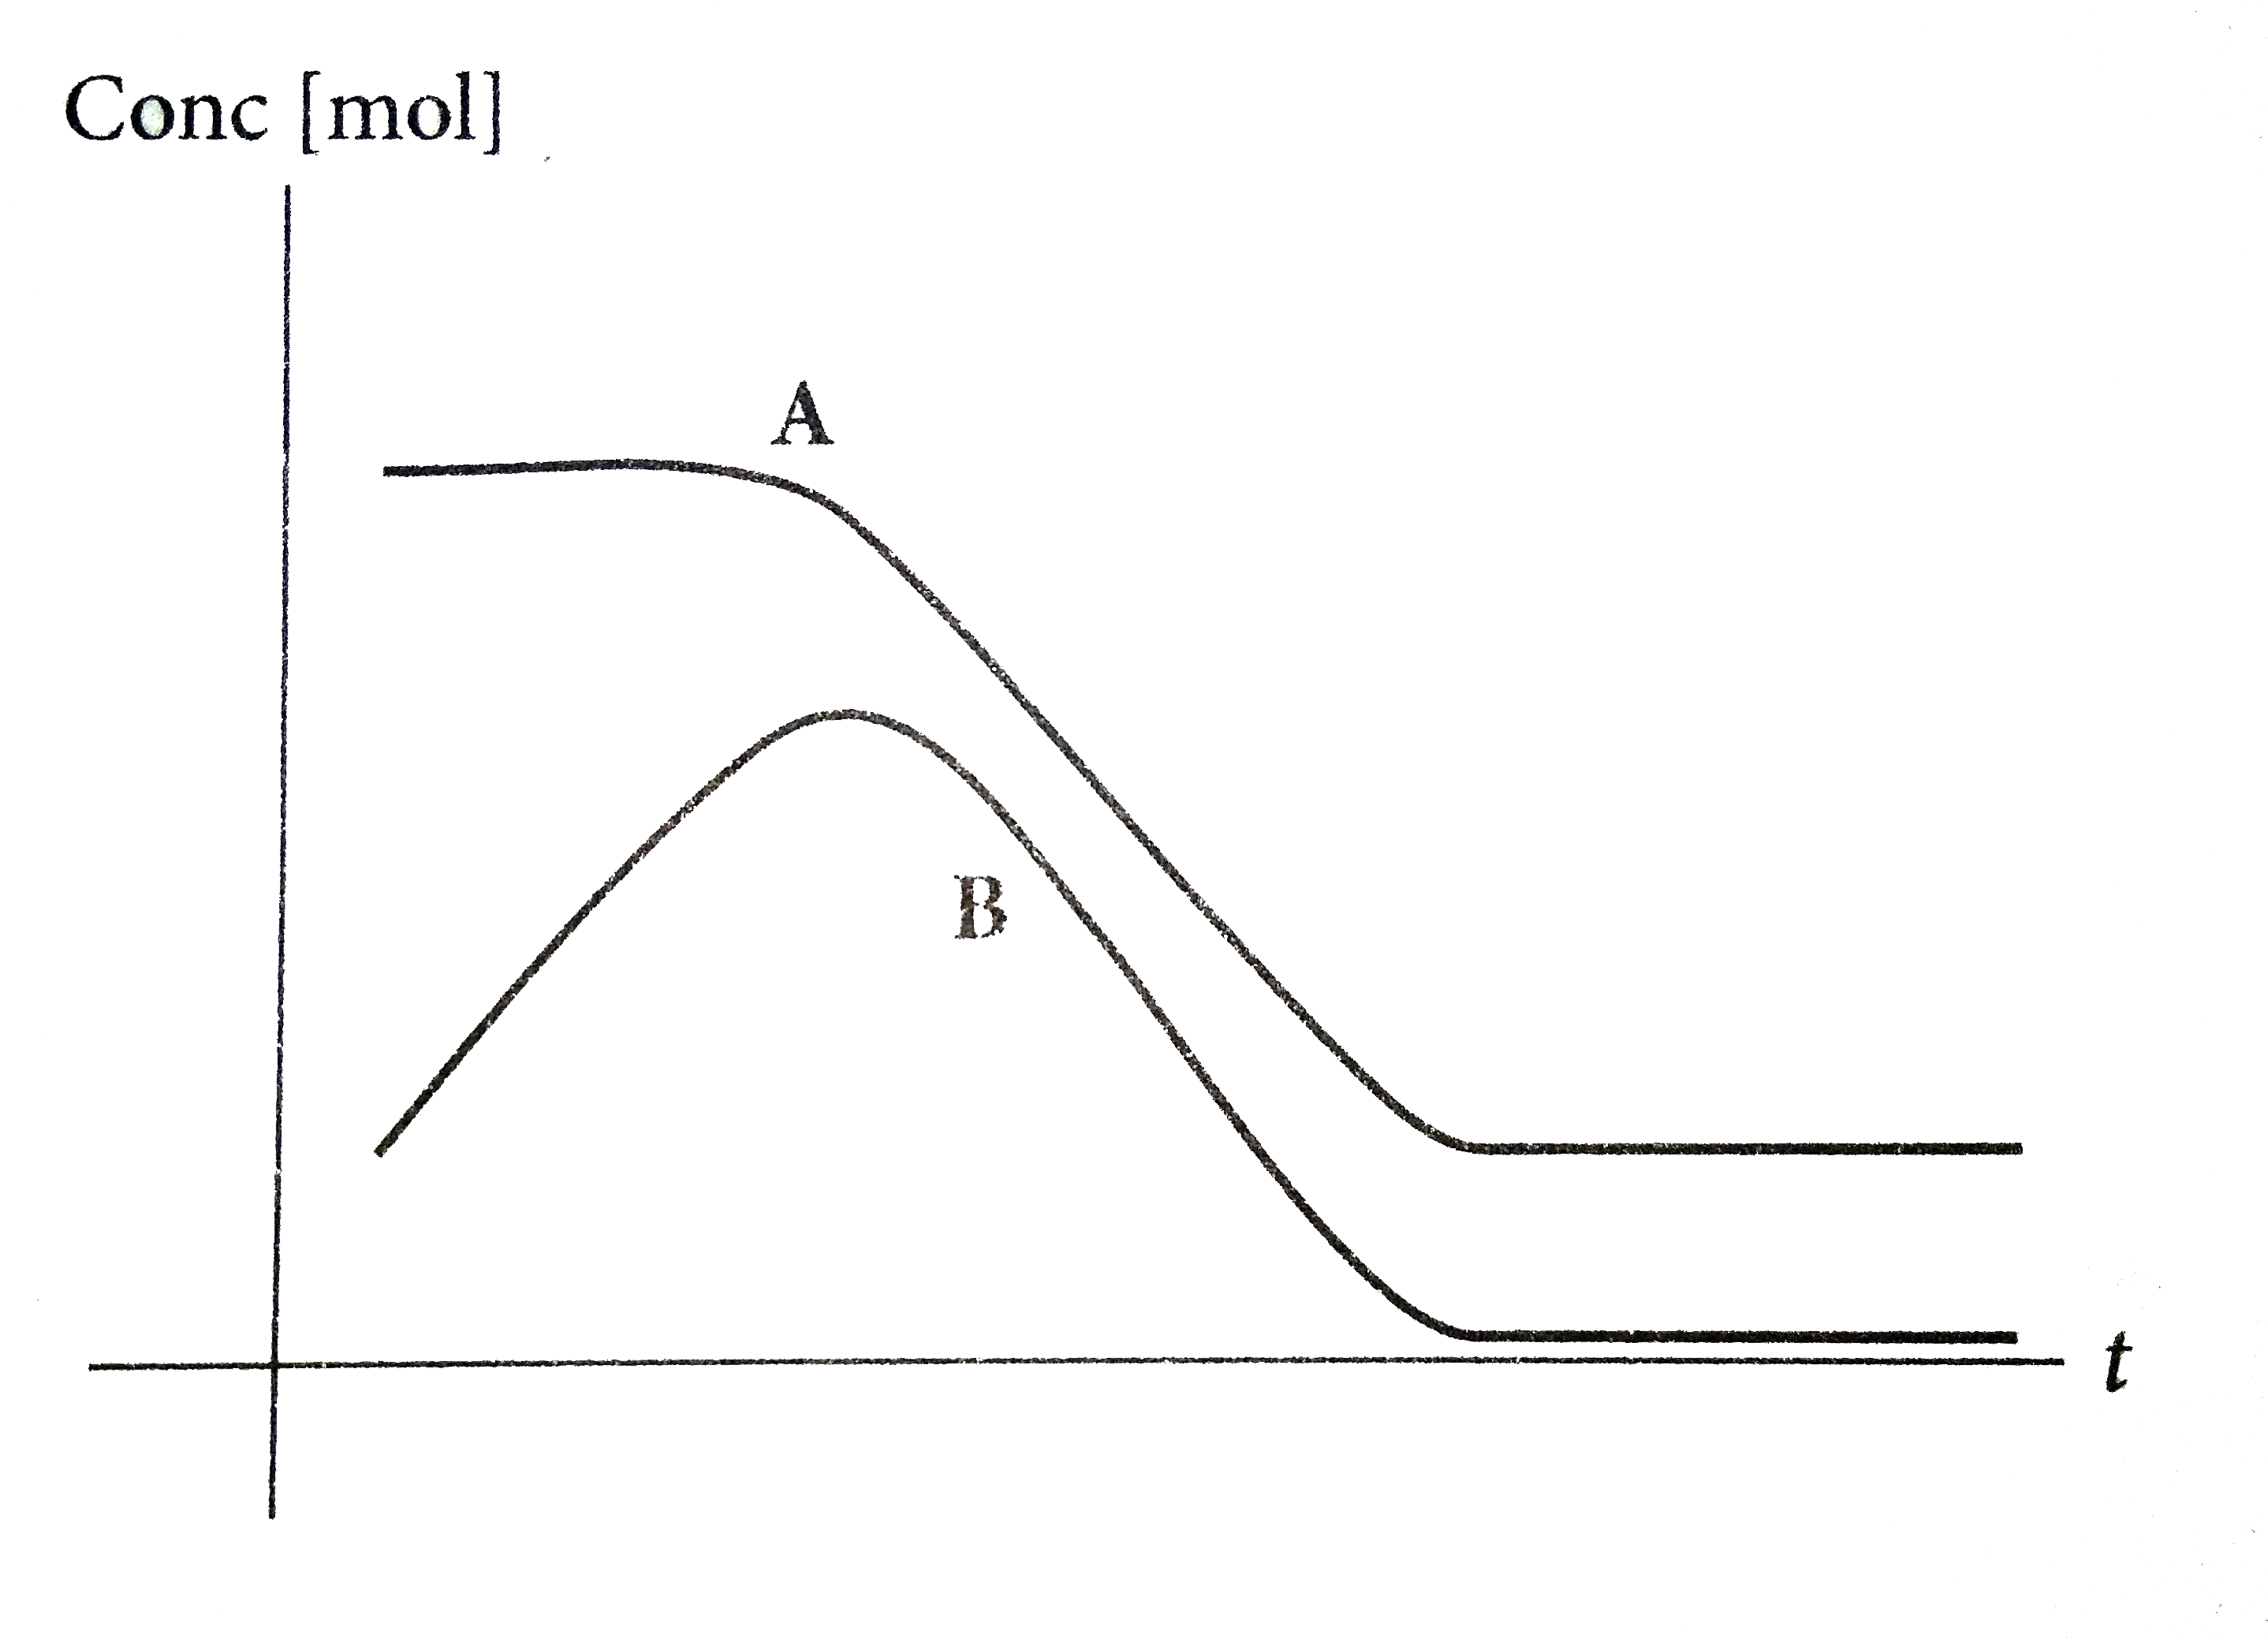 C
C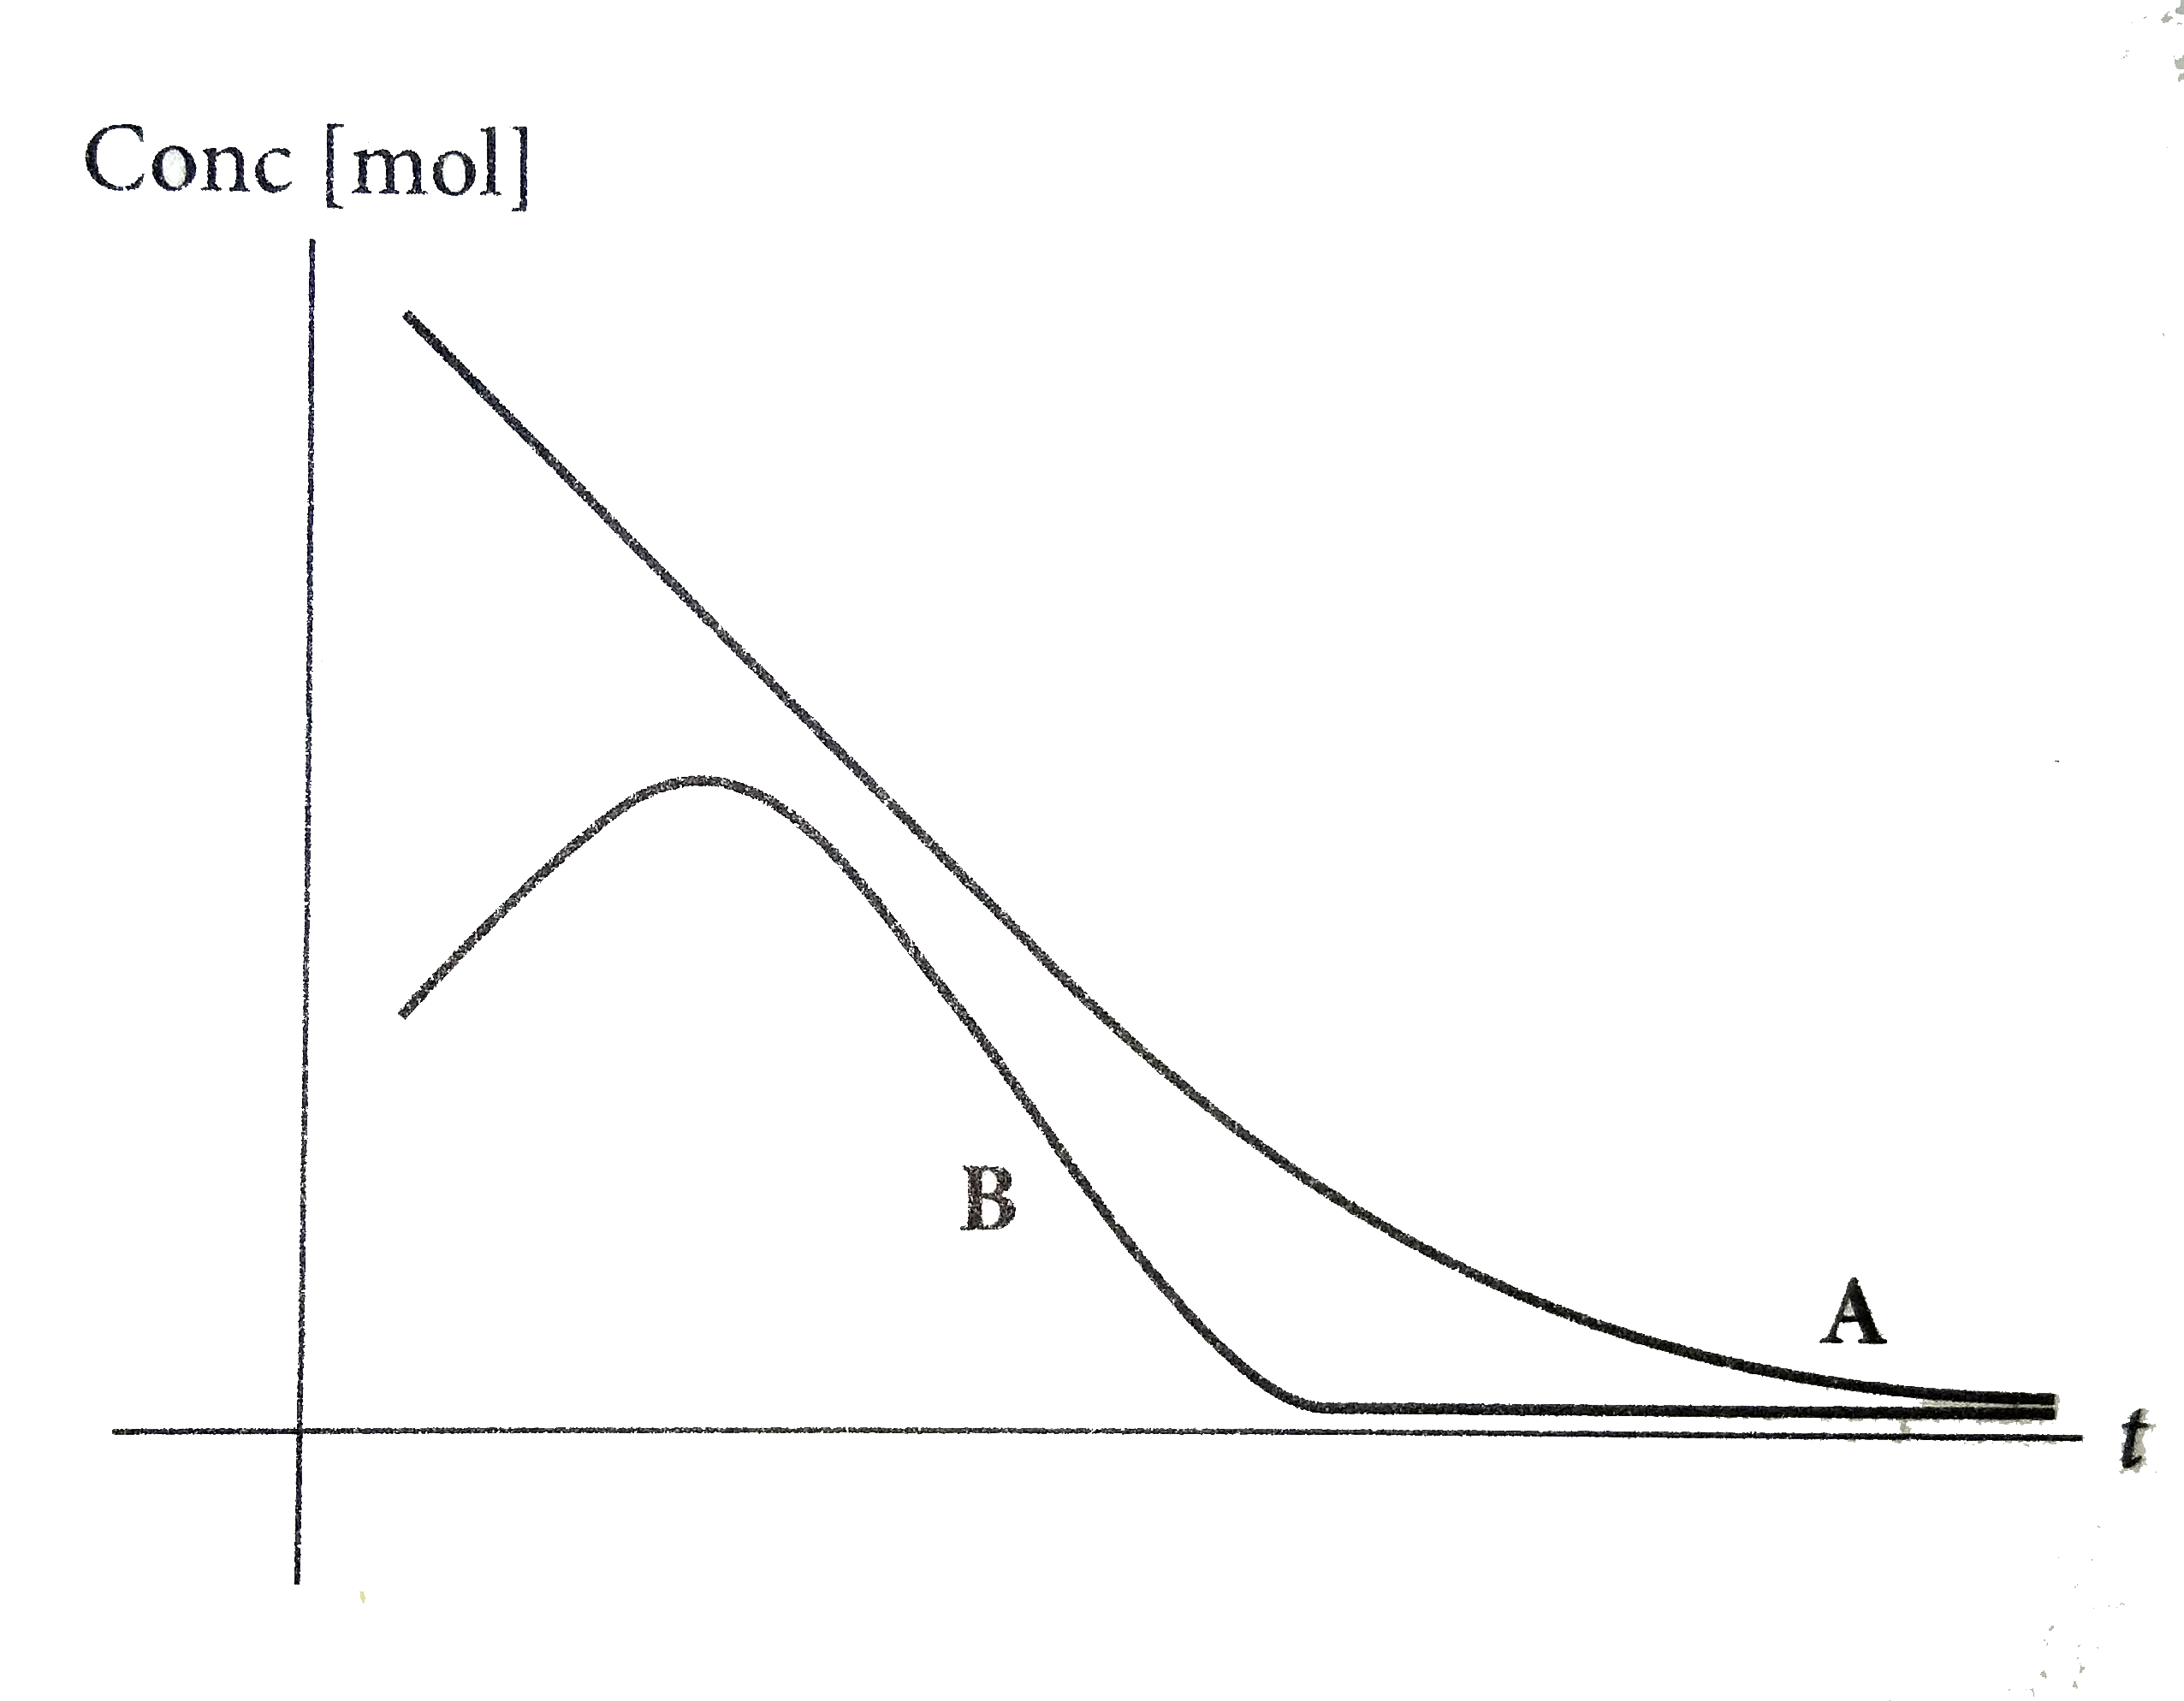 D
D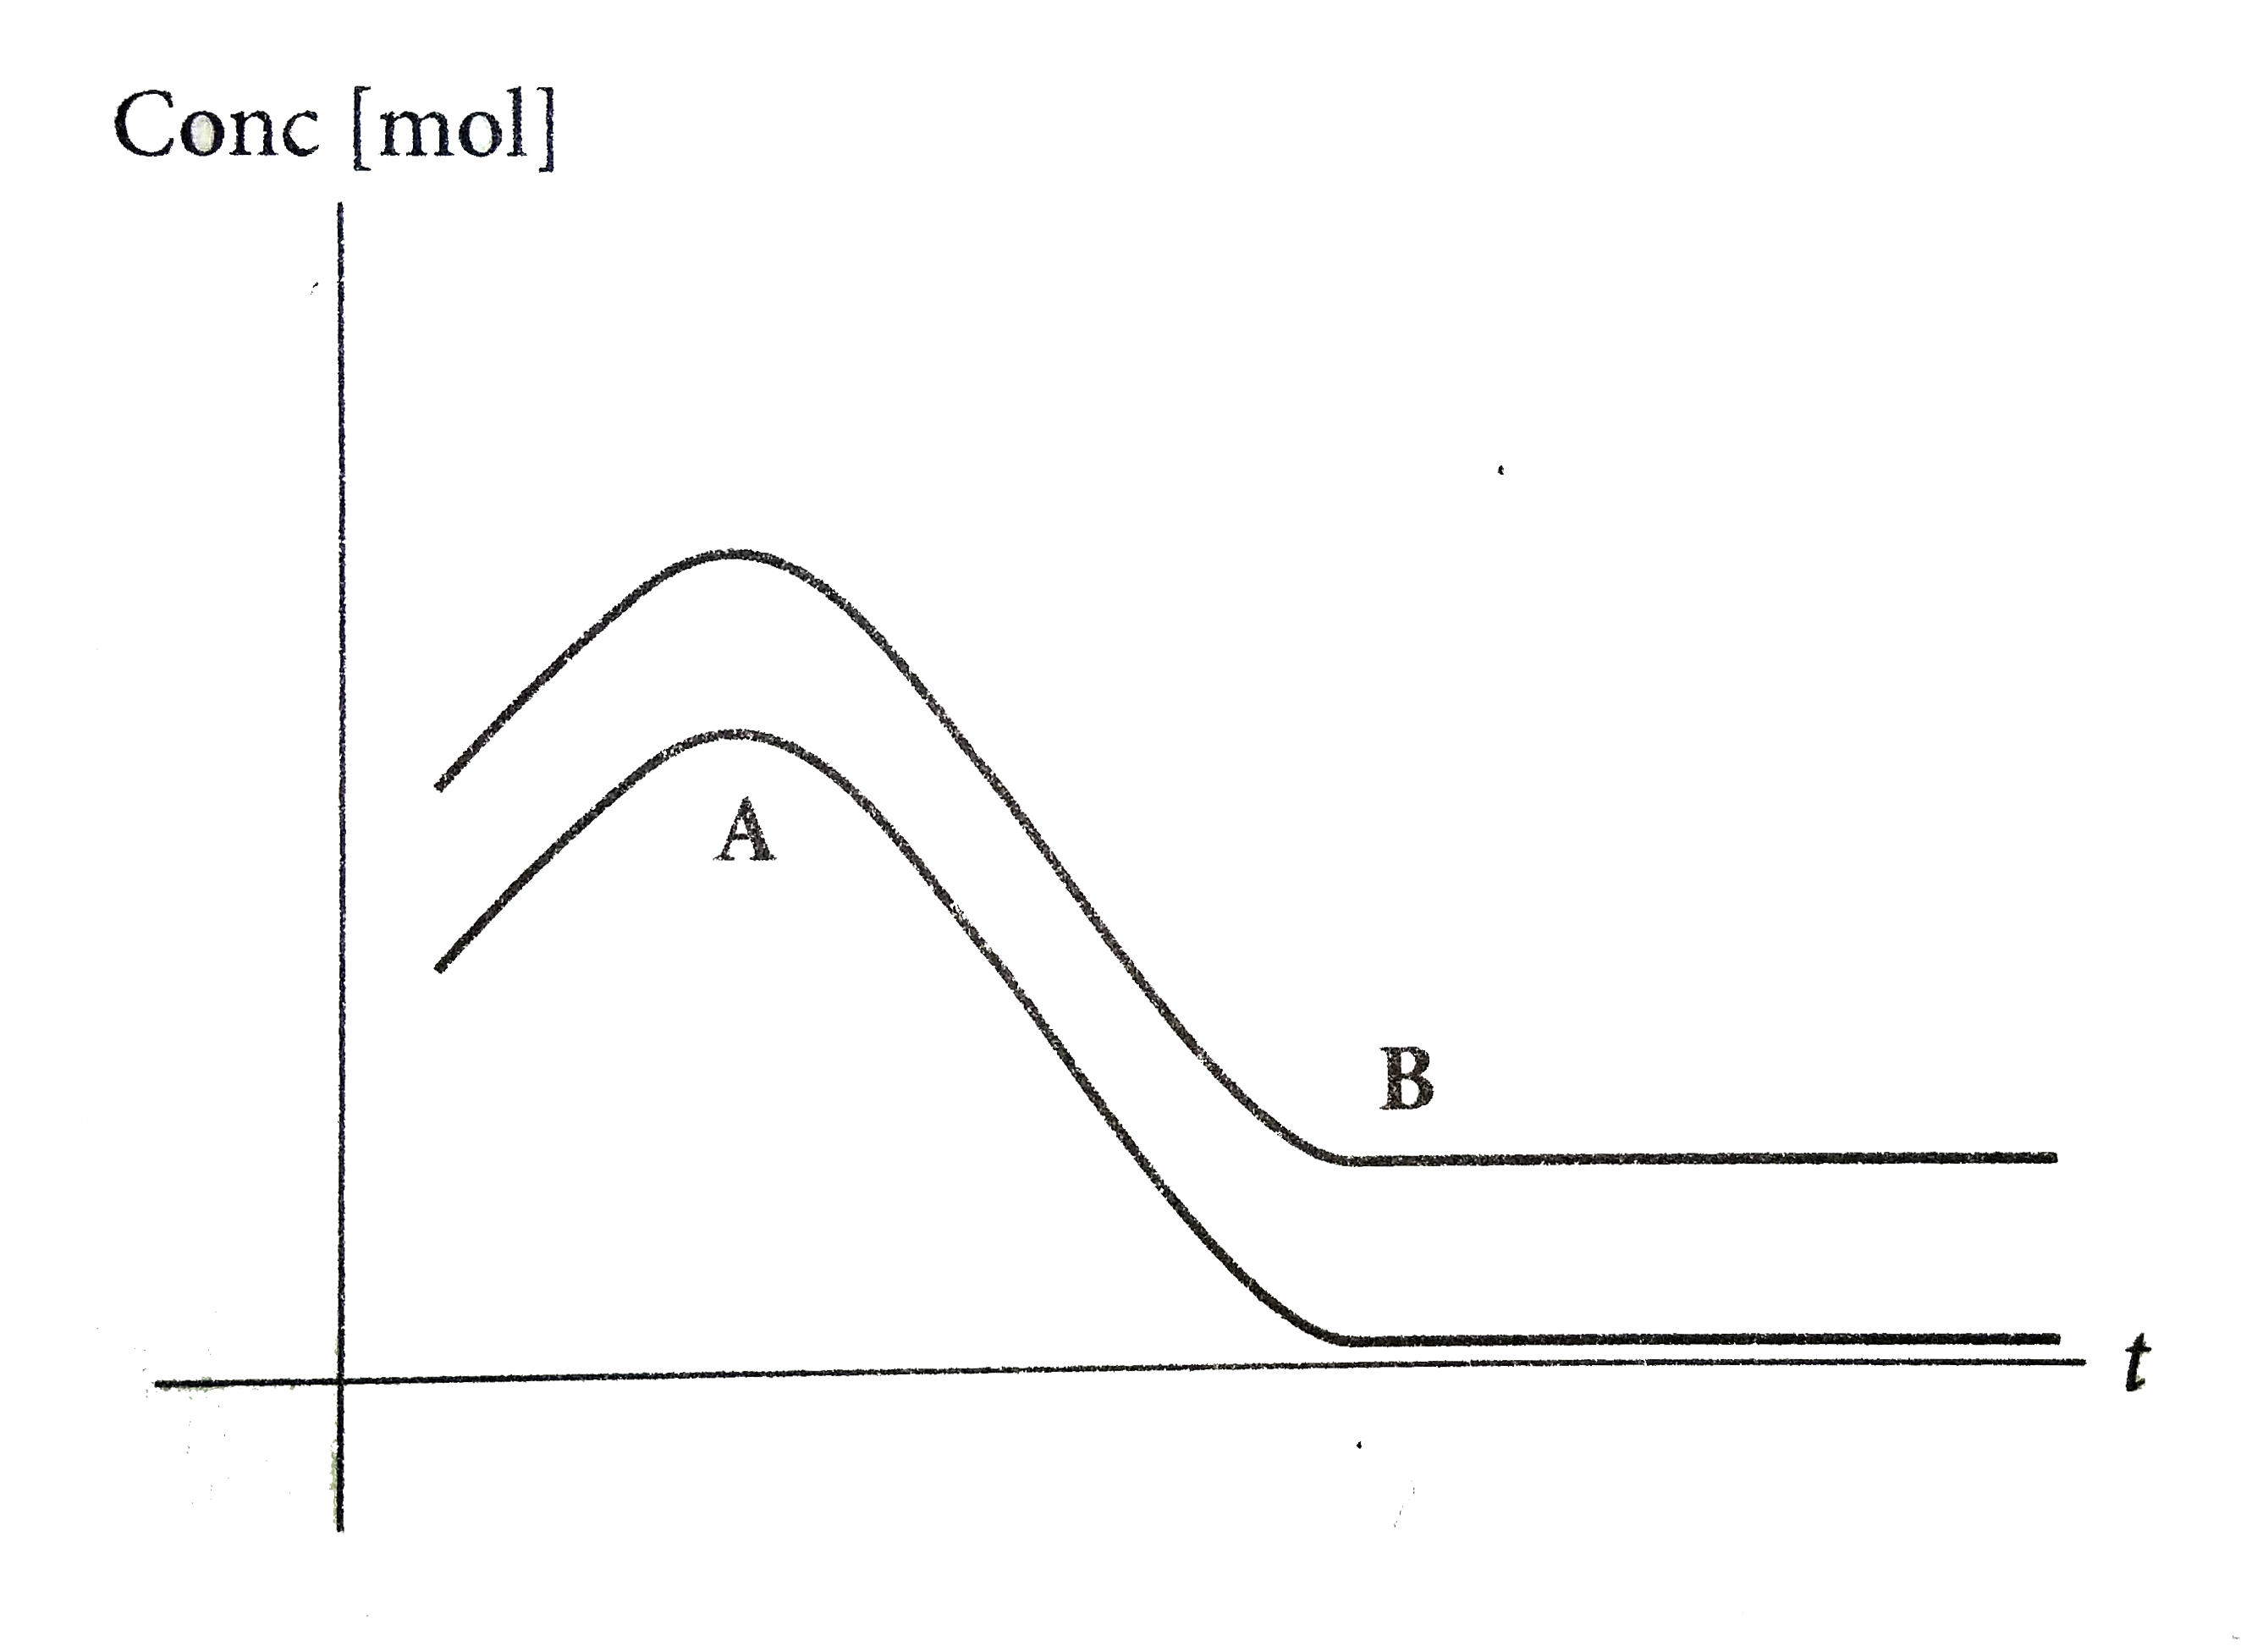
In the reaction A→ B , if the concentration of A is plotted against time, the curves obtained will be as shown in Fig. 1 and 2. Predict the order of the reactions.
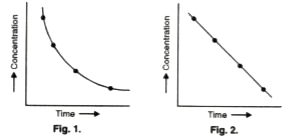
View SolutionIn the reaction A→ B , if the concentration of A is plotted against time, the curves obtained will be as shown in Fig. 1 and 2. Predict the order of the reactions.

View SolutionIn the reaction A→ B , if the concentration of A is plotted against time, the curves obtained will be as shown in Fig. 1 and 2. Predict the order of the reactions.

View SolutionFor a chemical reactin R → P, variation of concentration of R vs time plot is given below : For this reaction :
(i) Predict the order of reaction.
(ii) What is the unit of rate constant (k) ?
View SolutionThe shape of the curve obtained when substrate concentration is plotted against velocity of reaction
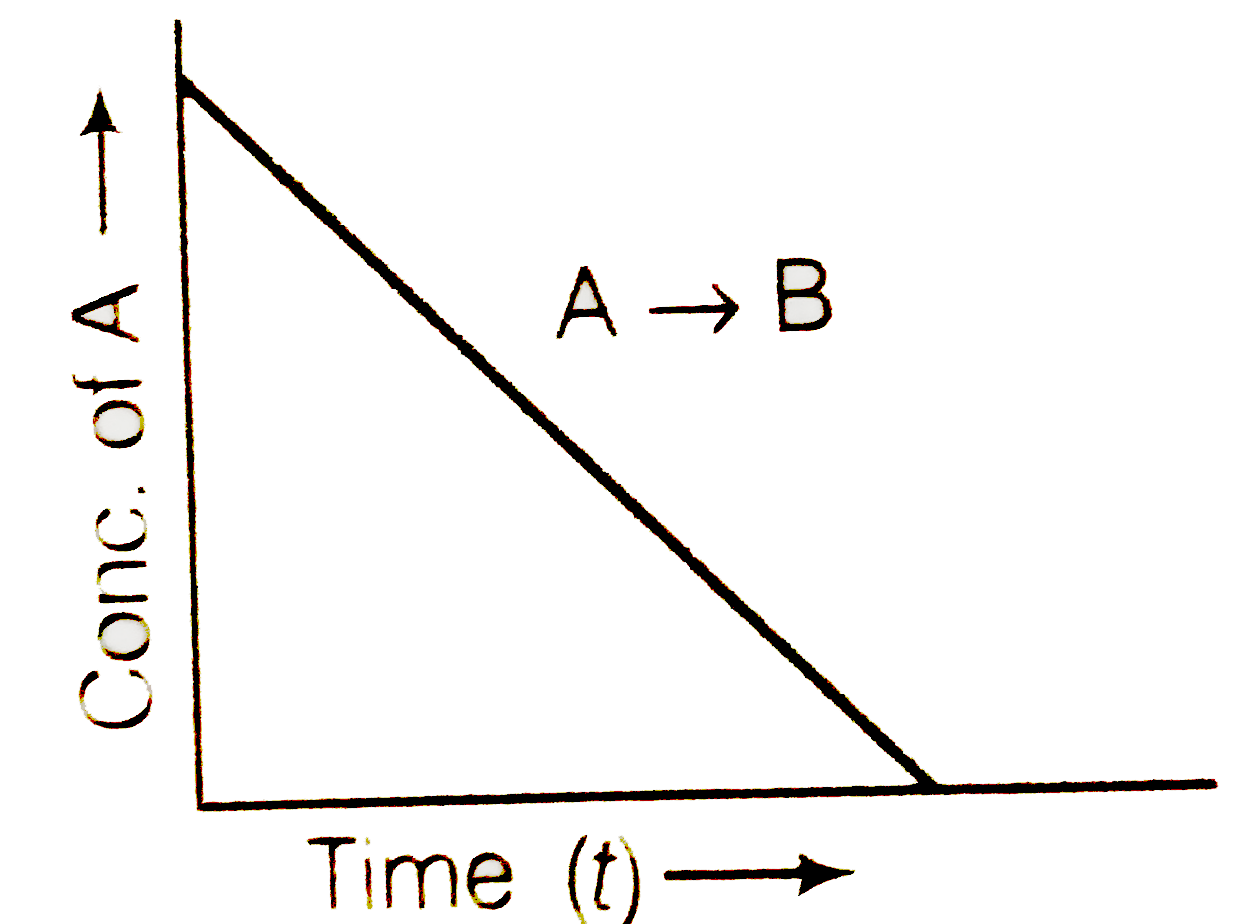
View SolutionFor a general reaction A→B, plot of concentration of A vs time is given in figure. Answer the following questions on the basis of this graph.
(i) what is the order of the reaction?
(ii) What is the slope of the curve ?
(iii) What are the units of rate constant?
View SolutionIn the reaction
PCl5(g)⇔PCl3(g)+Cl2(g)
a graph in plotted to show the variation of rate of forward and backward
reactions against time. Which of the following is correct?
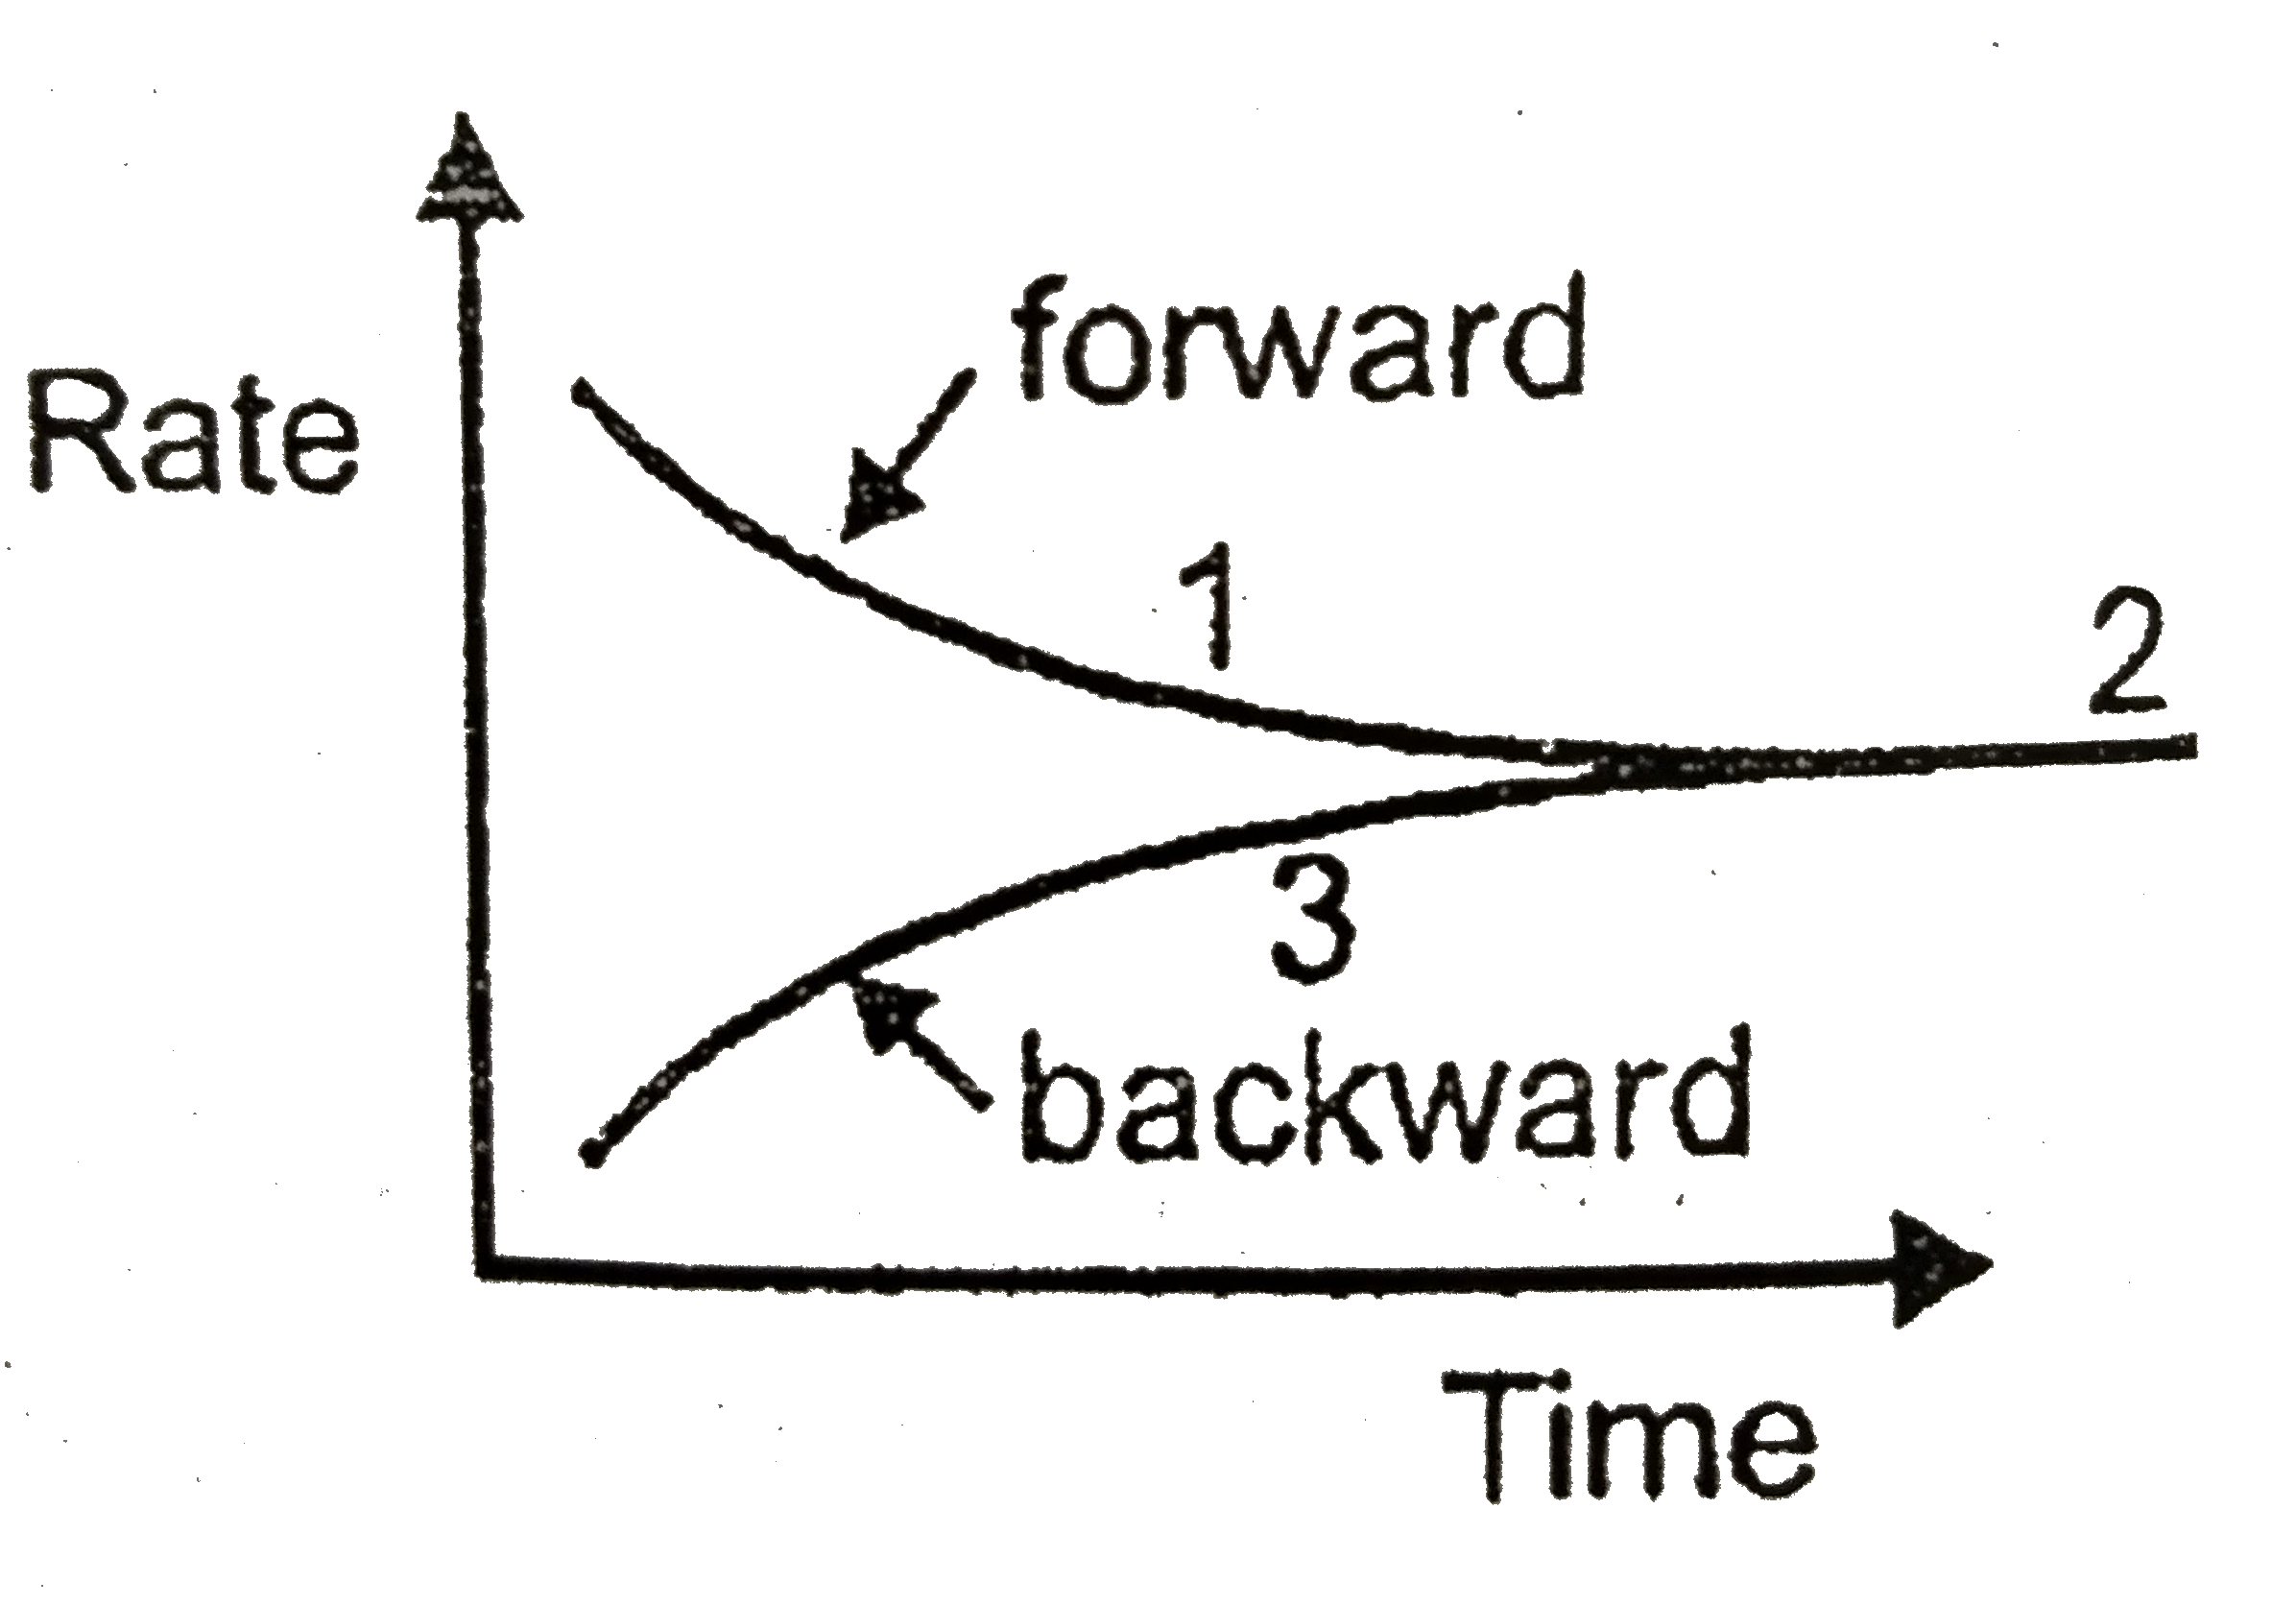
Q>K Q=K Q<K
View Solution
