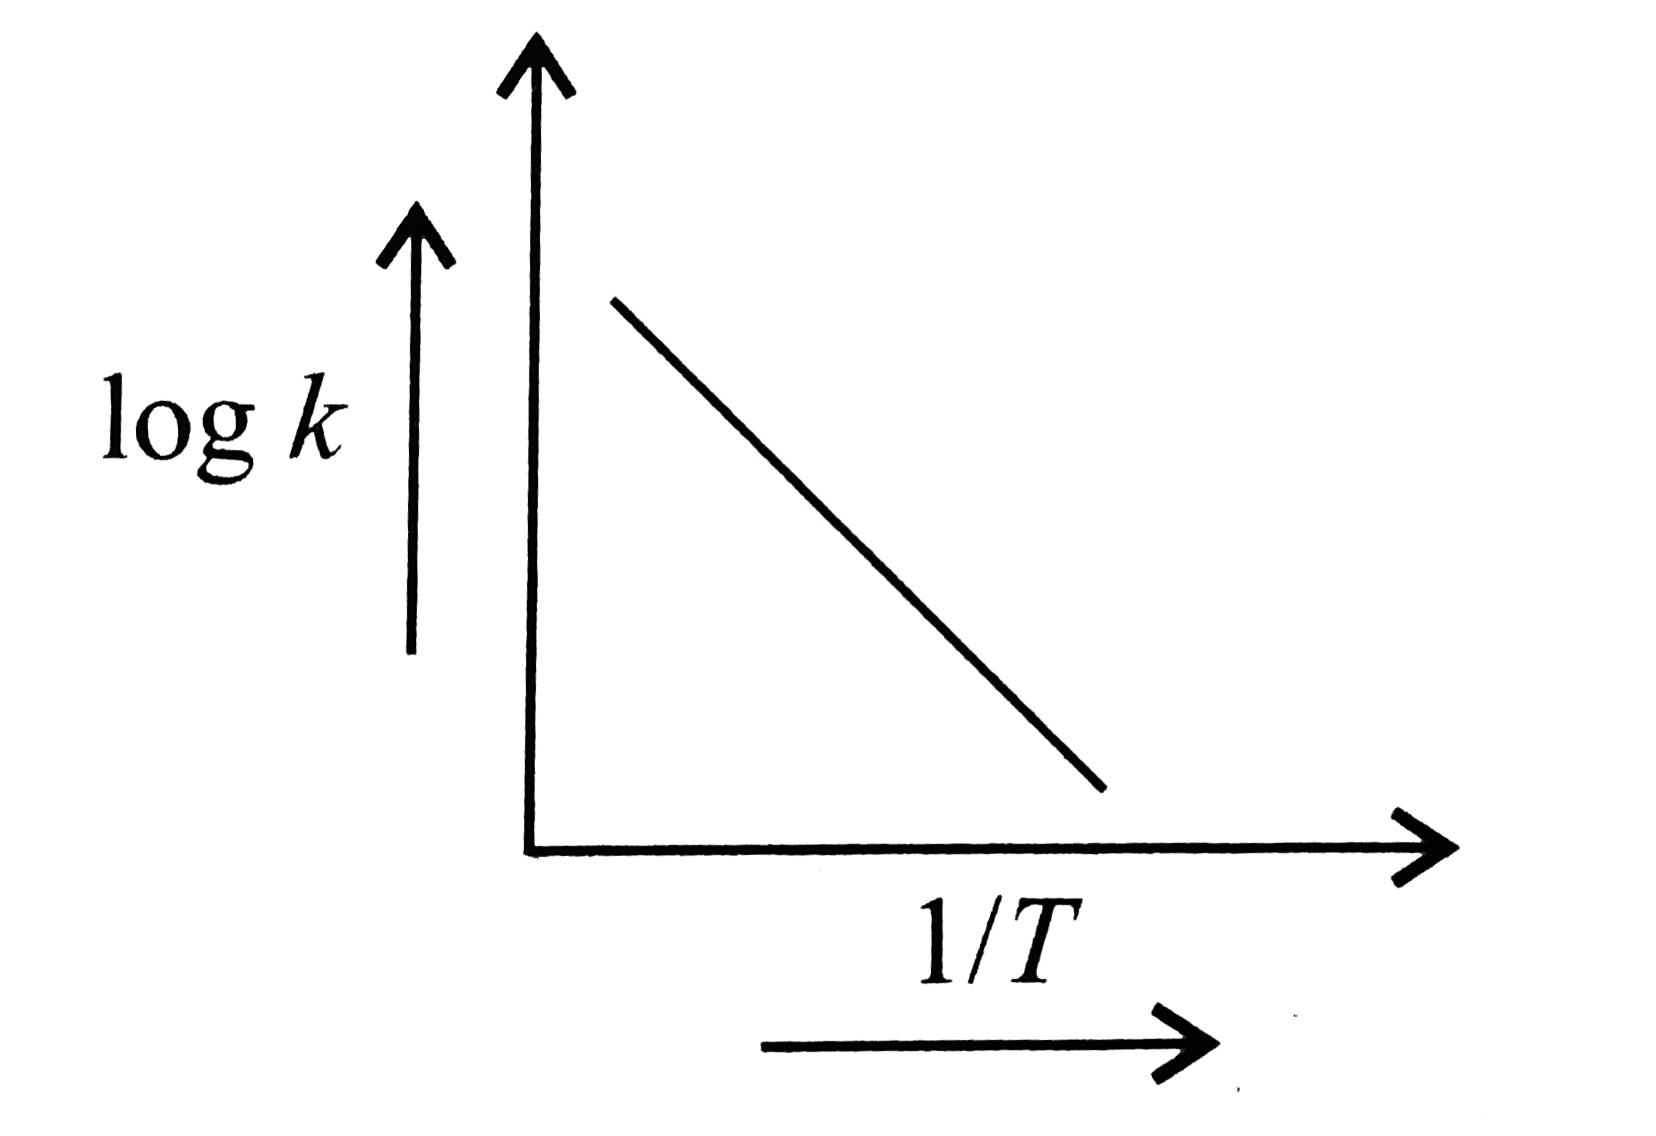
The plot og logk vs 1/T helps to calculate
A
The energy of activation
B
The rate constant of the reaction
C
The order of the reaction
D
The energy of activations as well as the frequency factor
Video Solution
Text Solution
The correct Answer is:D
According to Arrhenius equation
logk=logA−Ea2.303.1T
Plot of logk vs 1T is a straight line.
Slope =−Ea2.303R
Intercept =logA

|
Topper's Solved these Questions
- CHEMICAL KINETICSBOOK - CENGAGE CHEMISTRY ENGLISHCHAPTER - CHEMICAL KINETICSEXERCISE - Exercises Assertion-Reasoning
22 Videos
- CHEMICAL KINETICSBOOK - CENGAGE CHEMISTRY ENGLISHCHAPTER - CHEMICAL KINETICSEXERCISE - Exercises Integer
15 Videos
- CHEMICAL KINETICSBOOK - CENGAGE CHEMISTRY ENGLISHCHAPTER - CHEMICAL KINETICSEXERCISE - Exercises Multiple Correct
33 Videos
- CARBOXYLIC ACIDS AND THEIR DERIVATIVESBOOK - CENGAGE CHEMISTRY ENGLISHCHAPTER - CARBOXYLIC ACIDS AND THEIR DERIVATIVESEXERCISE - Exercises Archives (Analytical And Descriptive)
34 Videos
- COORDINATION COMPOUNDSBOOK - CENGAGE CHEMISTRY ENGLISHCHAPTER - COORDINATION COMPOUNDSEXERCISE - Archives Subjective
18 Videos
Similar Questions
Knowledge Check
In a plot of log k vs 1/T, the slope is
A−Ea/2.303BEa/2.303RCEa/2.303D−Ea/2.303RIn a plot of log k vs 1/T, the slope is
A−Ea/2.303BEa/2.303RCEa/2.303D−Ea/2.303RIn a plot of log k vs 1/T, the slope is
A−Ea/2.303BEa/2.303RCEa/2.303D−Ea/2.303R
The correct plot for In k vs 1/T?
View SolutionThe Ea of reaction in the presence of catalyst is 5.25kJ/mol in the absence of catalyst is 8.314kJmol−1. What is the slope of the plot of Ink vs 1T in the absence of catalyst.
(R=8.314Jk−1mol−1)
View SolutionDraw the plot log V vs log T.
View SolutionThe plot of log K against 1T is a straight line with positive slope ( K being the equilibrium constant of a reaction ), which of the following is then correct ?
View SolutionIn a plot of log.k vs 1/T, the slope'is :
View Solution
