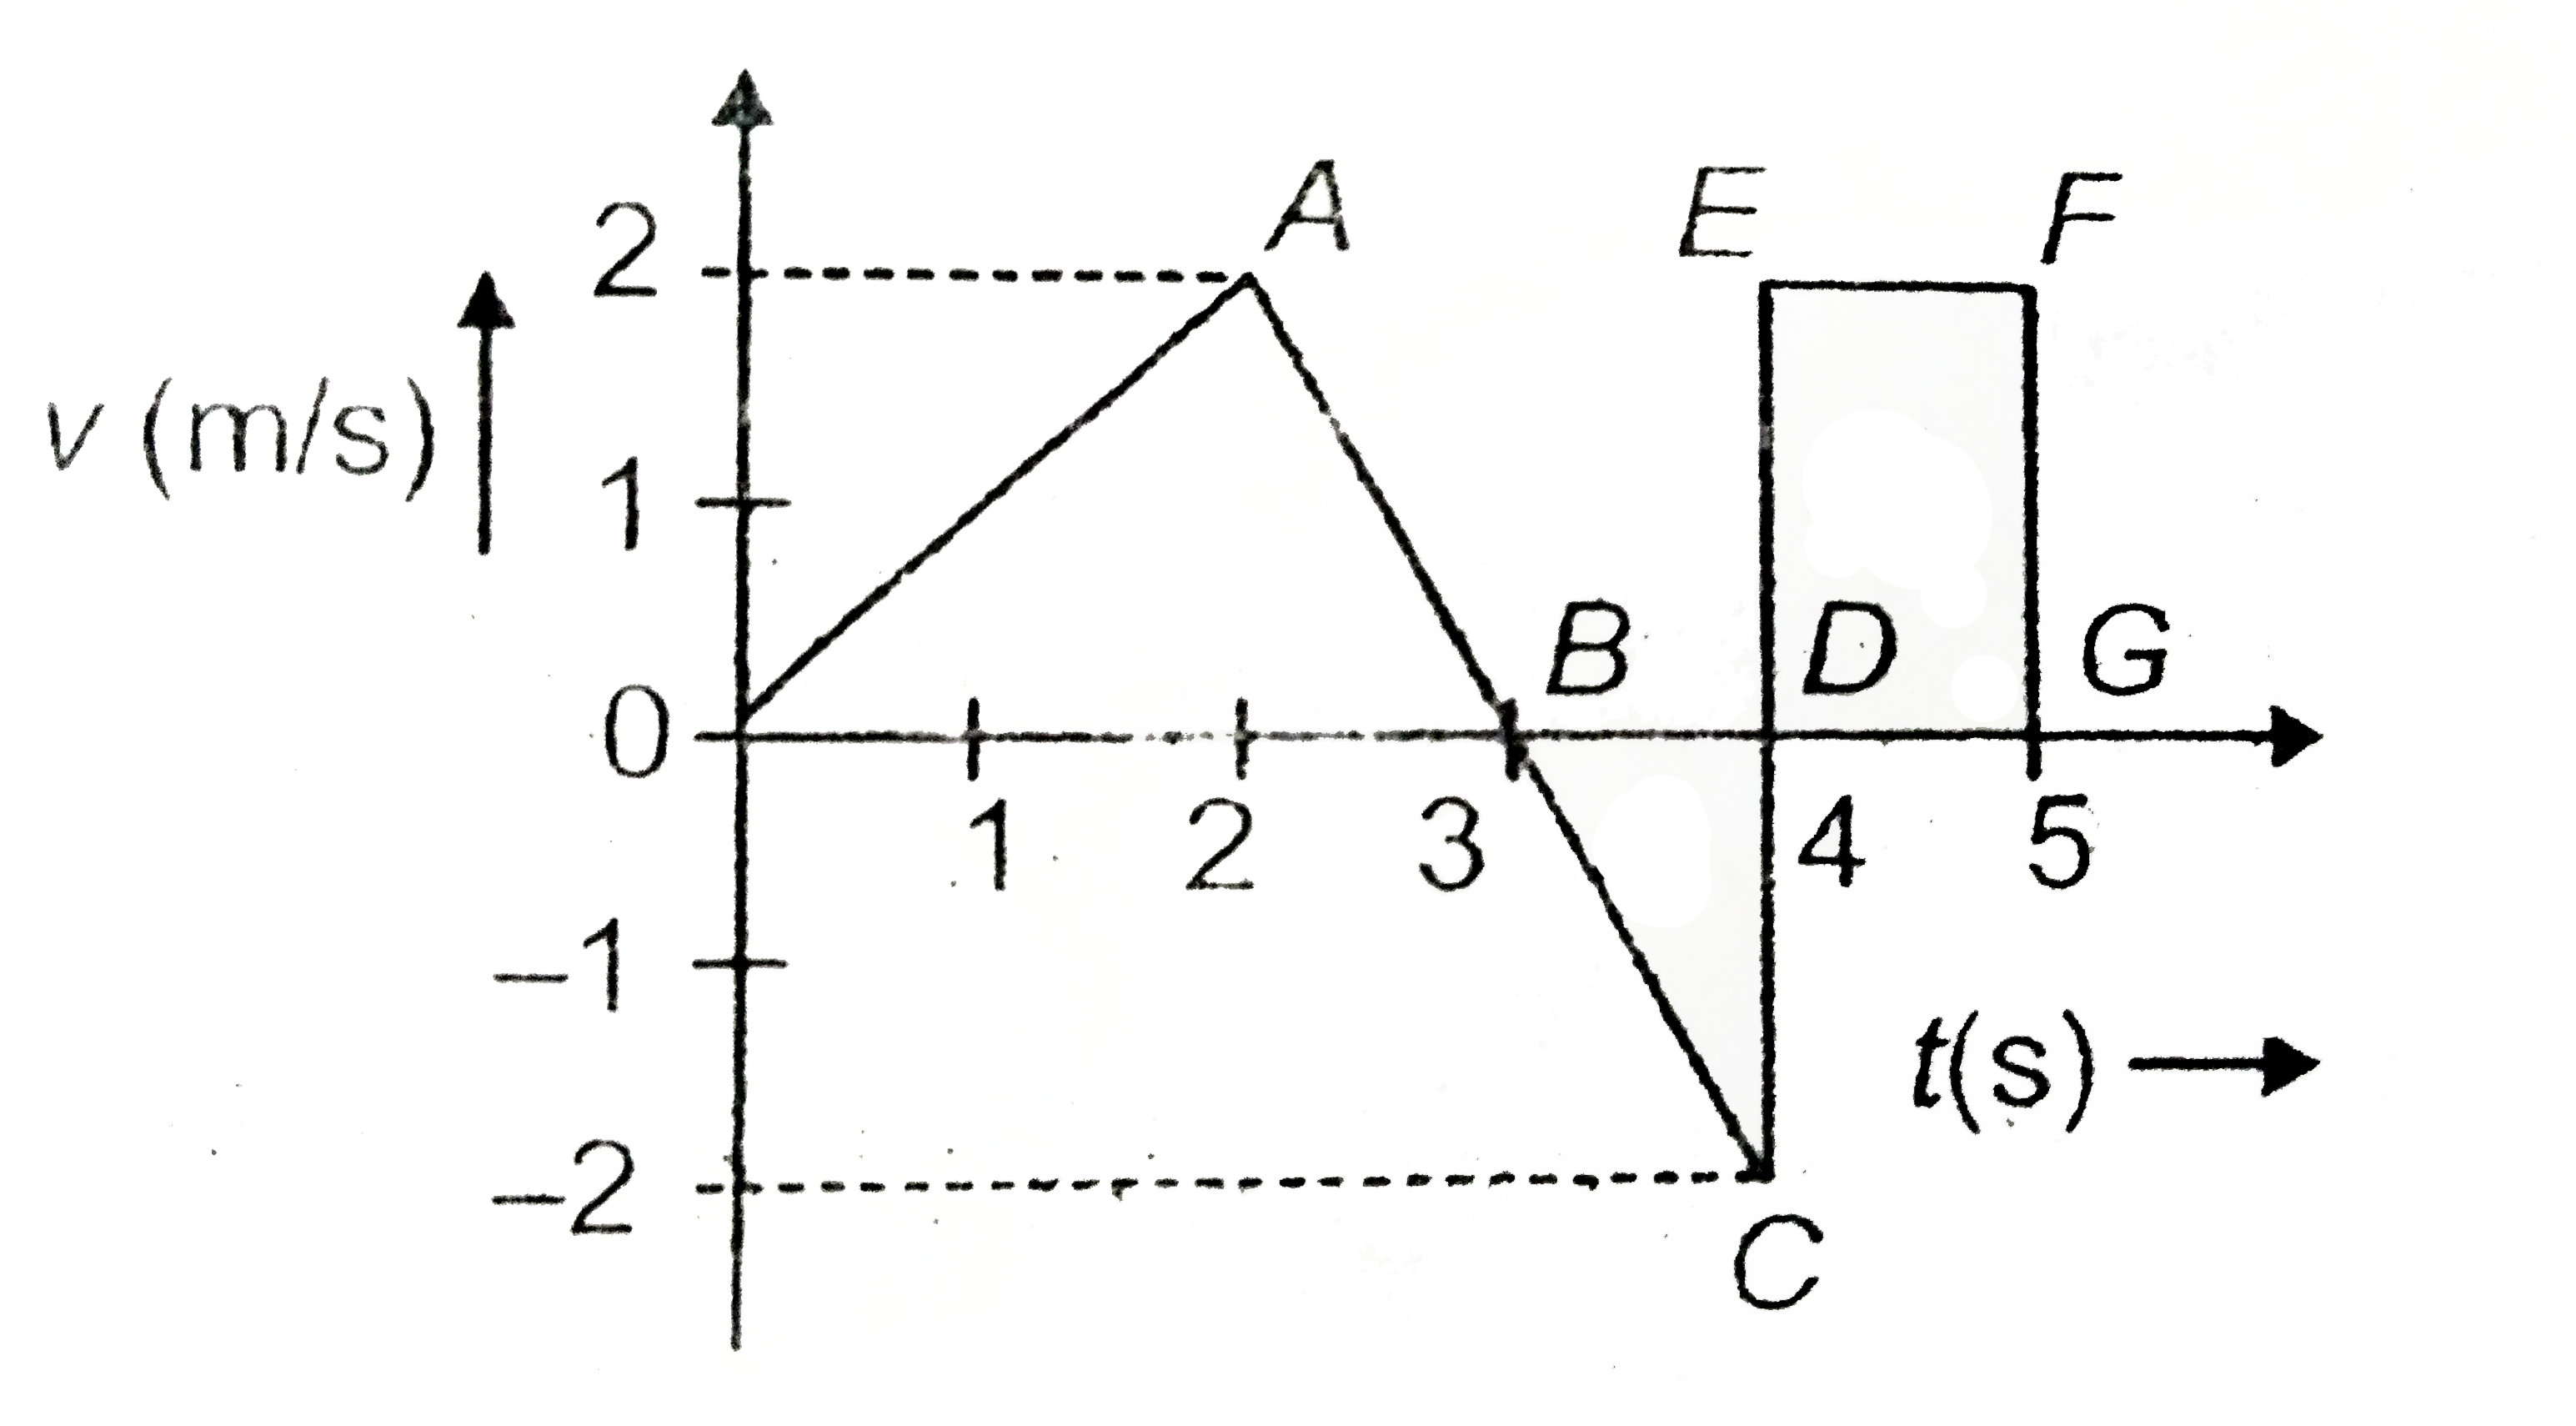
A v-t graph (velocity time) is shown in figure, the motion is along the straight line of X axis.

Find out the displacement in duration of 3 sec.
Displacement = ∫30→Vdt = area.under V-t graph
=∫20→Vdt+∫32→Vdt=12×2×2+(−12×1×2)
=2-1
=1 m along positive x-axis.
Topper's Solved these Questions
Similar Questions
The velocity-time graph of a body moving in a straight line is shown in Fig. Find the displacement and distance travelled by the body in 10 sec.
 View Solution
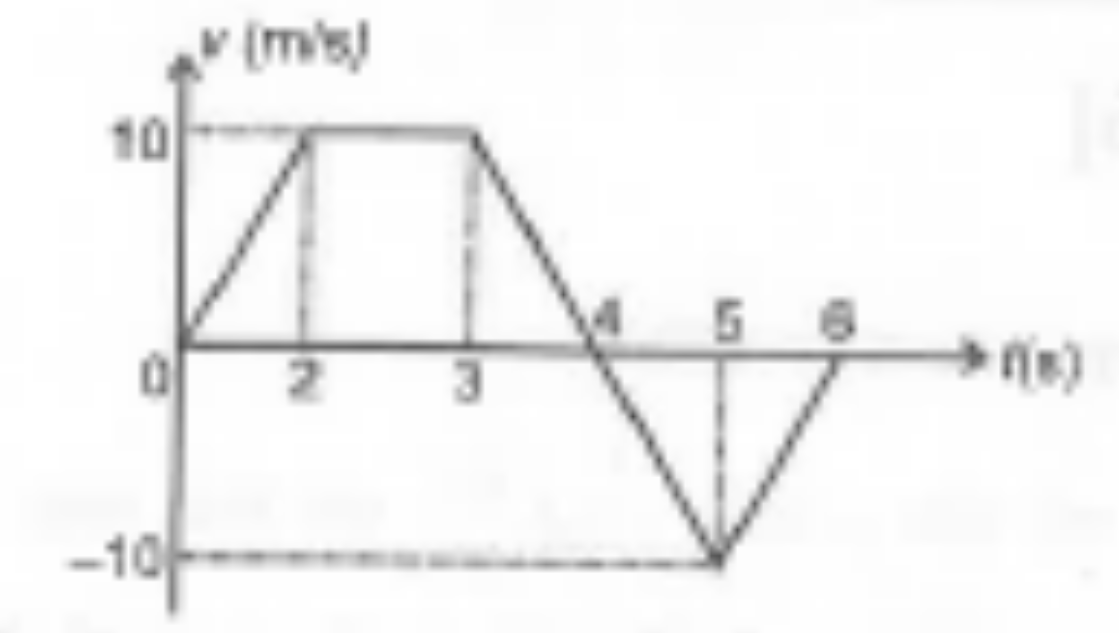
The velocity (v)-time (t) graph of a partide moving along a straight line is as shown in the figure. The displacement of the particle from t = 0 to t = 4 is
 View Solution
Knowledge Check
- Question 1 - Select One
The velocity - time graph of a particle moving along a straight line is shown in the figure given below
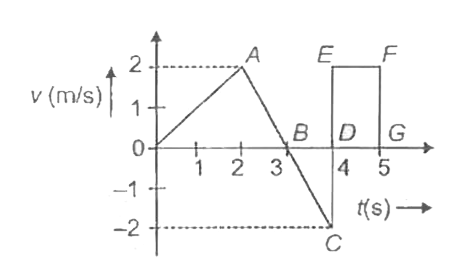
The displacement of the particle in 5 second isA0.5 mB1 mC2 mD4 m - Question 2 - Select One
The figure shows a velocity-time graph of a particle moving along a straight line
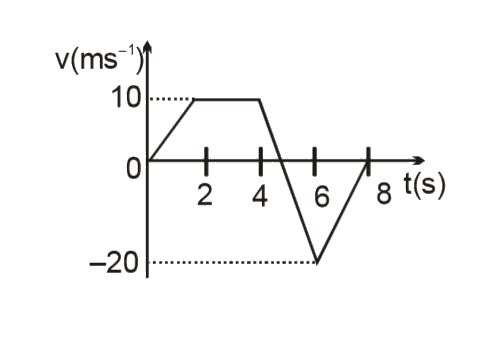
Q. The maximum of displacement of the particle isA33.3 mB23.3 mC18.3Dzero - Question 3 - Select One
The figure shows a velocity-time graph of a particle moving along a straight line
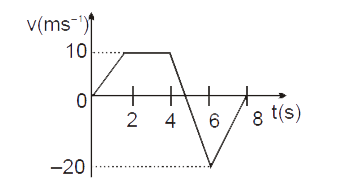
The maximum of displacement of the particle isA33.3 mB23.3 mC18.3Dzero
The velocity-time graph of a particle moving along a straight line is shown in the figure-given below
The displacement of the particle in 5 second isView SolutionThe velocity - time graph of a particle moving along a straight line is shown in the figure given below
The displacement of the particle in 5 second is
 View Solution
The velocity displacement graph of a particle moving along a straight line is shown in figure.
Then the acceleration displacement graph is.View Solution
The velocity displacement graph of a particle moving along a straight line is shown in figure.
Then the acceleration displacement graph is.View SolutionThe figure shows a velocity-time graph of a particle moving along a straight line
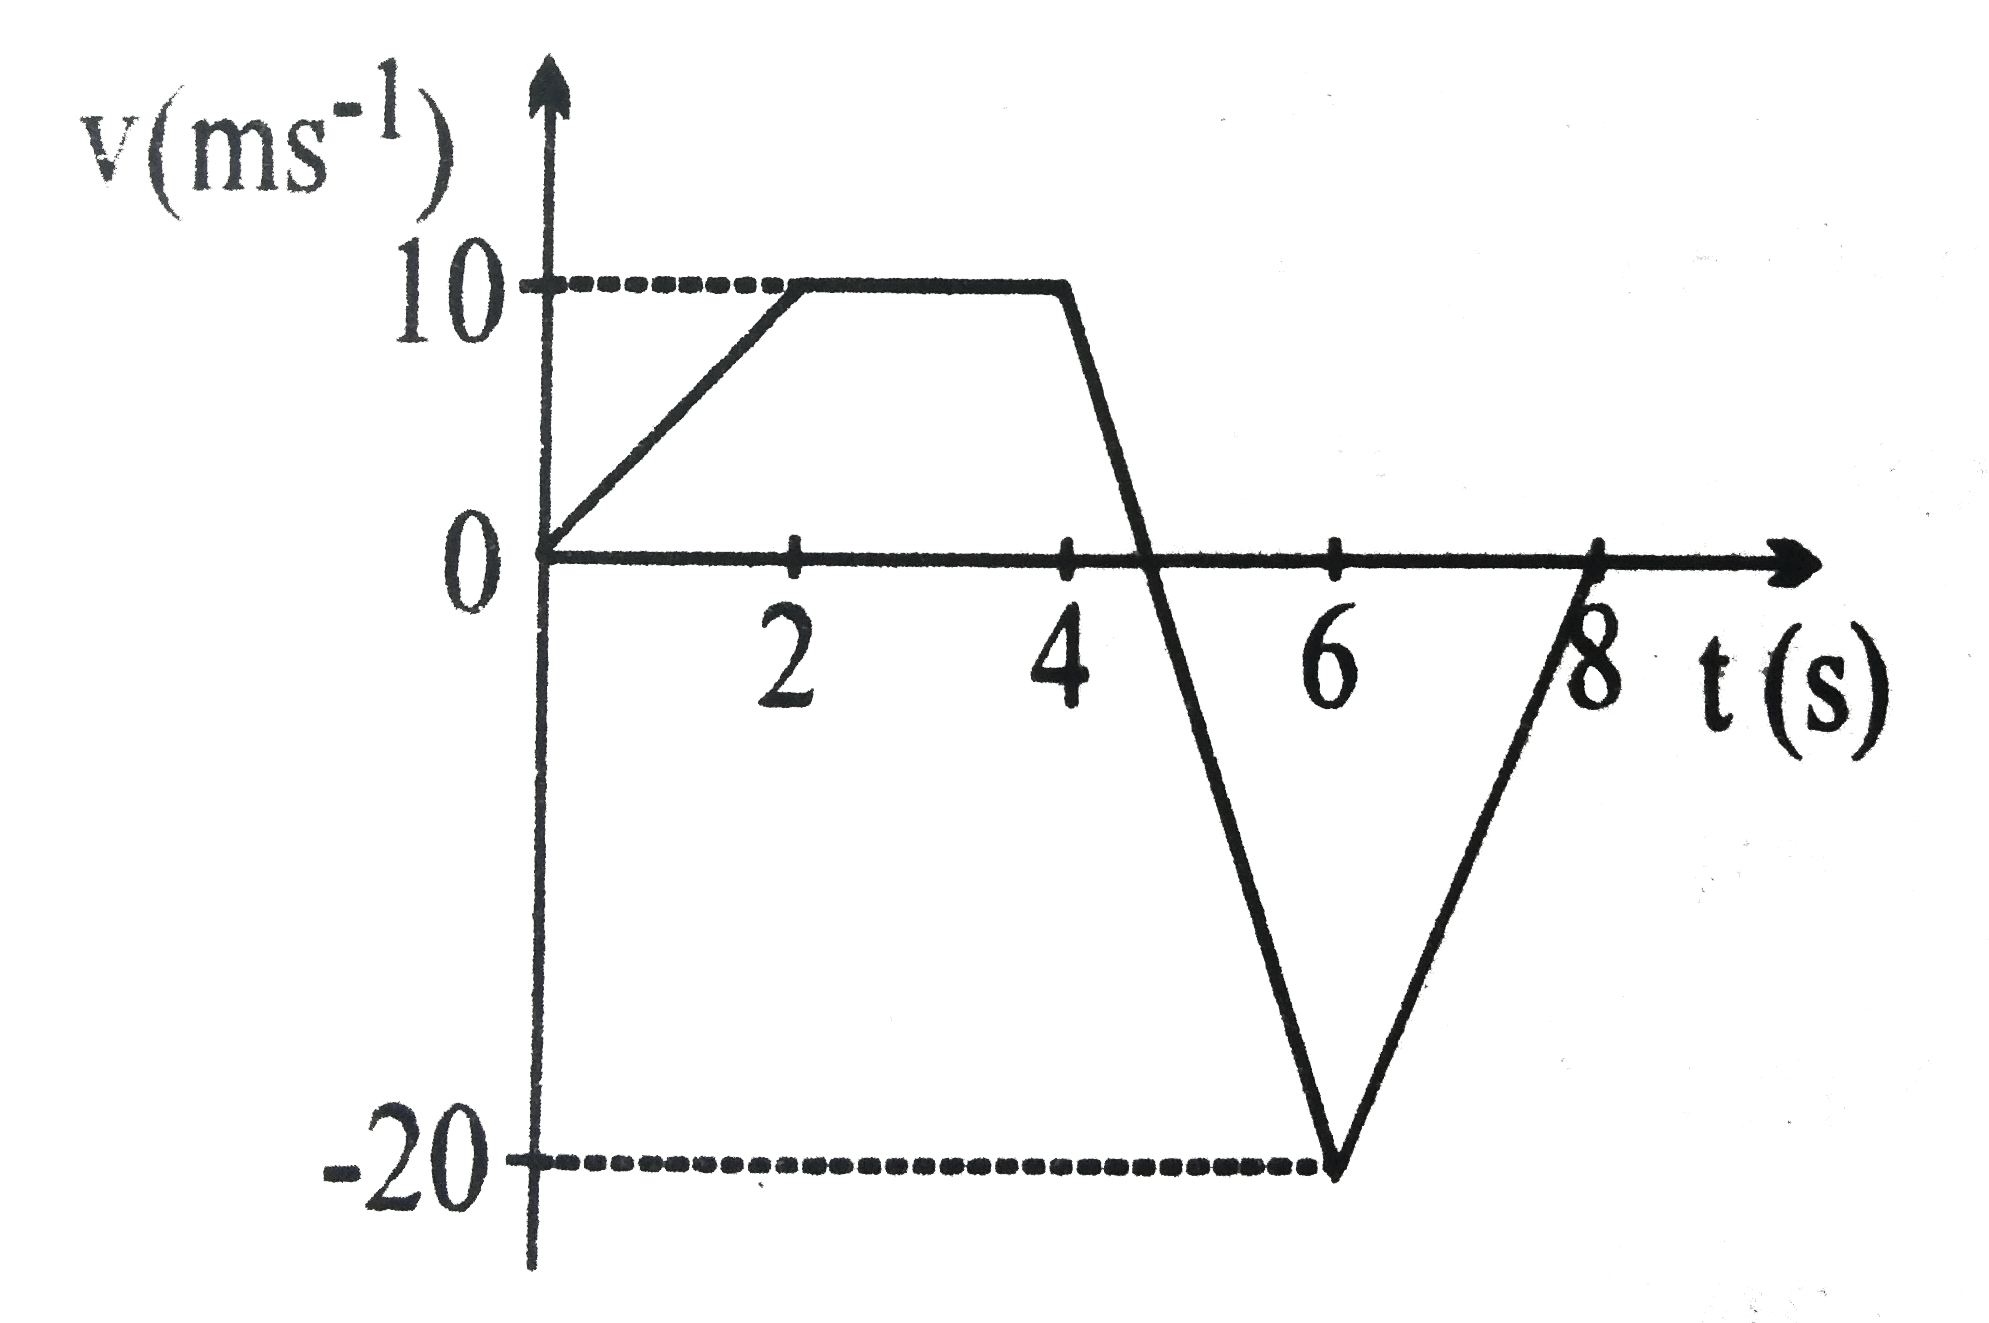
The maximum displacement of the particle isView Solution

