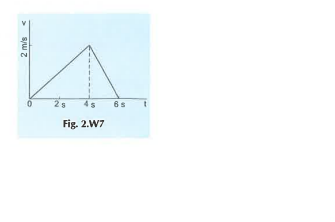
A v-t graph (velocity time) is shown in figure, the motion is along the straight line of X axis.

Find out the distance covered in duration of 4 sec.
Distance = ∫40∣∣→V∣∣dt=∫20∣∣→V∣∣dt+∫42∣∣→V∣∣dt
= 12×2×2+12×2=4m
Topper's Solved these Questions
Similar Questions
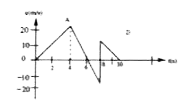
The velocity (u)-time (t) graph of an object moving along a straight line is as shown is Fig. 2 (b) . 30. Calculate the distance covered by object between (i)t=0→t=5s (ii) t=0→t=10s.
 .
.
View SolutionThe velocity (u)-time (t) graph of an object moving along a straight line is as shown is Fig. 2 (b) . 30. Calculate the distance covered by object between (i)t=0→t=5s (ii) t=0→t=10s.
 .
.
View Solution
Knowledge Check
The velocity-time (v – t) graph of a body is shown in the figure. For the intervals OP and PQ, the ratio of the distances covered is
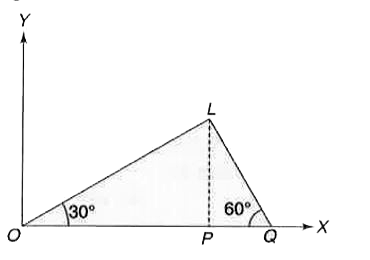 A1:3B√3:1C3:1D√3:2
Velocity time graph for the motion of a particle along a straight line is as shown in figure.
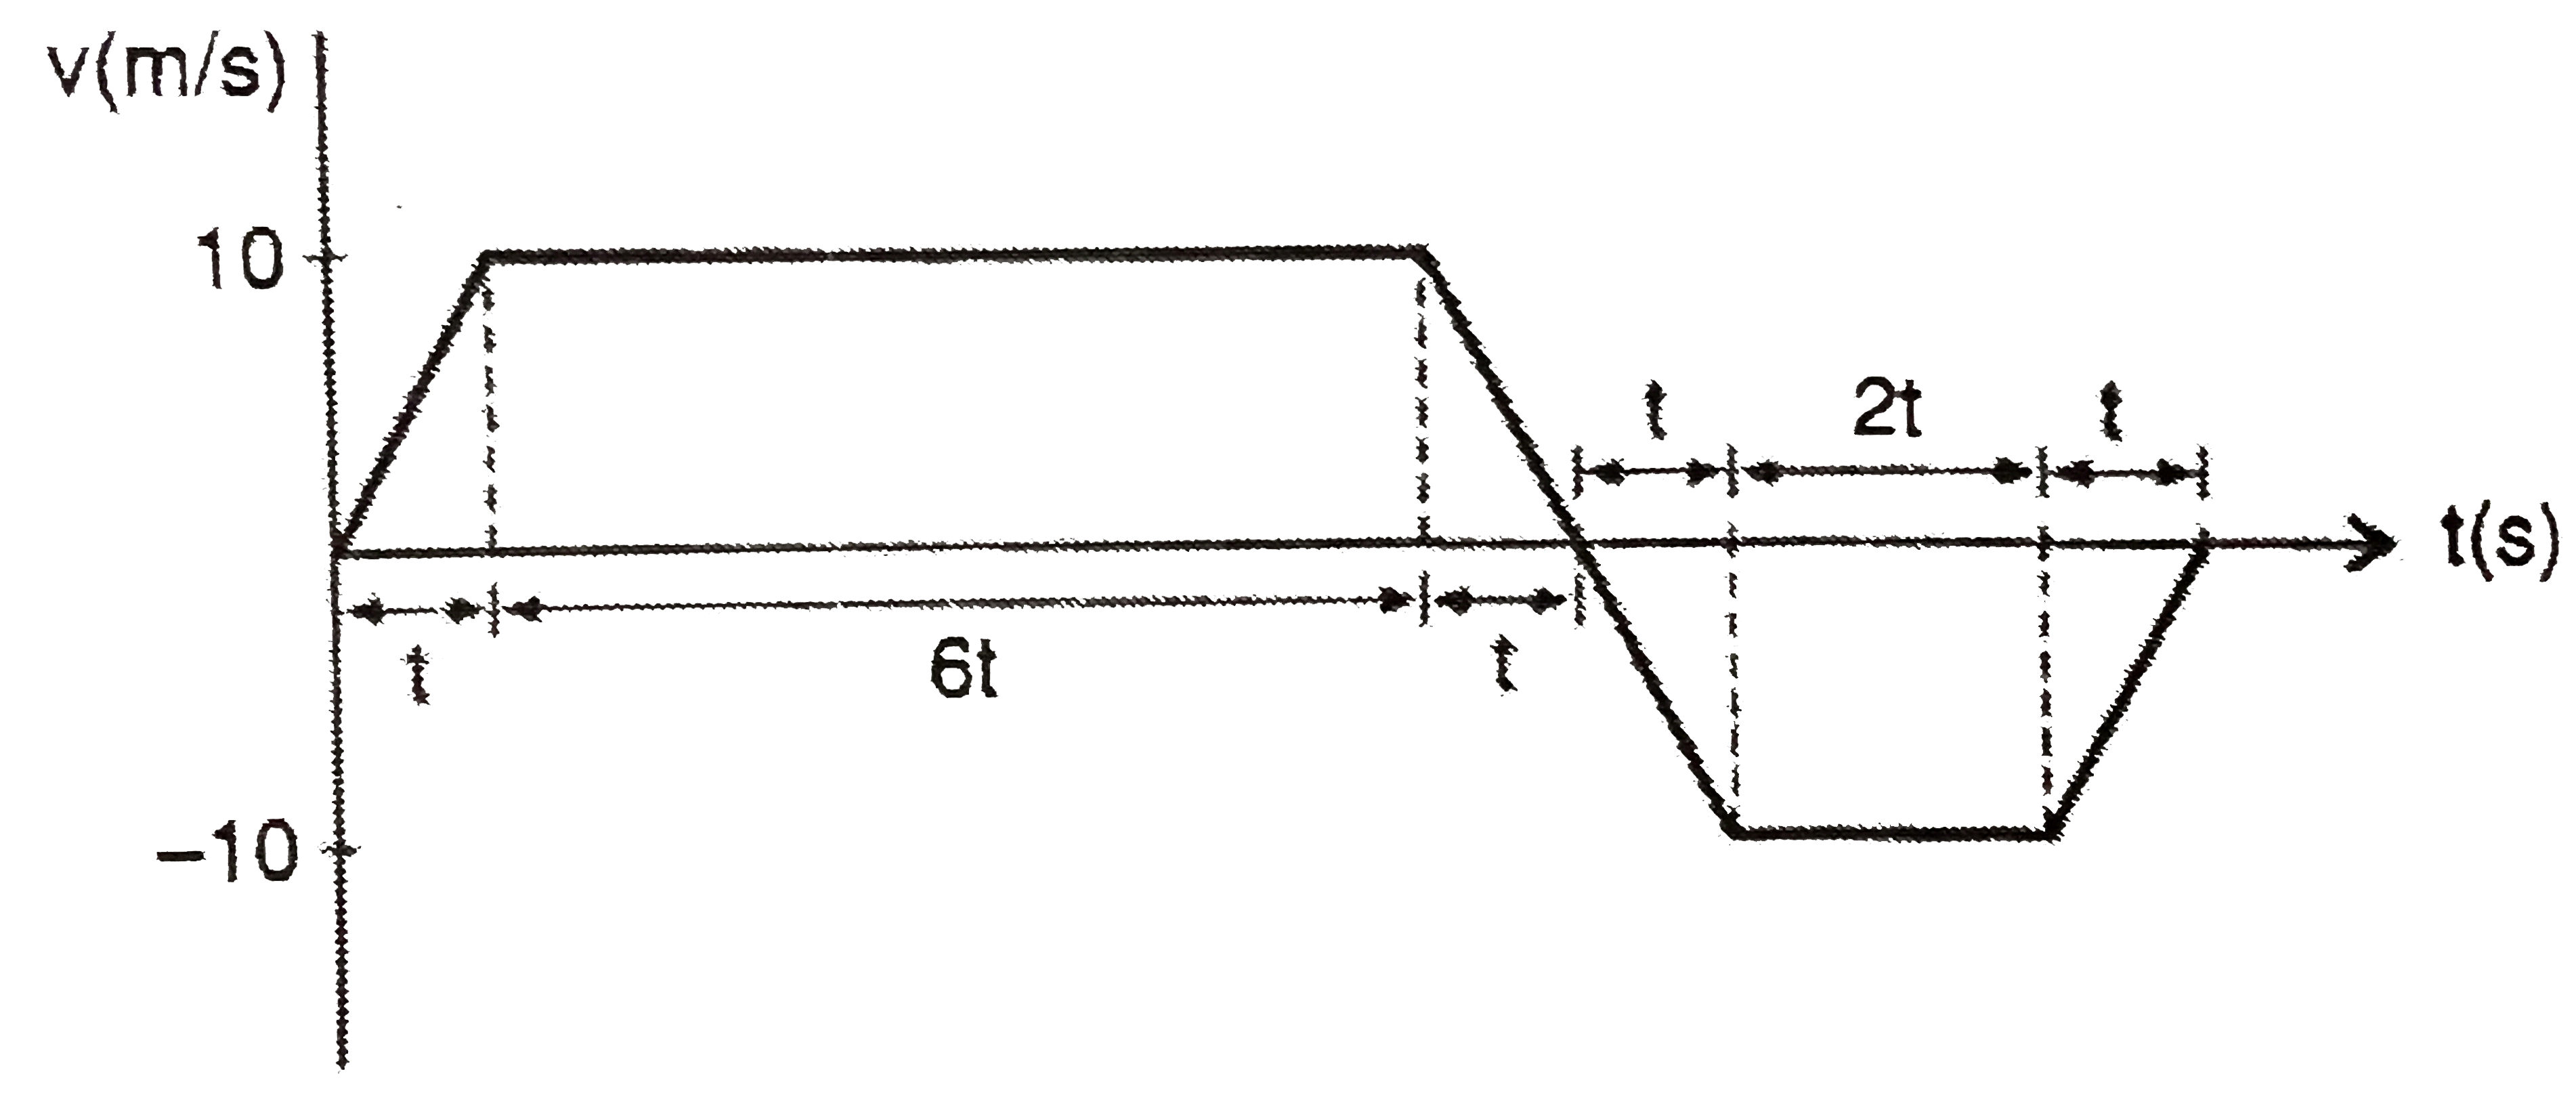
Average speed of the particle for the whole motion is:A9.6 m/sB7.2 m/sC8.3 m/sD6.5 m/s
The velocity-time graph of an object moving along a straight line is as shown in Fig. 3.37. Find the net distance covered by the object in time interval between t=0 to t=10s. Also find the displacement in time 0 to 10 s.
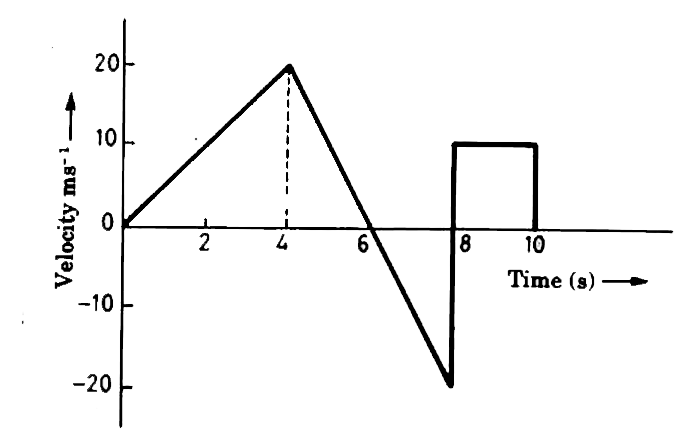
View SolutionThe velocity-time graph of a particle moving along a straight line is shown in Figure 2.W7.Is the motion uniform?
View SolutionThe velocity-time graph of a body moving in a straight line is shown in Fig. Find the displacement and distance travelled by the body in 10 sec.
View SolutionThe velocity-time graph of a particle moving along a straight line is shown in Figure 2.W7.
Does the particle change its direction of motion ?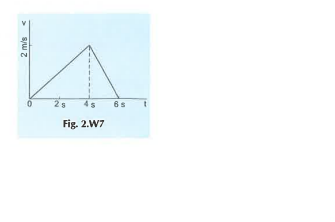
View SolutionA material particle is moving along a straight line in such a manner that its velocity varies as shown in the figure. At which moment in time numbered successively on the time axis will the acceleration of the particle be maximal? How should one use the graph to determine the average velocity of motion over the time interval from t1 to t2 ?
View SolutionThe velocity-time graph of a particle moving along a straight line is shown in the figure-given below
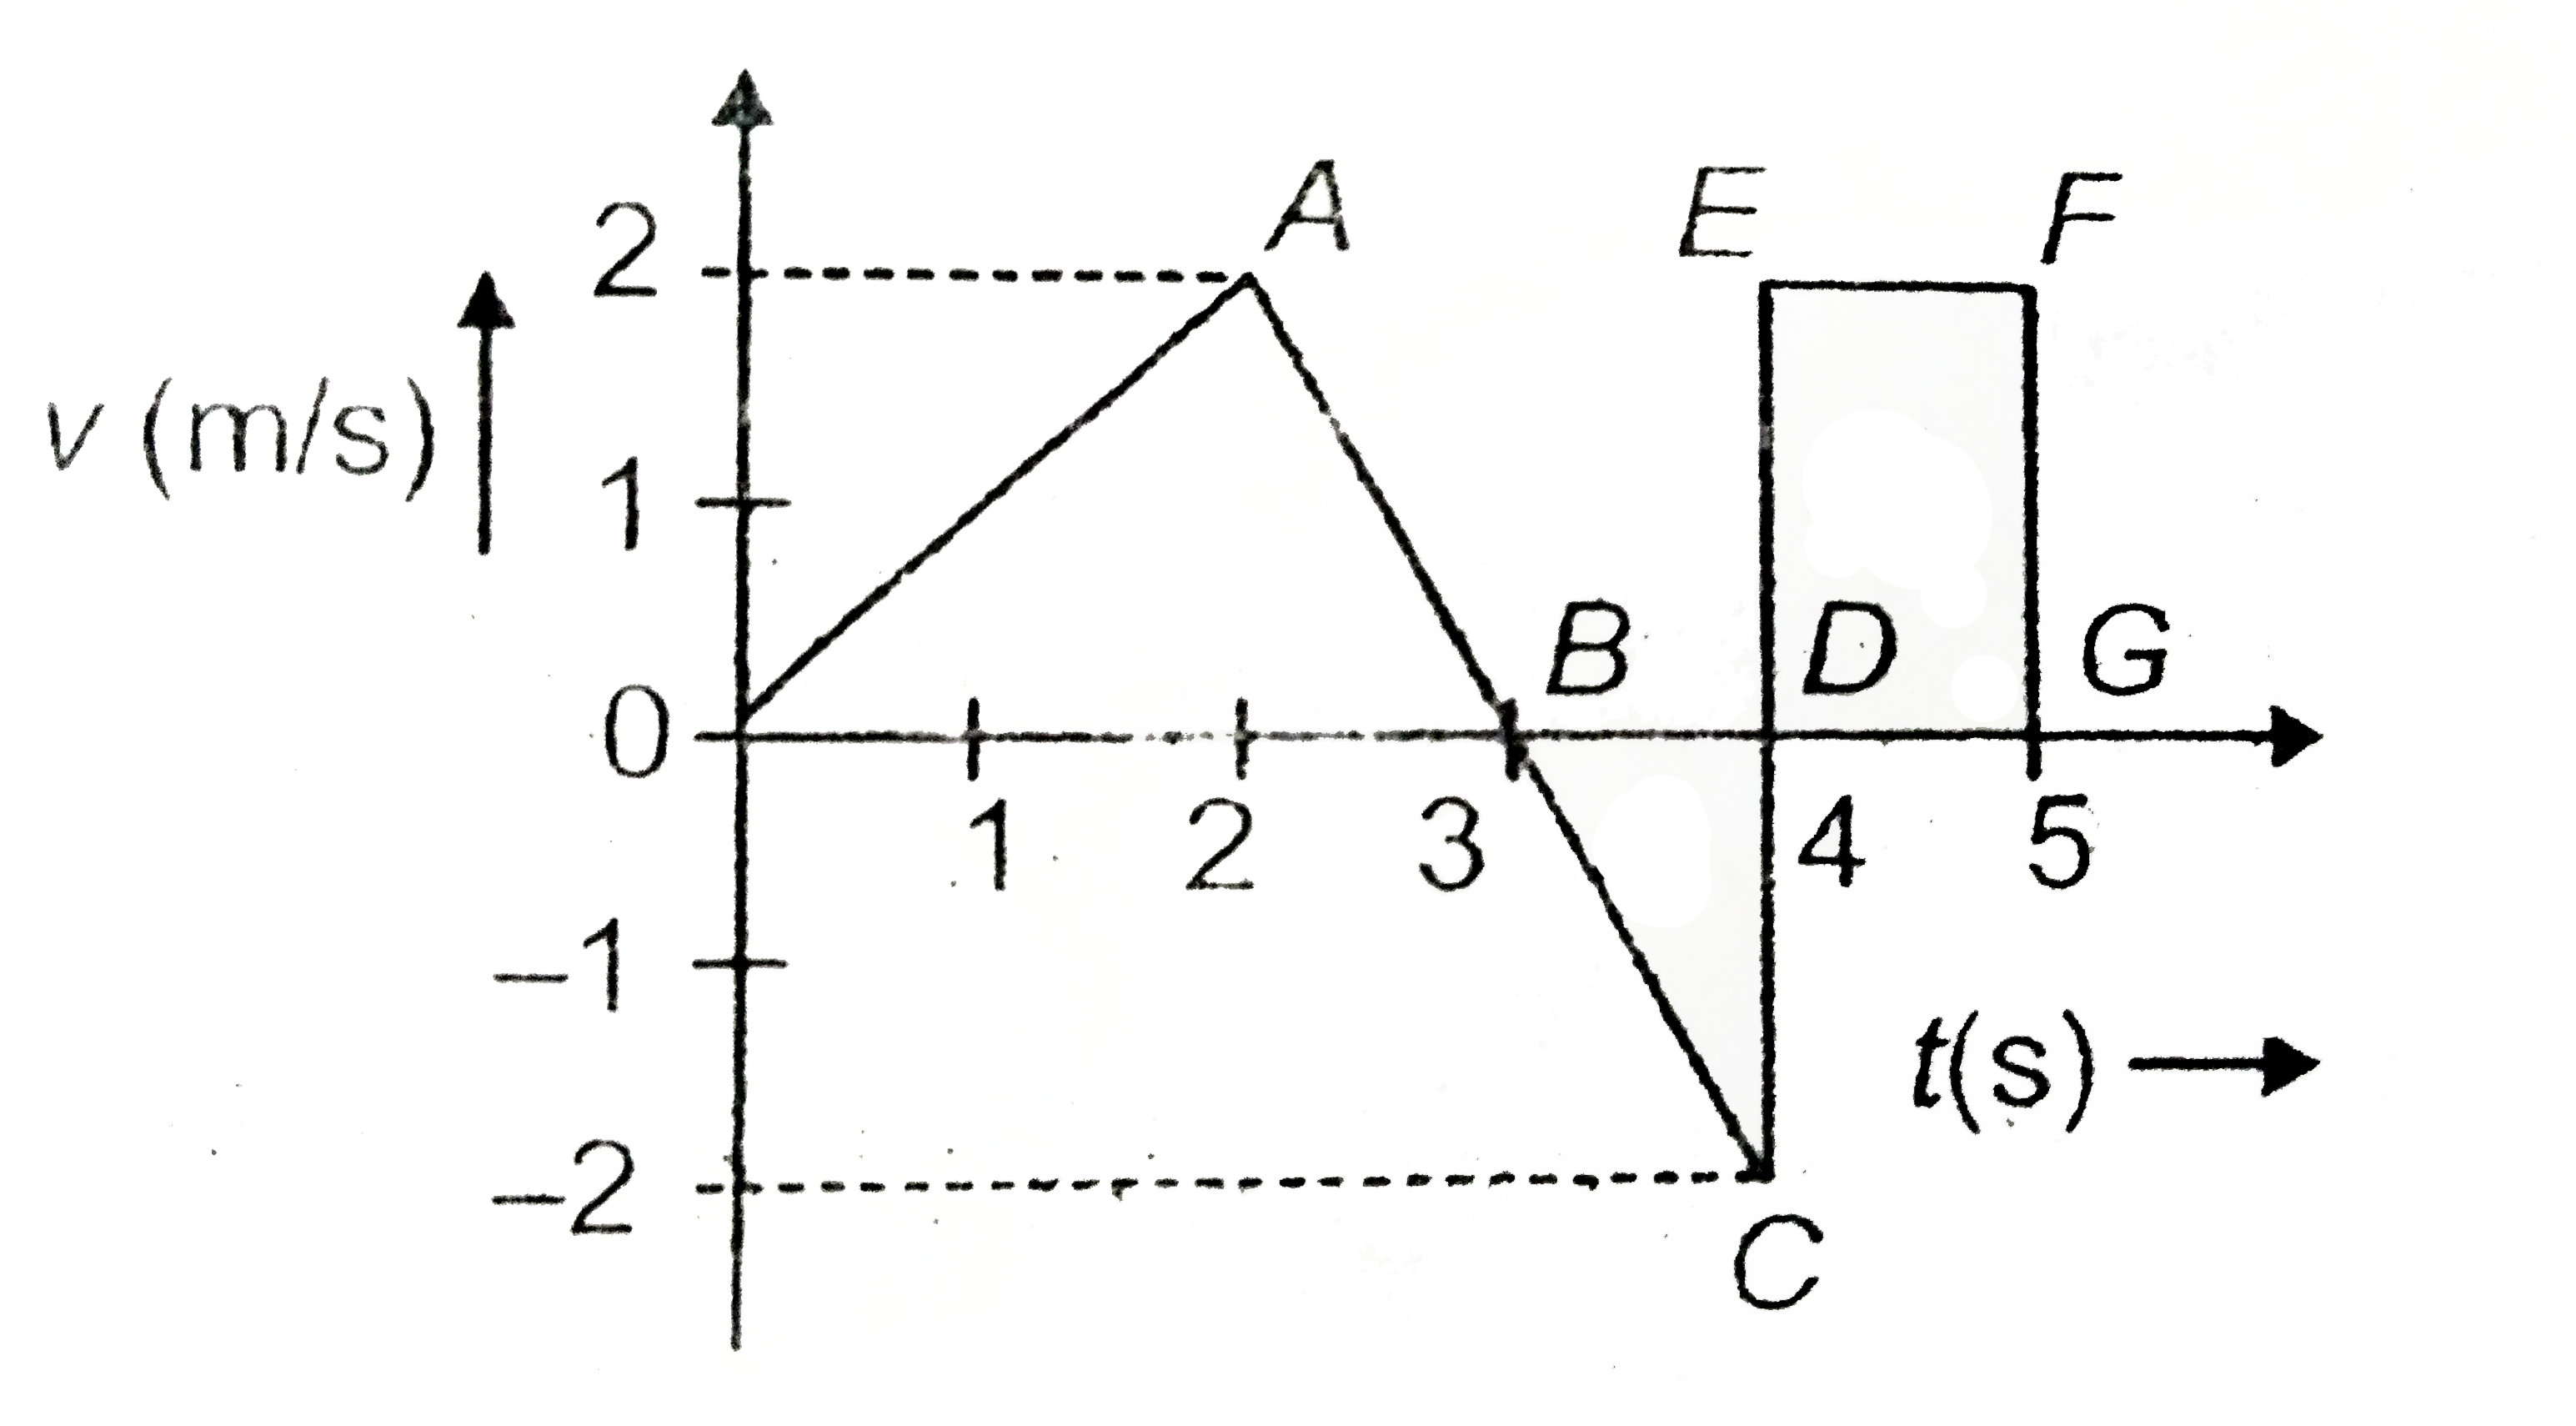
The displacement of the particle in 5 second is
View Solution
