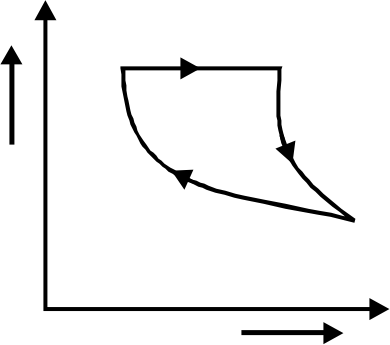
Find the efficiancy of the cylcle shown in fig Processes BC and CA are isochoric and isobaric respectively and the process equation for curve AB IS P = Given that adiabatic exponent of gas is

Topper's Solved these Questions
Similar Questions

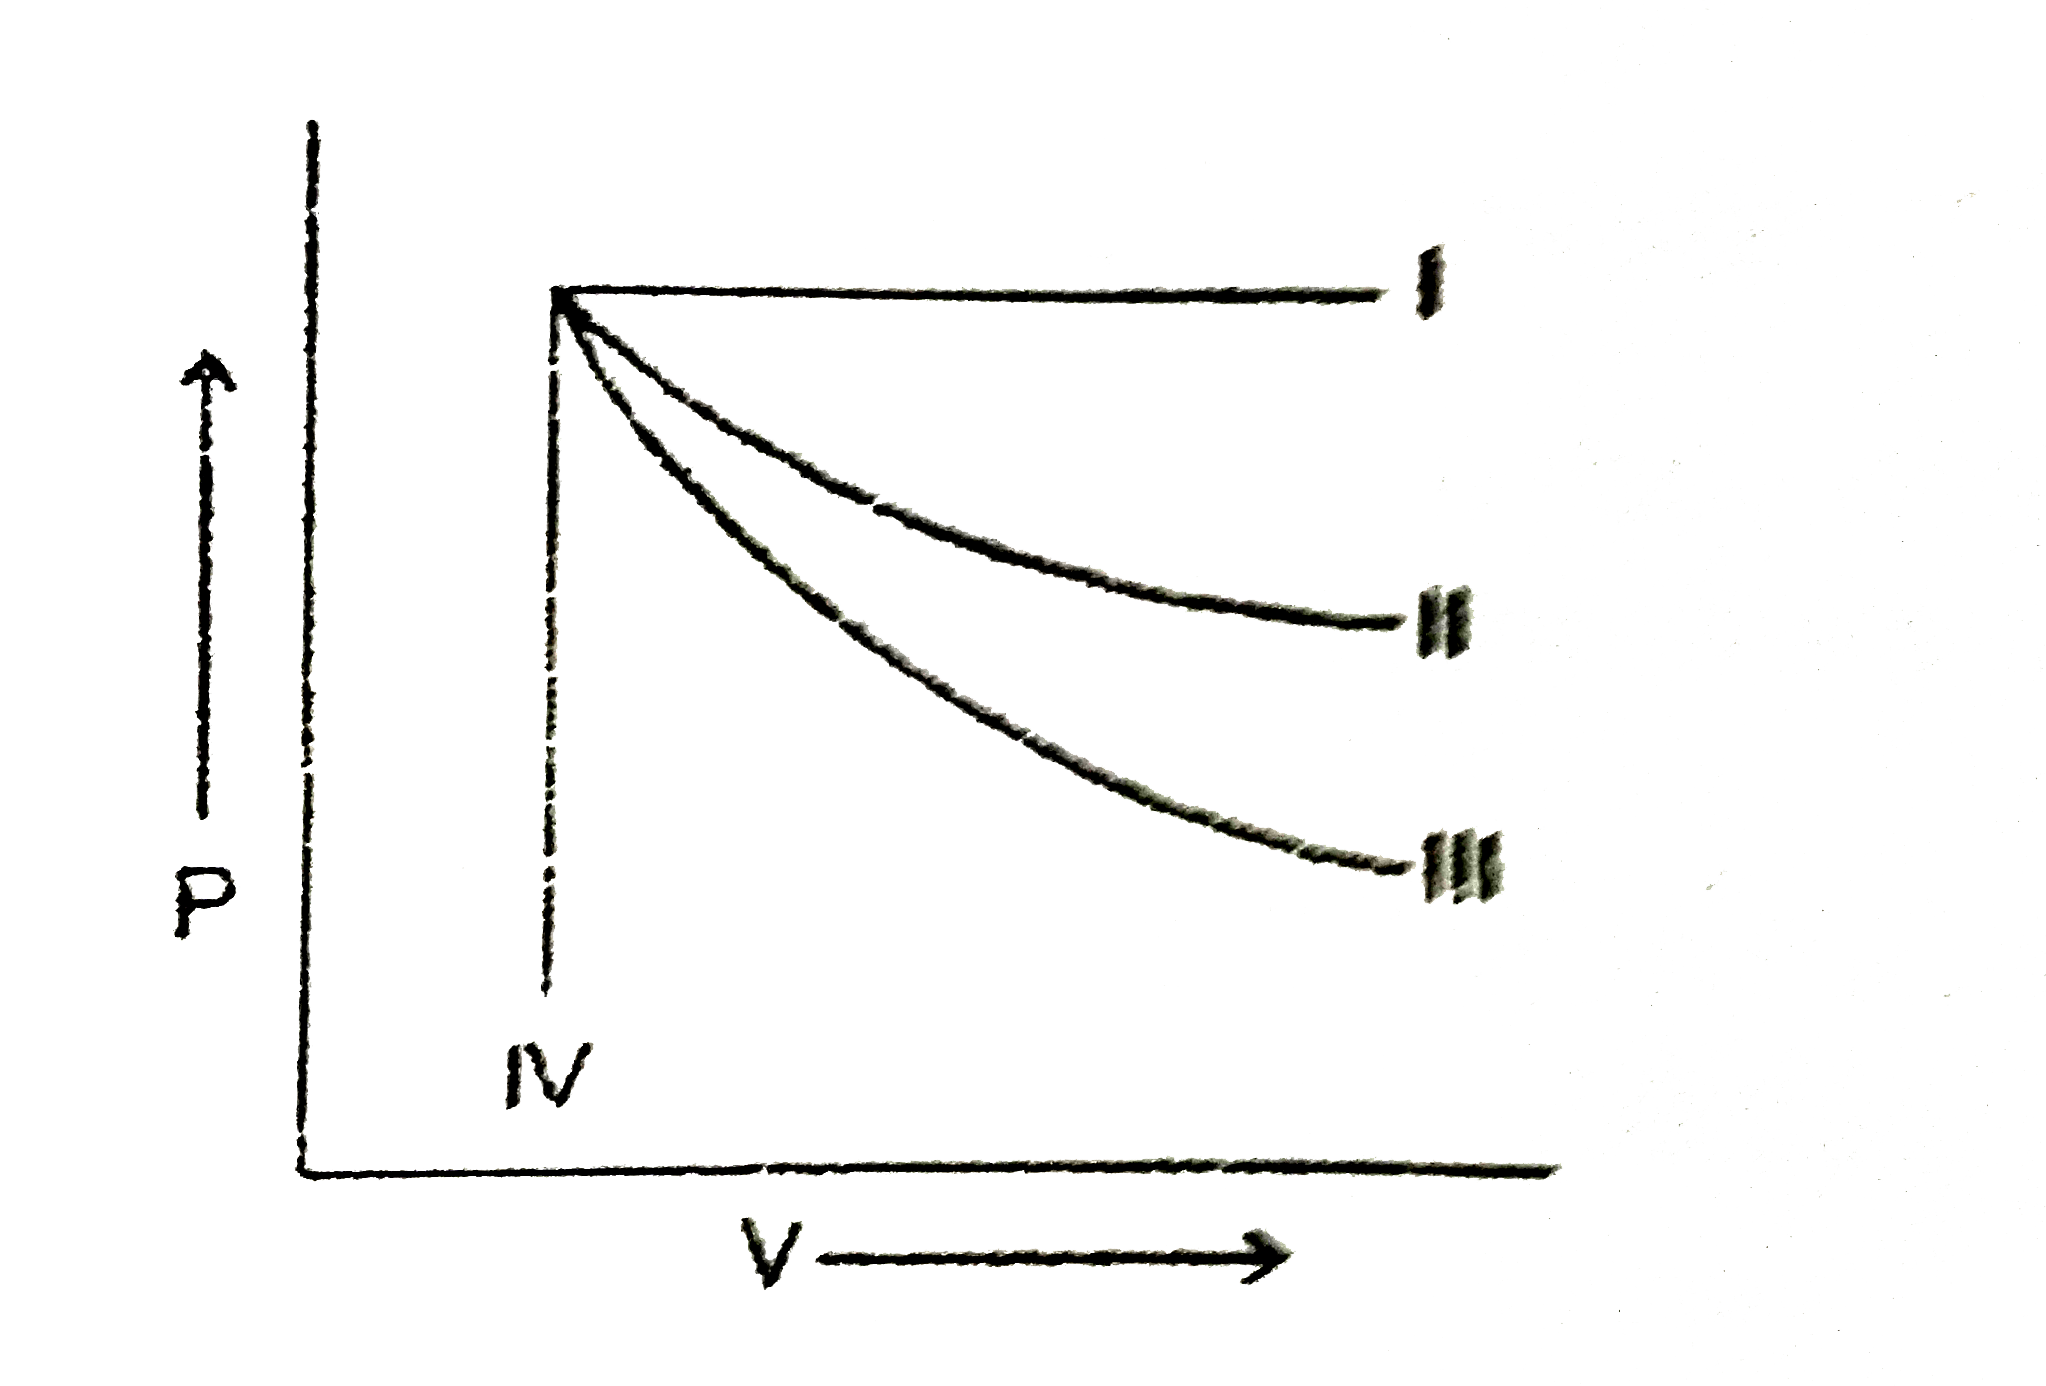
The plots between P and V which represent isochoric and isobaric process respectively:
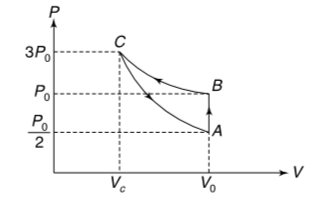
View SolutionOne mole of an ideal gas is carried through a thermodynamics cycle as shown in the figure. The cycle consists of an isochoric, an isothermal and an adiabatic process. Find the adiabatic exponent of the gas.

View Solution
Knowledge Check

The plots between P and V which represent isochoric and isobaric process respectively:AI,IIBIV,ICI,IVDII,IIIIn an isobaric process (λ is adiabatic exponent of the gas)
AThe heat given to gas is λλ−1 times the work done by gas.BThe work done by gas is (λ−1) time the change in internal energy.CThe temperature of gas in increased.DThe temperature of gas is decreased.The relation between U, p and V for an ideal gas in an adiabatic process is given by relation U=a+bpV. Find the value of adiabatic exponent (γ) of this gas.
Ab+1bBb+1aCa+1bDaa+b
In an isobaric process (λ is adiabatic exponent of the gas)
View SolutionCalculate the efficiency of a cycle consisting of isothermal, isobaric, and isochoric line, if in the isothermal process the volume of the ideal gas with the adiabatic exponent γ.
(a) increased n−fold ,
(b) decreases n−fold.
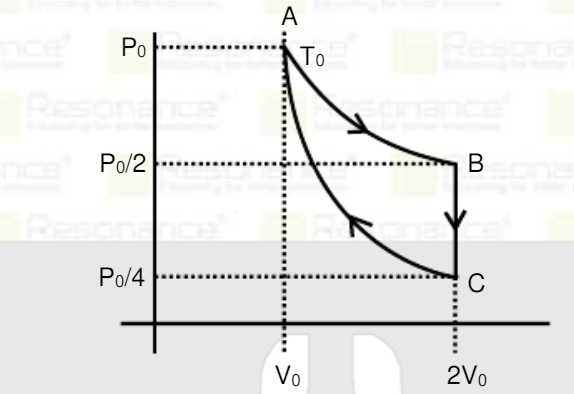
View SolutionFind work in the given cycle, If AB is isothermal process and CA is adiabatic.

View SolutionFind the efficiency of a cycle consisting of two isobaric and two adiabatic lines, if the pressure changes n times within the cycle. The working substance is an ideal gas whose adiabatic exponent is equal to γ.
View SolutionFor a given thermodynamic cyclic process, P−V indicator diagram is as shown in the figure. Process AB,BC&CA are isobaric, & isothermal respectively. Then which of the following curve represent correc V−T indicator diagram for the process ABCA?

View Solution
