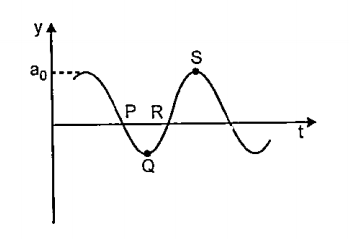
A wave motion has the function y=a0sin(ωt−kx).The graph in figure shows how the displacement y at a fixed point varies with time t. Which one of the labelled points shows a displacement equal to that at the position x=π2k at time t =0?
P
Q
R
S
The correct Answer is:B
Topper's Solved these Questions
Similar Questions
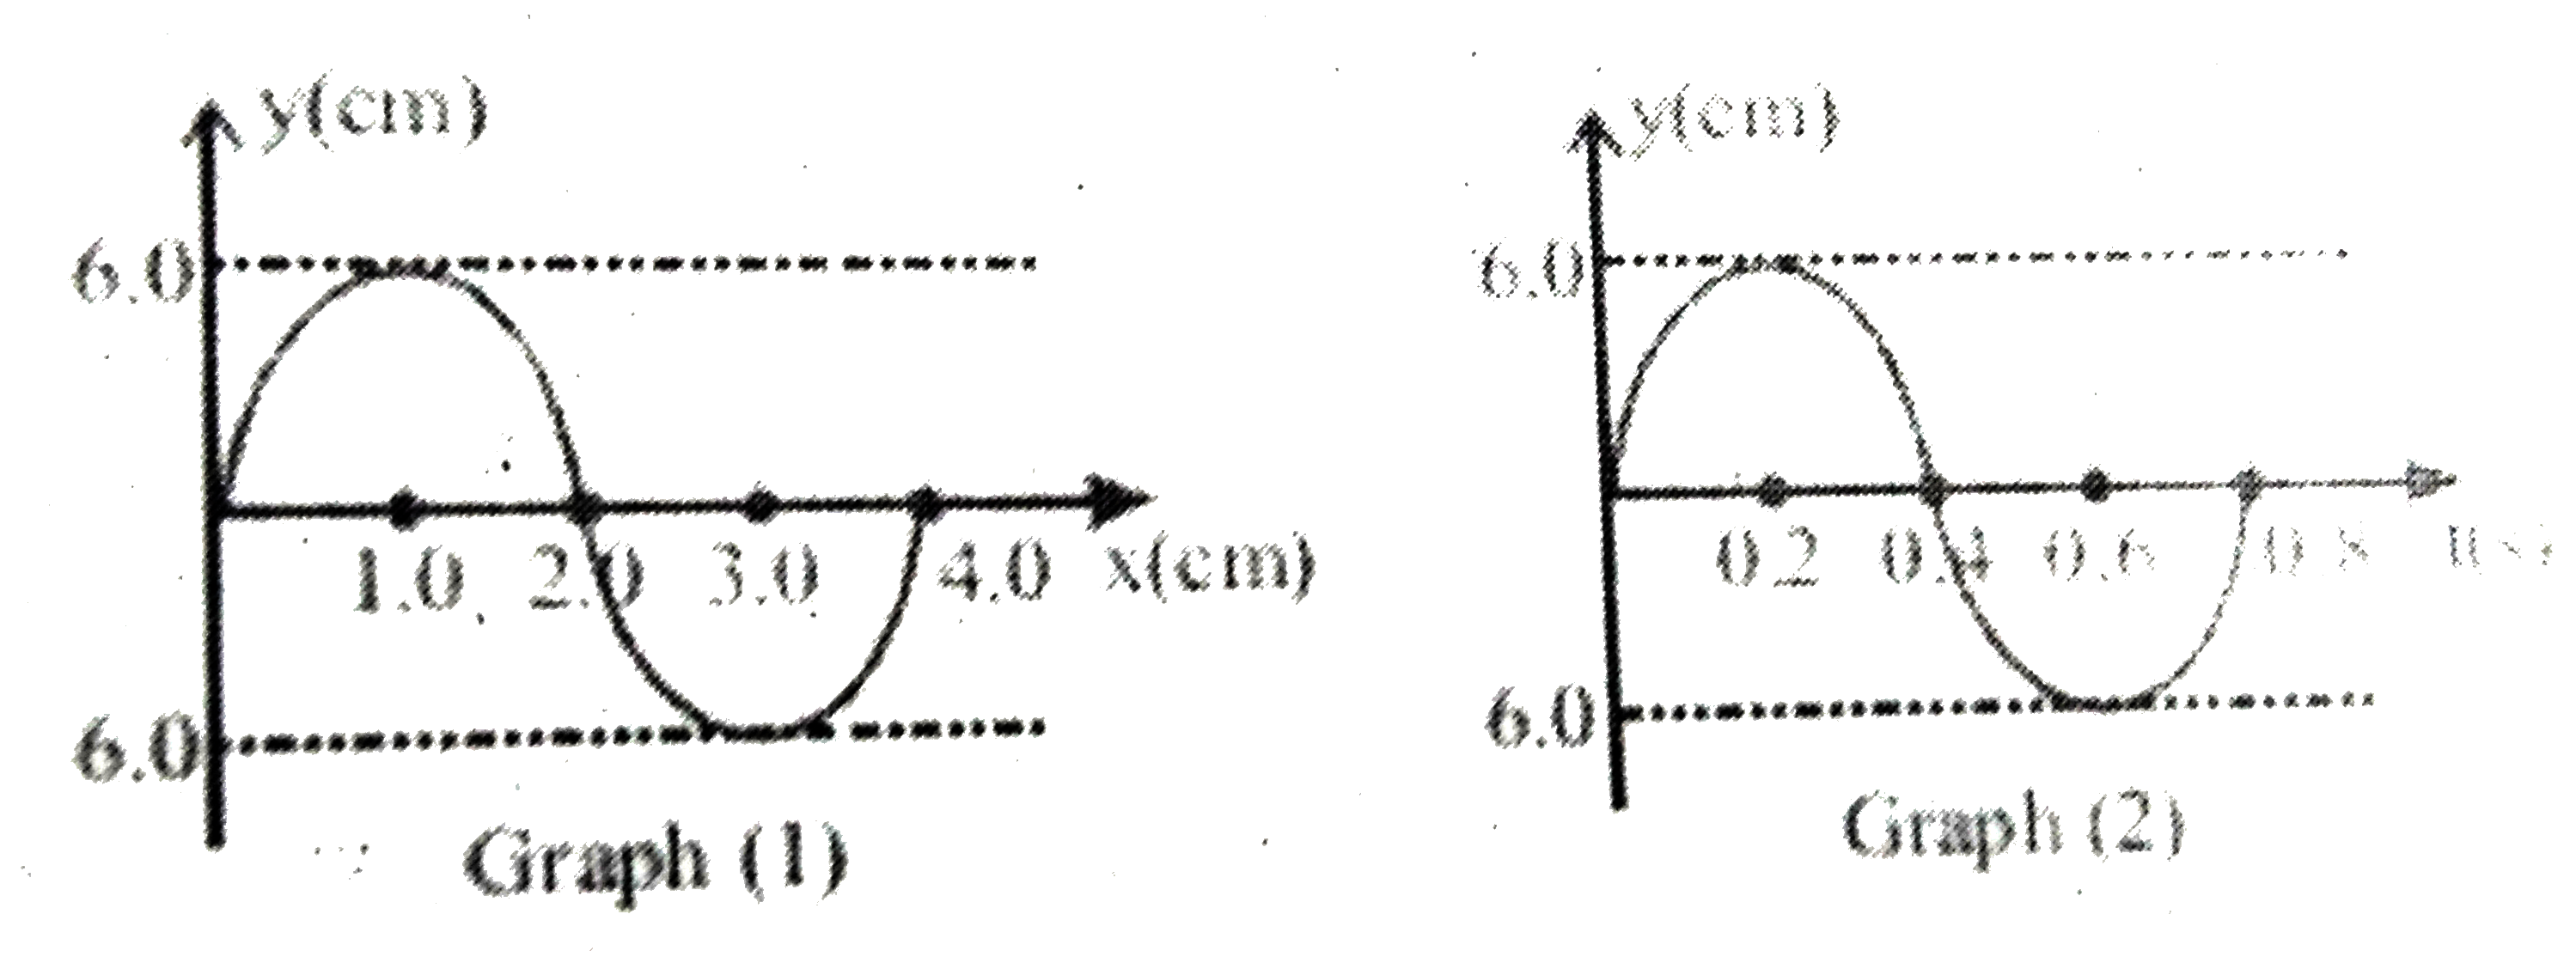
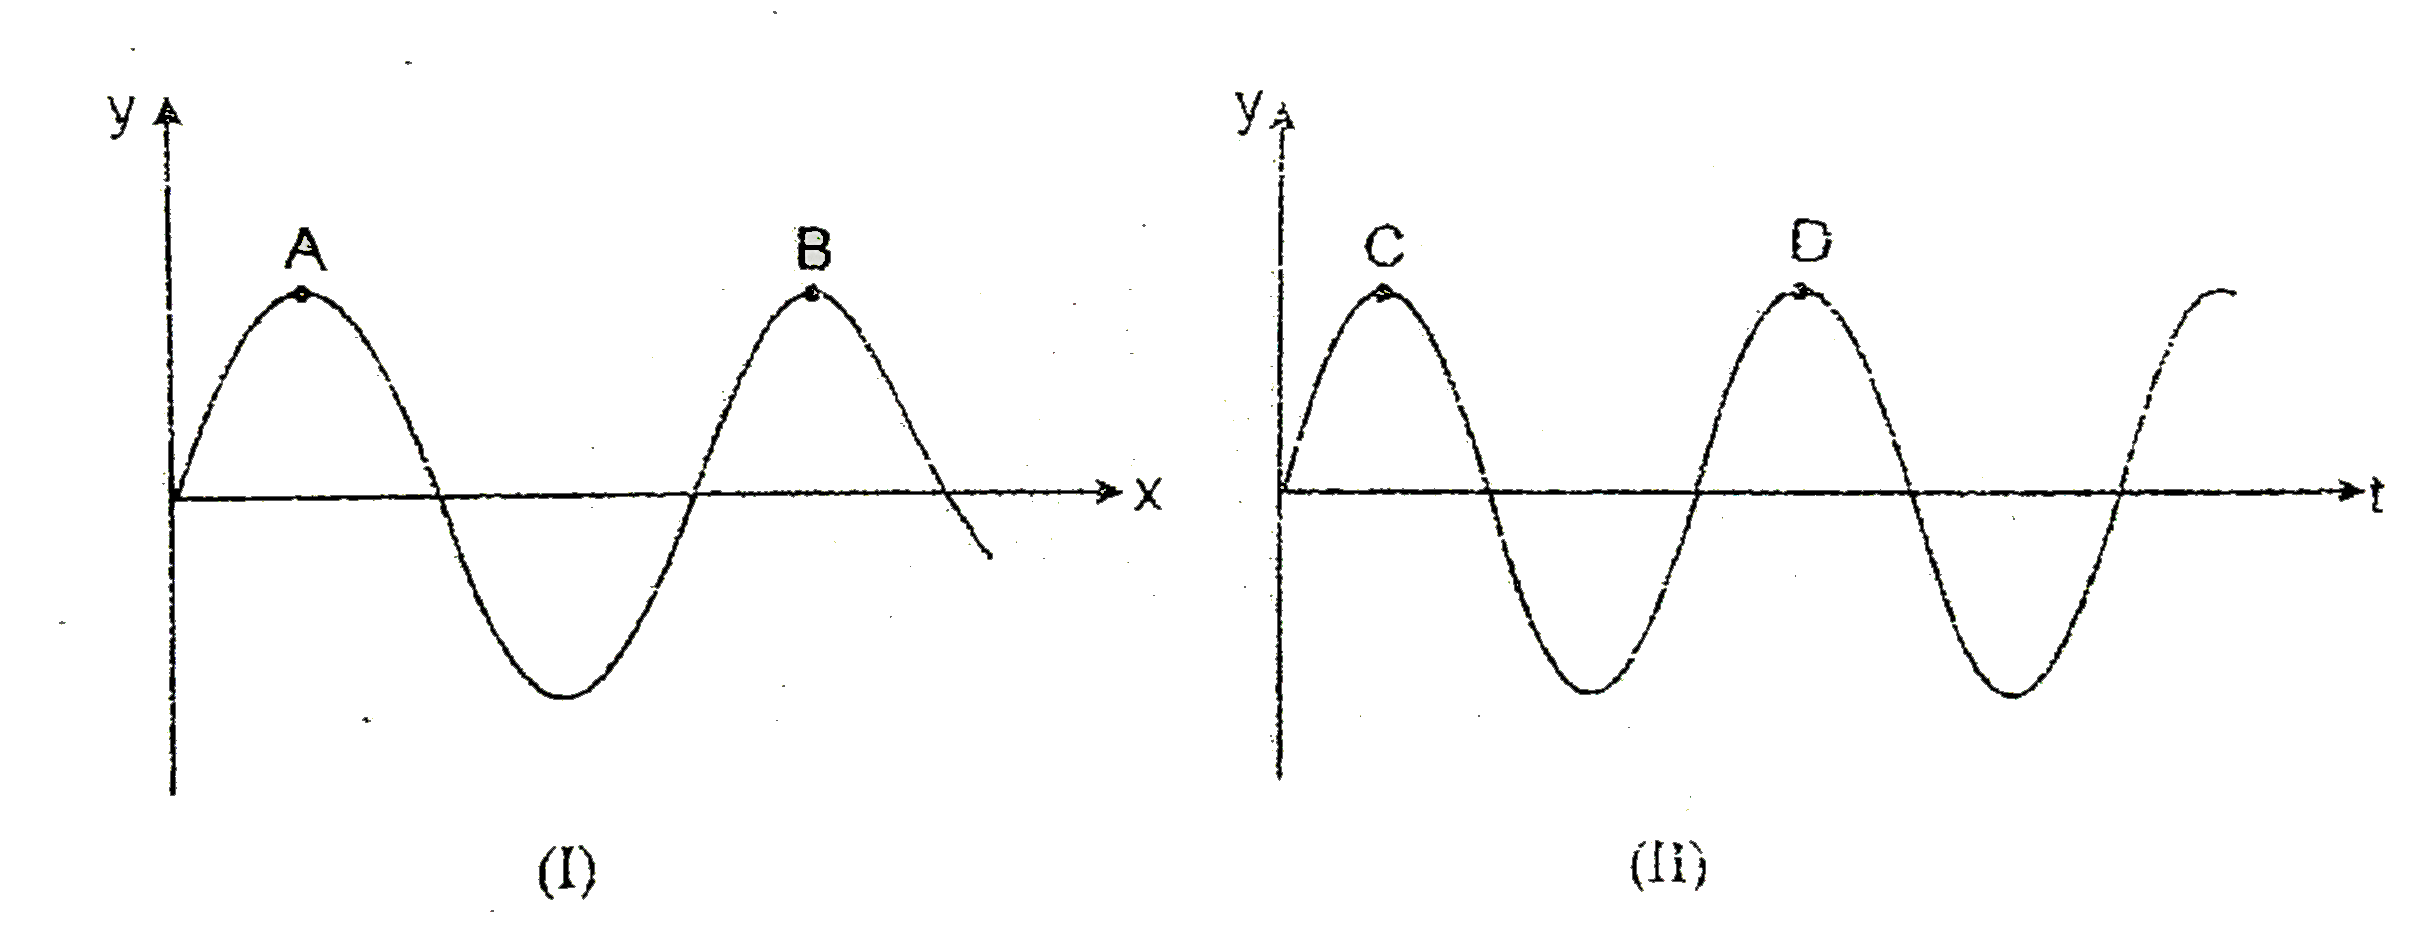
graphs of the same harmonic wave are shown below. The graph (1) on the left shows the displacement of wave y, as a function of position x for a given instant of time. The graph (2) on the right shows the displacement of wave as a function to time 't' for a given position. The speed of the wave is
View SolutionThe displacement x of a particle varies with time as x=4t2–15t+25. Find the position, velocity and acceleration of the particle at t = 0.
View Solution
Knowledge Check
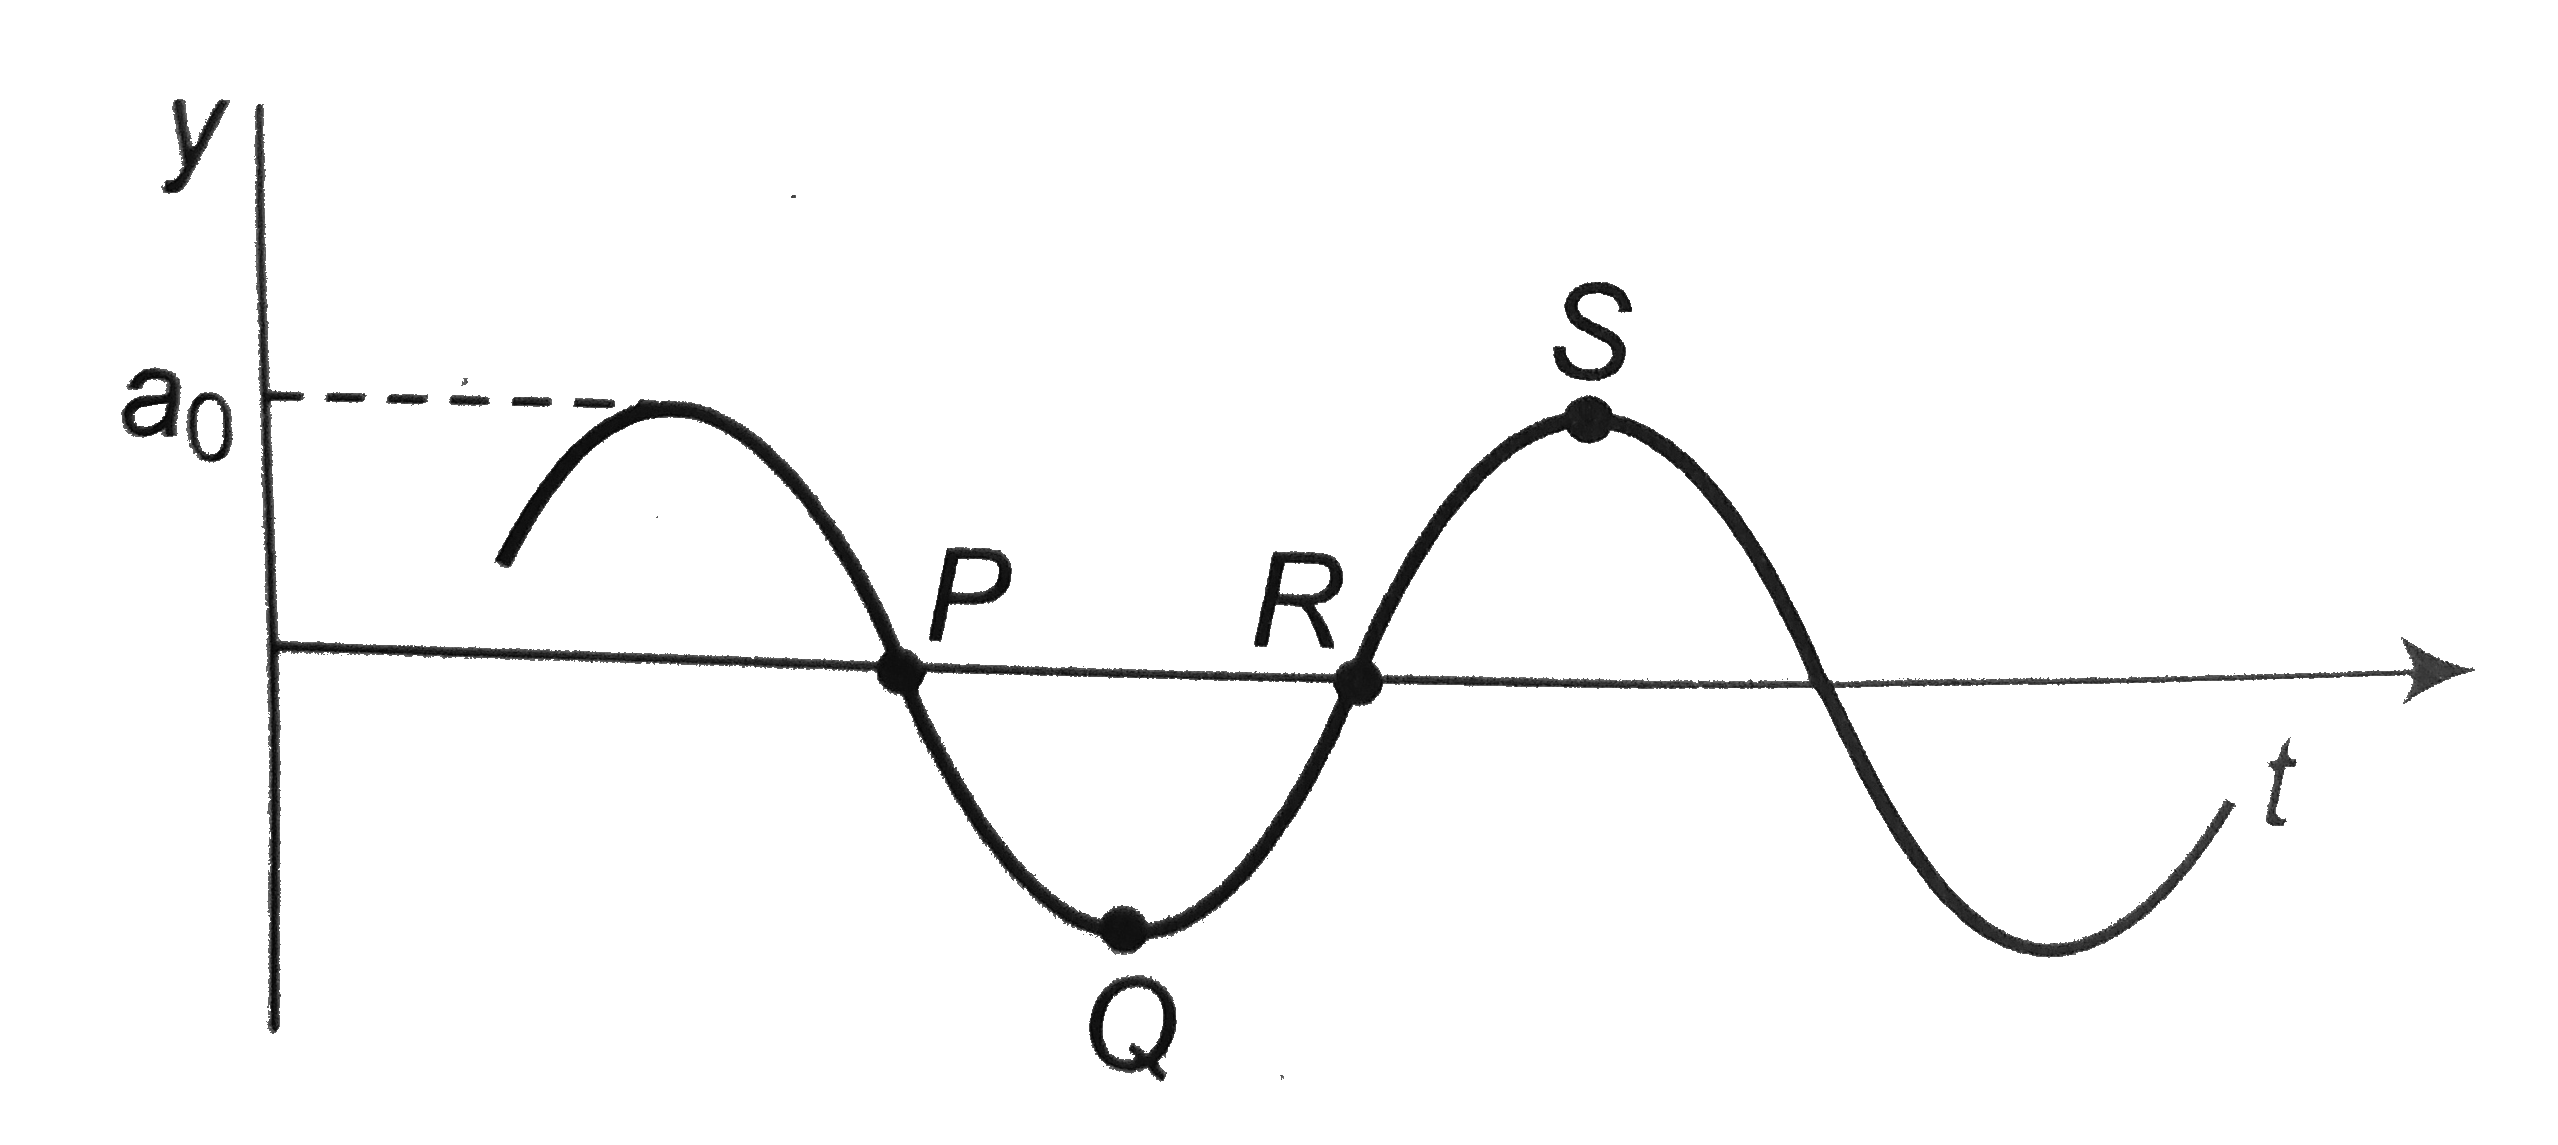
A wave motion has the function y=a0sin(ωt−kx). The graph in figure shows how the displacement y at a fixed point varies with time t. Which one of the labelled points Shows a displacement equal to that at the position x=π2k at time t=0?APBQCRDS
Figure shows the displacement tiime (x-t) graph of a body moving in a straight line which one of the graph shown in figure represents the velocity- time (v-t) graph of the motion of the body.A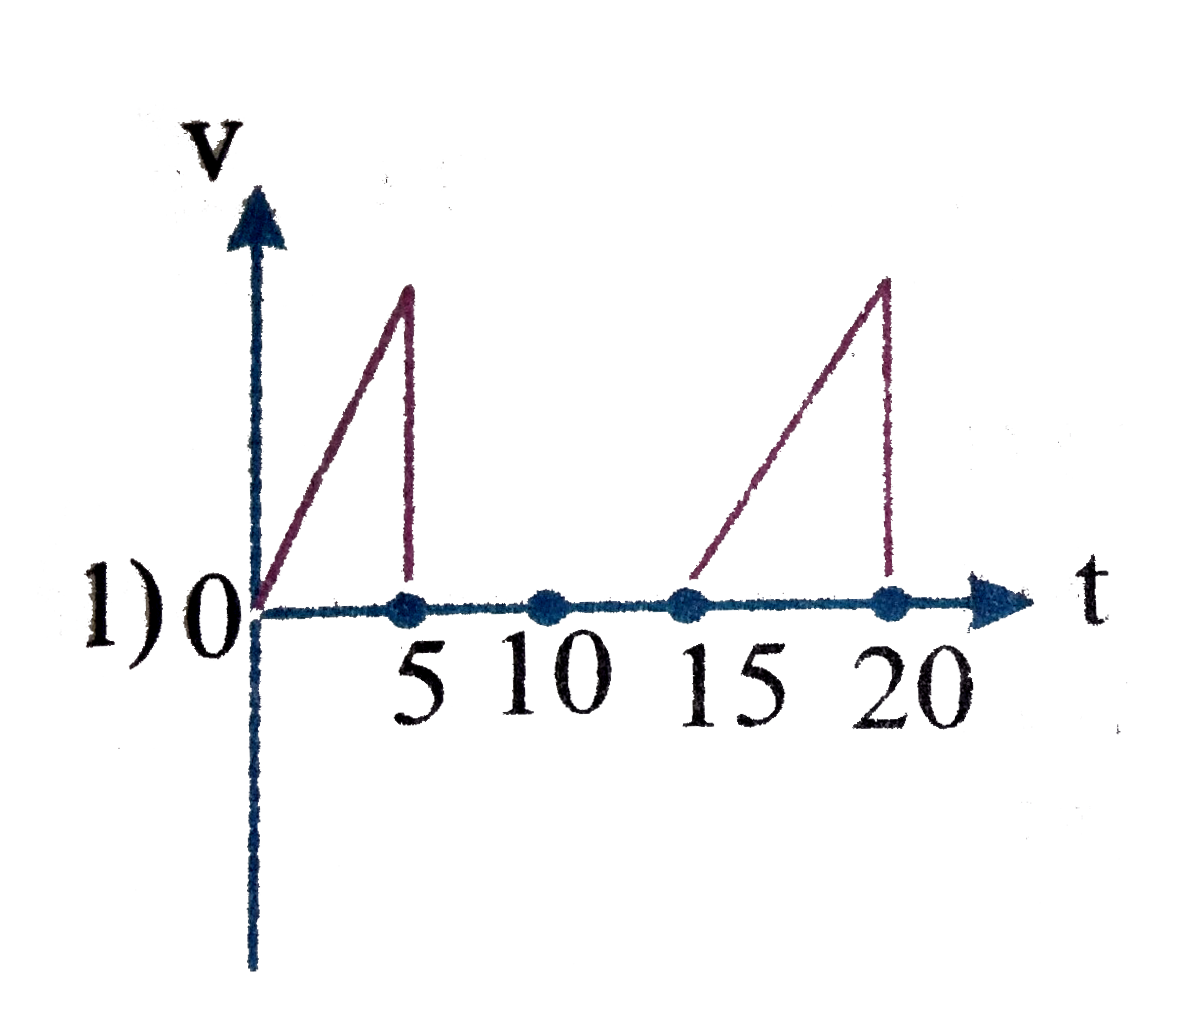 B
B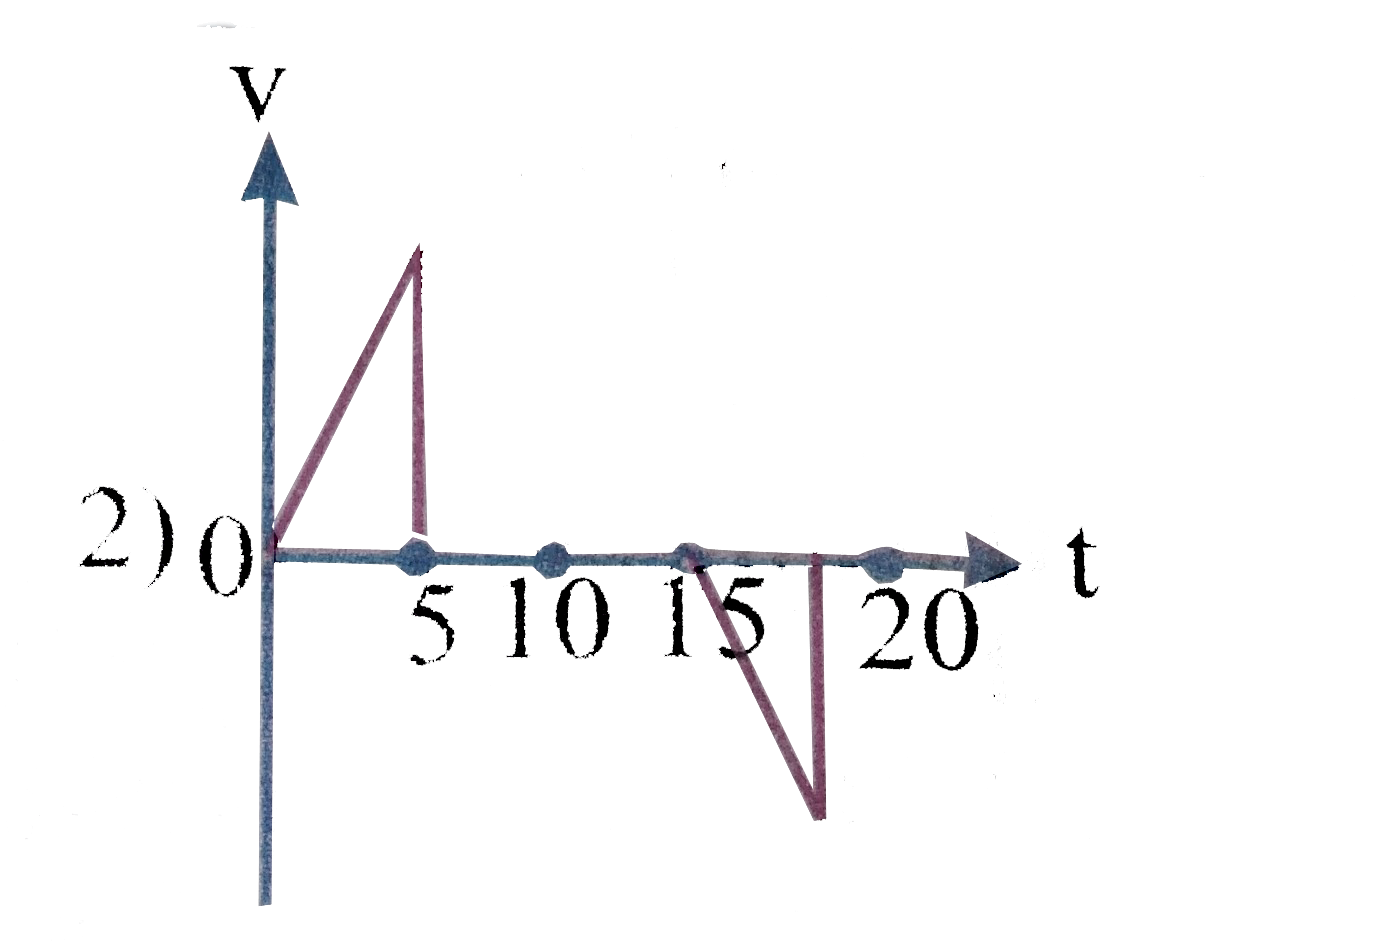 C
C D
D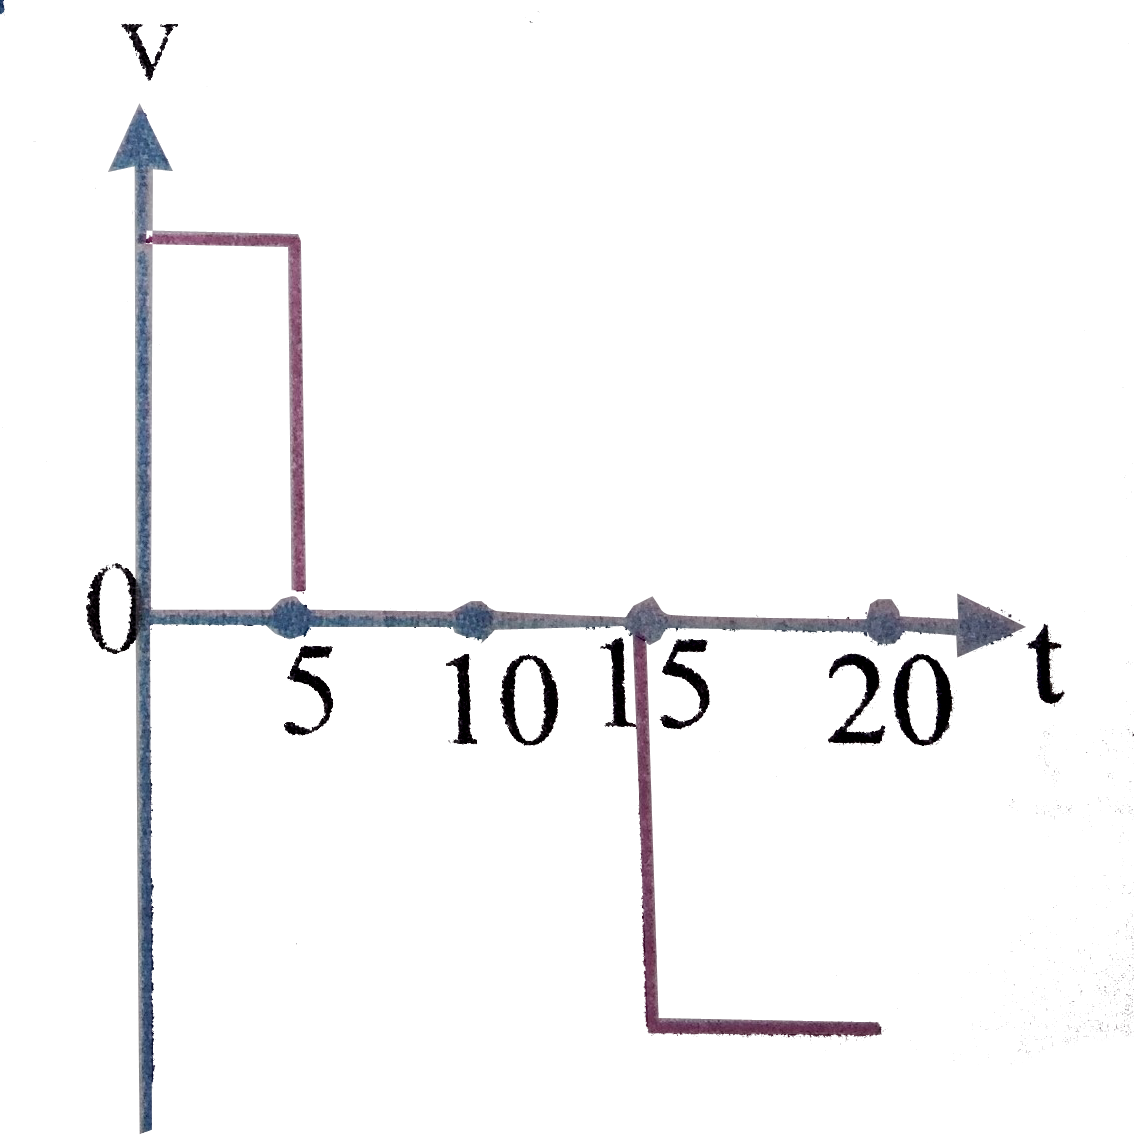
The displacement of the wave given by equation y(x,t)=asin(kx−ωt+ϕ), whereϕ=0 at point x and t = 0 is same as that at point
Ax+2nπBx+2nπkCkx+2nπDBoth (a) and (b)
The position of a particle varies with function of time as y=(4sint+3cost)m. Then the maximum displacement of the particle from origin will be
View SolutionA wave is described by y=Asin(ωt−kx). The speeds of which of the following particles in the medium are increasing at time t=0?
View SolutionThe graphs in fugure show that a quantity Y varies with displacement d in a system undergoing simple harmonic motion.
(I) ,
, 
The time
View SolutionThe same progressive wave is represented by two graphs I and II. Graph I shows how the displacement 'y' varies with the distance x along the wave at a given time. Graph I shows how y varies with time t at a given point on the wave. The ratio of measurements AB to CD, marked on the curves, represents :
View Solution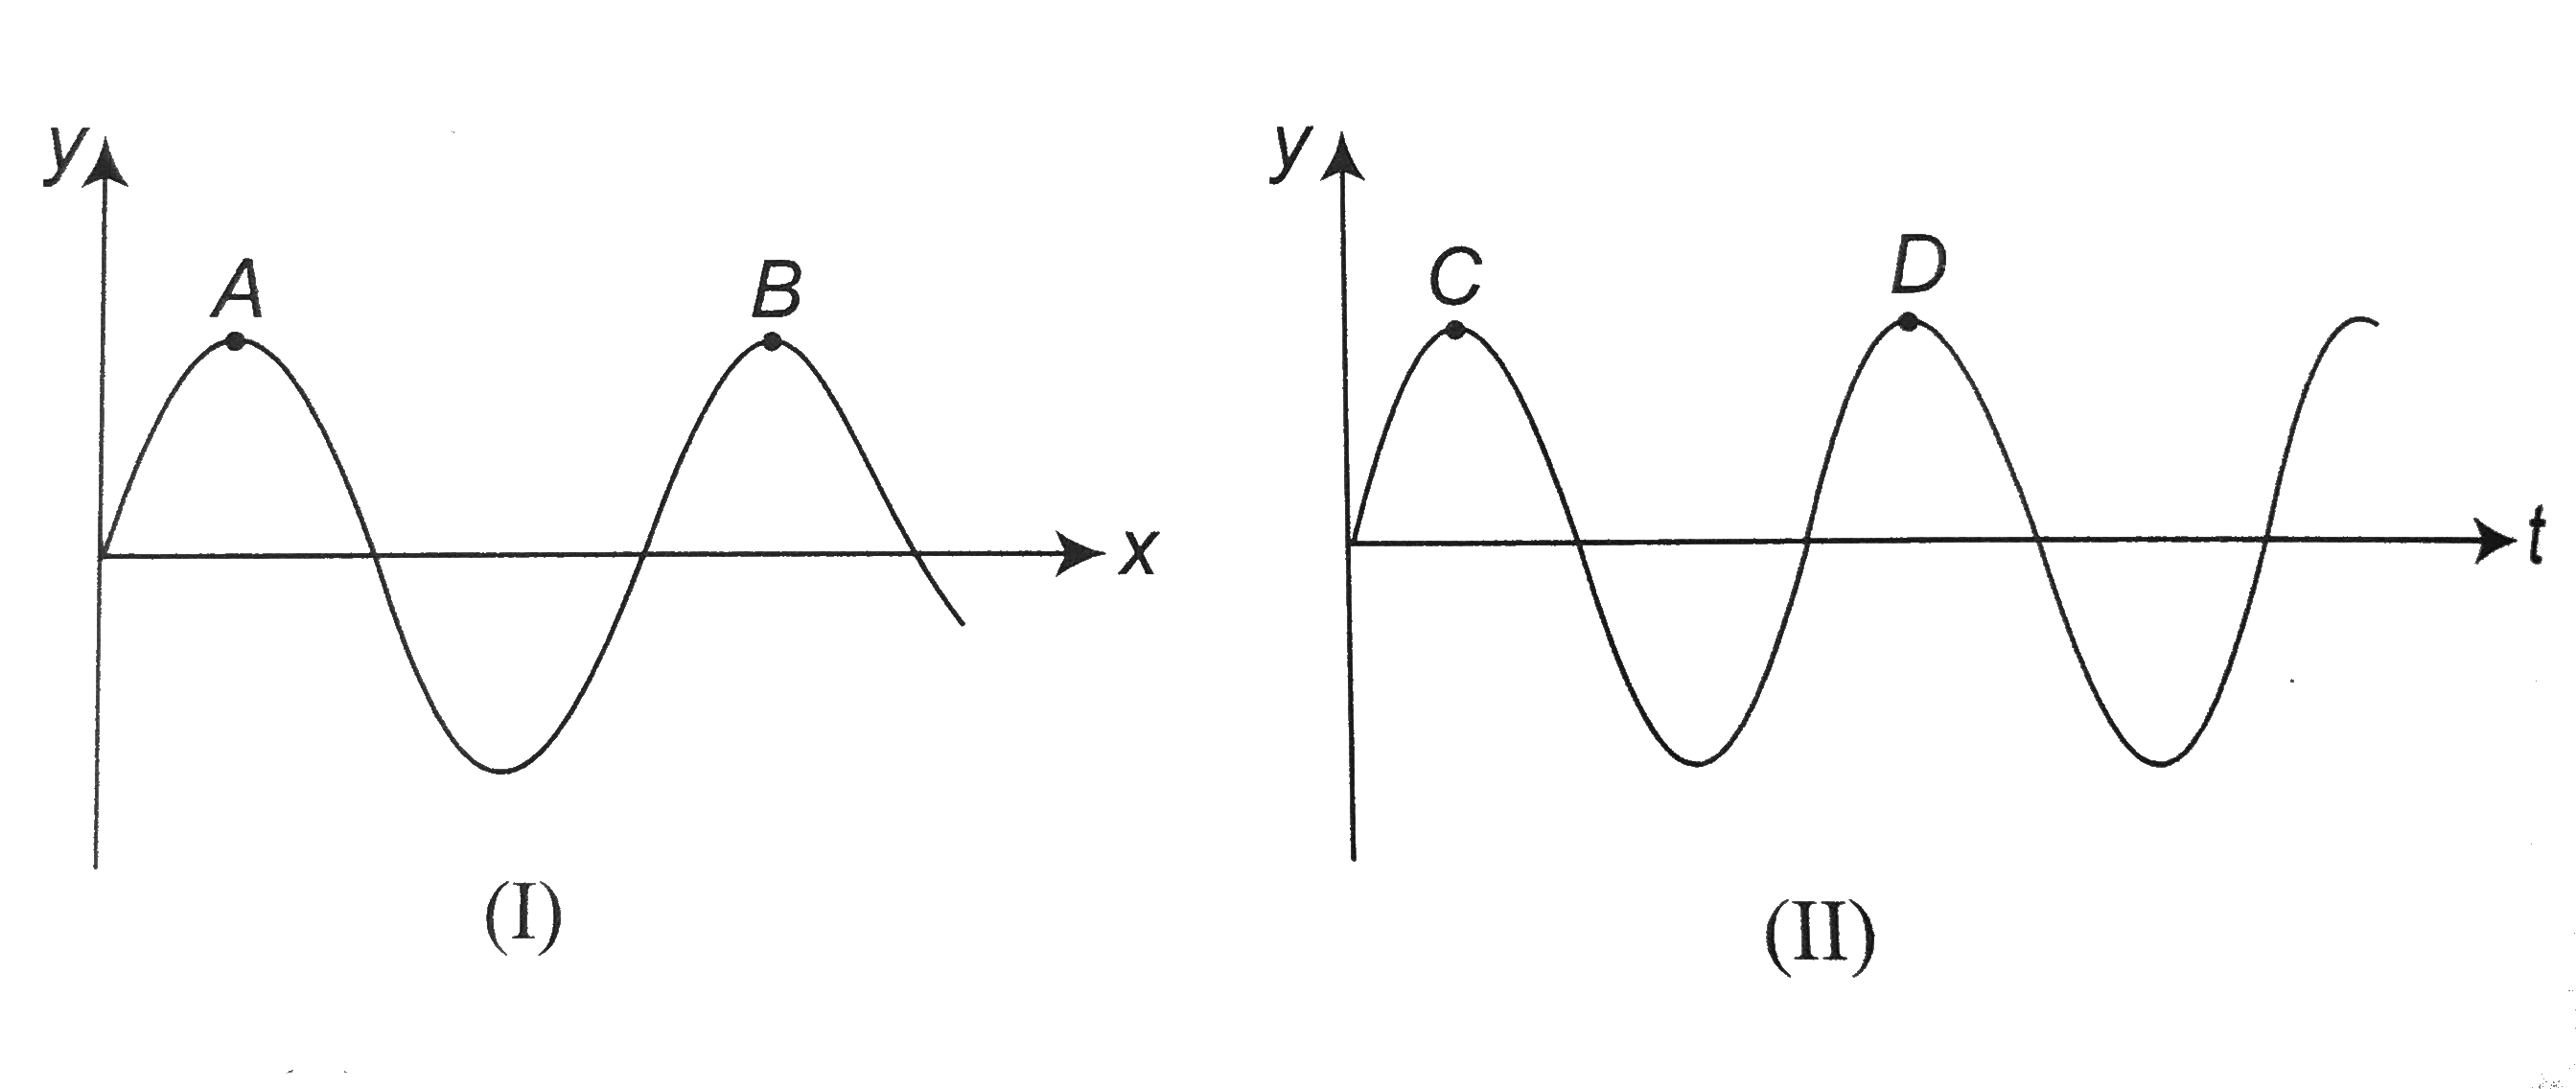
The same progressive wave is represented by two graphs I and II. Graph I shows how the displacement y varies with the distance x along the wave at a given time. Graph II shows how y varies with time t at a given point on the wave. The ratio of measurements AB to CD, marked on the curves represents:
View Solution
