Plot the graph represent the variation of electric field ∣∣→E∣∣ with distance (r )Solution in Odia
Step by step video & image solution for Plot the graph represent the variation of electric field |vecE| with distance (r ) by Physics experts to help you in doubts & scoring excellent marks in Class 12 exams.
Updated on:21/07/2023Similar Questions
Electric field intensity is ∣∣→E∣∣ at a distance r from an isolated point charge. Then
View SolutionThe electric field intensity ∣∣→E∣∣ at a distance 'r' from the centre of the dipole is
View SolutionThe electric field intensity is |vecE| at a distance x meter from the centre of the sphere of radius r. If x < r then |vecE|
View SolutionIf r is distance measured from centre of a charged shell and R is its radius, then the graph which may correctly represent variation of electric field (E) is
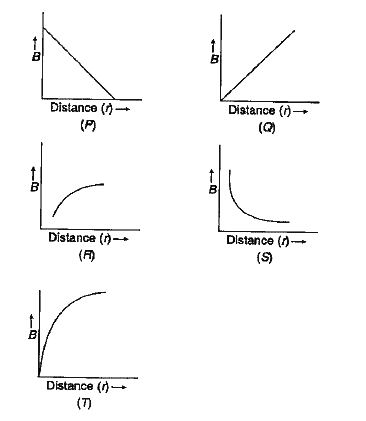
View SolutionWhich of the following graphs represent variation of magnetic field B with distance r for a straight long wire carrying current ?

View SolutionWhich one of the following graphs represents the variation of electric field with distance r from the centre of a charge spherical conductor of radius R?
View SolutionWhich one of t he following plots represents the variation of gravitational field of a particle with distance r due to thin spherical shell of radius R ?
View Solution
