If r is distance measured from centre of a charged shell and R is its radius, then the graph which may correctly represent variation of electric field (E) is


To solve the problem of determining the variation of the electric field (E) with respect to the distance (r) from the center of a charged shell, we will follow these steps:
Step 1: Understand the Electric Field Inside the Shell
For a uniformly charged shell, the electric field inside the shell (i.e., for distances r<R, where R is the radius of the shell) is zero. Therefore, we can state:
E=0for0≤r<R
Step 2: Understand the Electric Field Outside the Shell
For points outside the shell (i.e., for distances r≥R), we can use Gauss's law. The electric field at a distance r from the center of the shell can be expressed as:
E=q4πϵ0r2
where q is the total charge on the shell, and ϵ0 is the permittivity of free space.
Step 3: Analyze the Behavior of the Electric Field
From the equation derived in Step 2, we see that the electric field decreases with the square of the distance from the center of the shell. As r increases, E approaches zero.
Step 4: Graph the Variation of Electric Field
Based on the analysis:
- For 0≤r<R, E=0.
- For r=R, E will have a maximum value of q4πϵ0R2.
- For r>R, E decreases as 1r2.
Thus, the graph of E versus r will be:
- A flat line at E=0 from r=0 to r=R.
- A curve starting from E=q4πϵ0R2 at r=R and decreasing towards zero as r increases.
Conclusion
The correct graph representing the variation of the electric field E with respect to the distance r from the center of the charged shell is one that shows E=0 for r<R and a decreasing curve for r≥R.
For a uniformly charged shell, the electric field inside the shell (i.e., for distances r<R, where R is the radius of the shell) is zero. Therefore, we can state:
E=0for0≤r<R
For points outside the shell (i.e., for distances r≥R), we can use Gauss's law. The electric field at a distance r from the center of the shell can be expressed as:
E=q4πϵ0r2
where q is the total charge on the shell, and ϵ0 is the permittivity of free space.
From the equation derived in Step 2, we see that the electric field decreases with the square of the distance from the center of the shell. As r increases, E approaches zero.
Based on the analysis:
- For 0≤r<R, E=0.
- For r=R, E will have a maximum value of q4πϵ0R2.
- For r>R, E decreases as 1r2.
- A flat line at E=0 from r=0 to r=R.
- A curve starting from E=q4πϵ0R2 at r=R and decreasing towards zero as r increases.
The correct graph representing the variation of the electric field E with respect to the distance r from the center of the charged shell is one that shows E=0 for r<R and a decreasing curve for r≥R.
Similar Questions
A metallic spherical shell of radius R has a charge -Q on it. A point charge +Q is placed at the centre of the shell. Which of the graphs shown below may correctly represent the variation of electric field E with distance r from the centre of shell ?
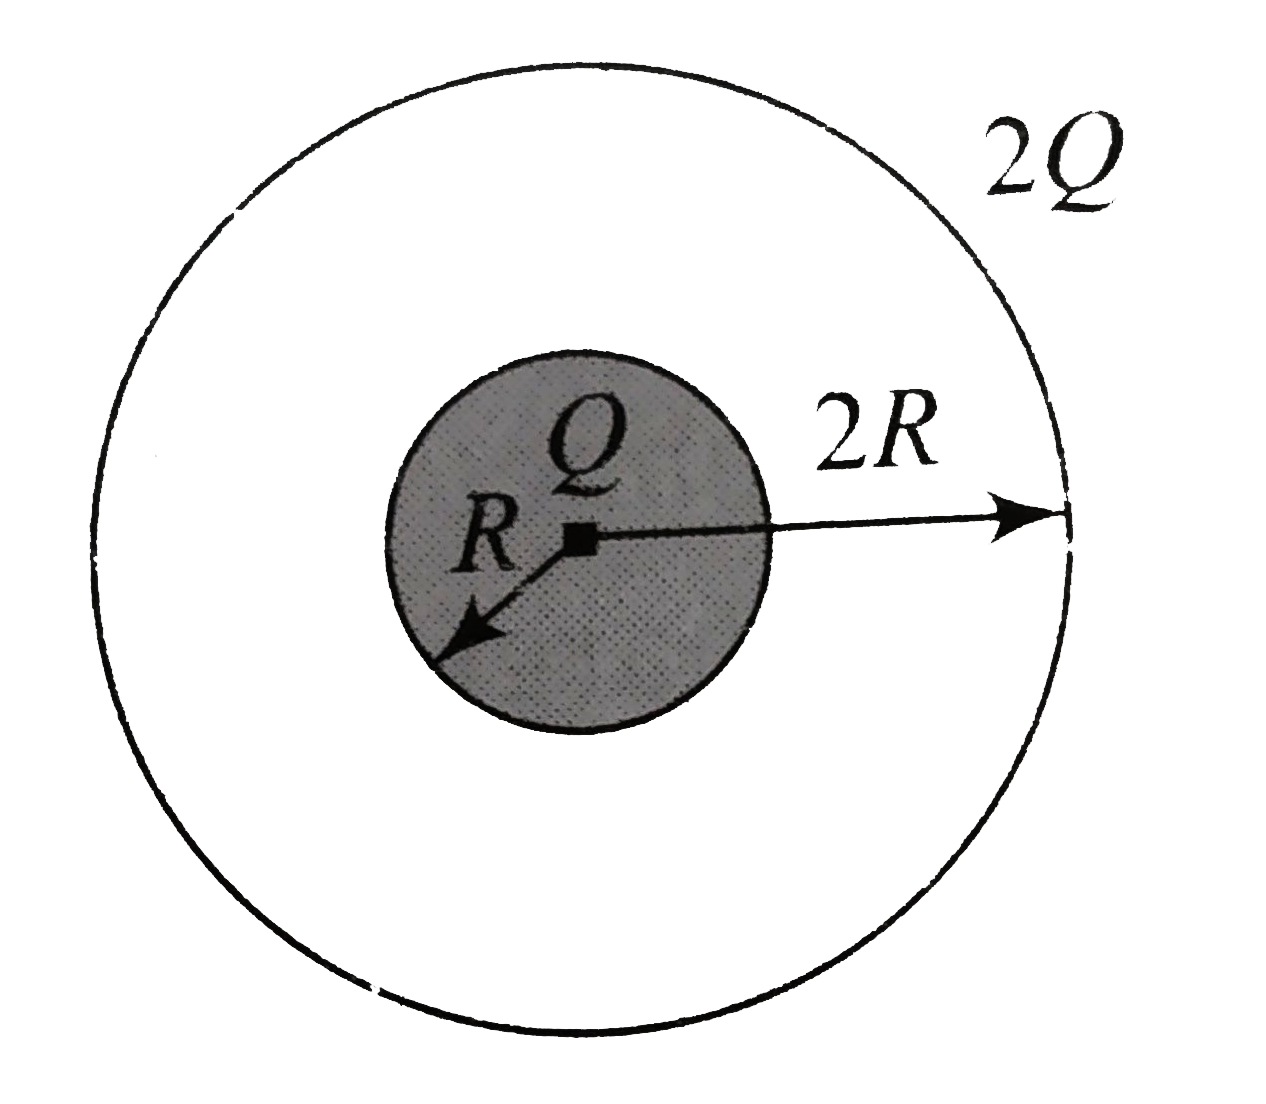
View SolutionA charge Q is uniformly distributed in a dielectric sphere of radius R (having dielectric constant unity). This dielectric sphere is enclosed by a concentric spherical shell of radius 2R and having uniformly distributed charge 2Q. Which of the following graph correctly represents variation of electric field with distance r from the common centre?
 View Solution
Knowledge Check
- Question 1 - Select One
A spherical insulator of radius R is charged uniformly with a charge Q throughout its volume and contains a point charge Q16 located at its centre. Which of the following graphs best represents qualitatively, the variation of electric field intensity E with distance r from the centre?
A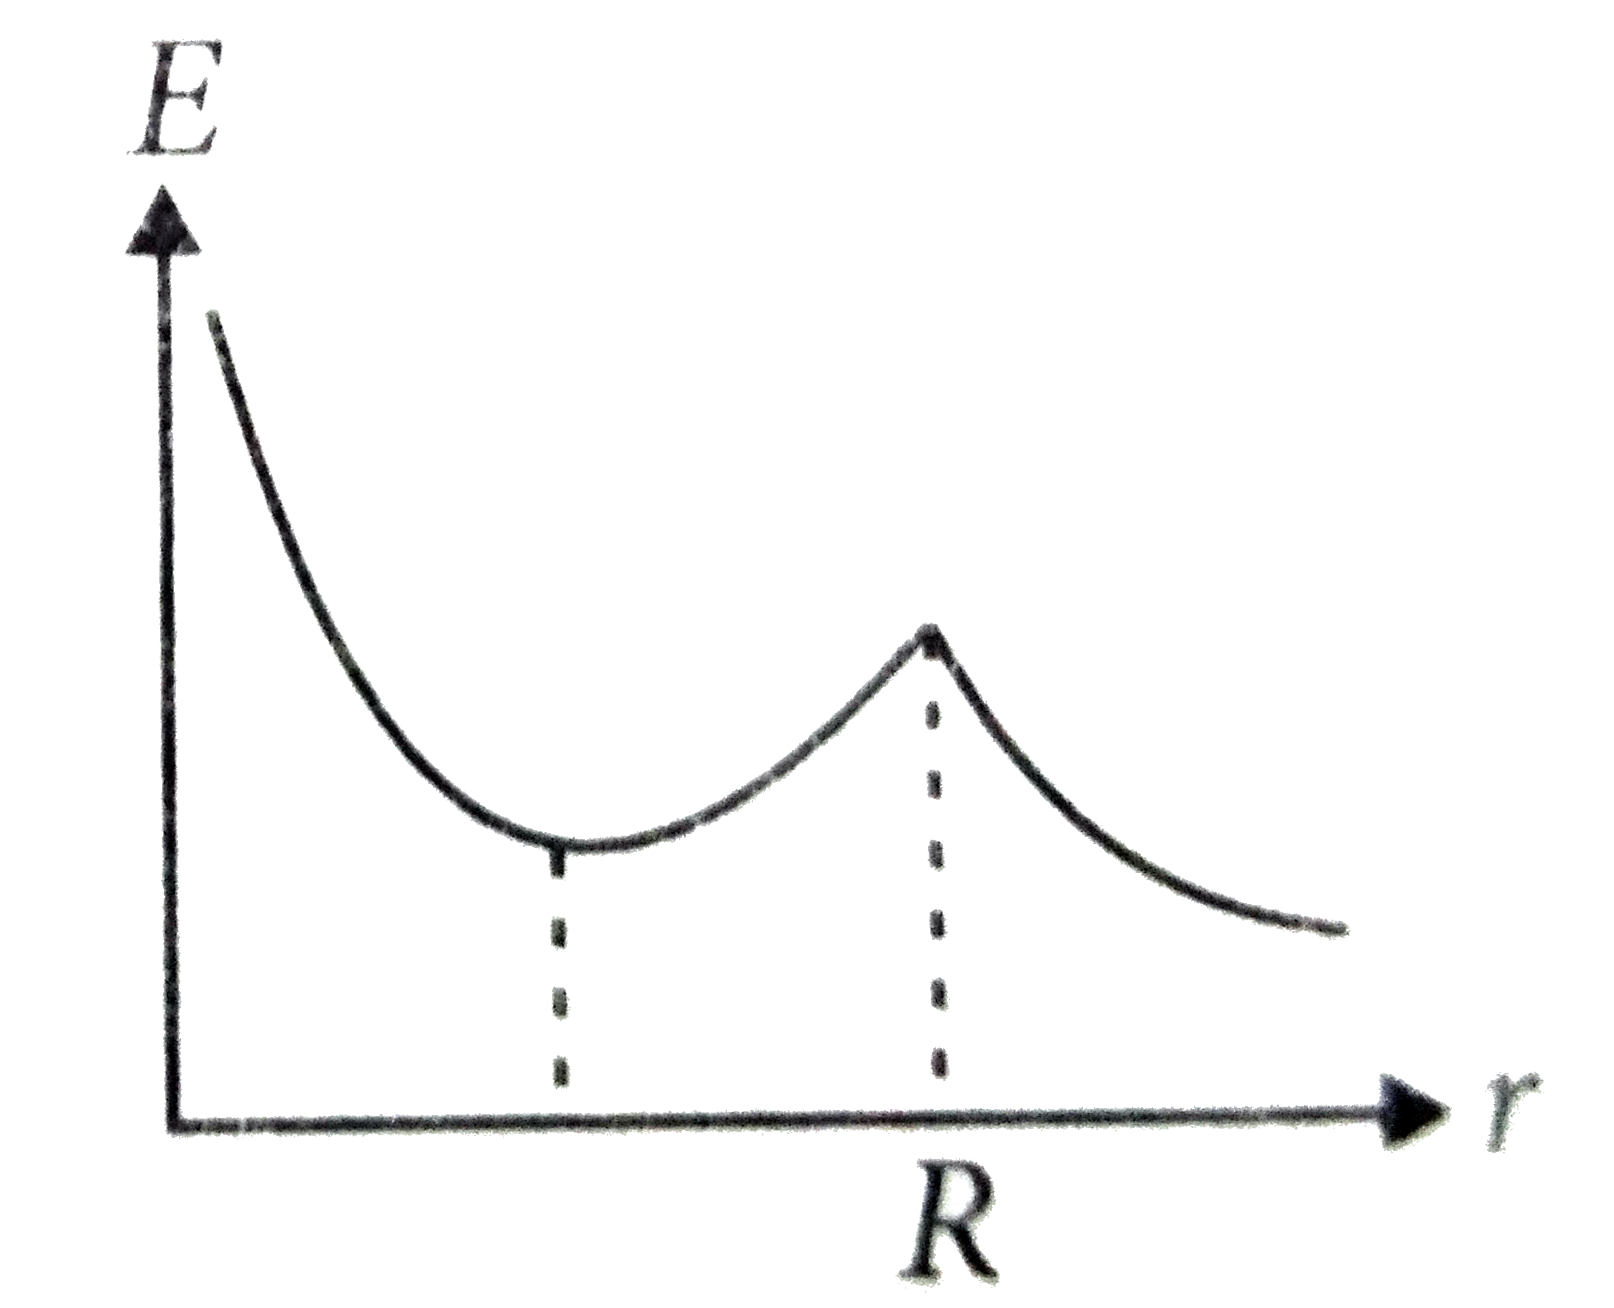 B
B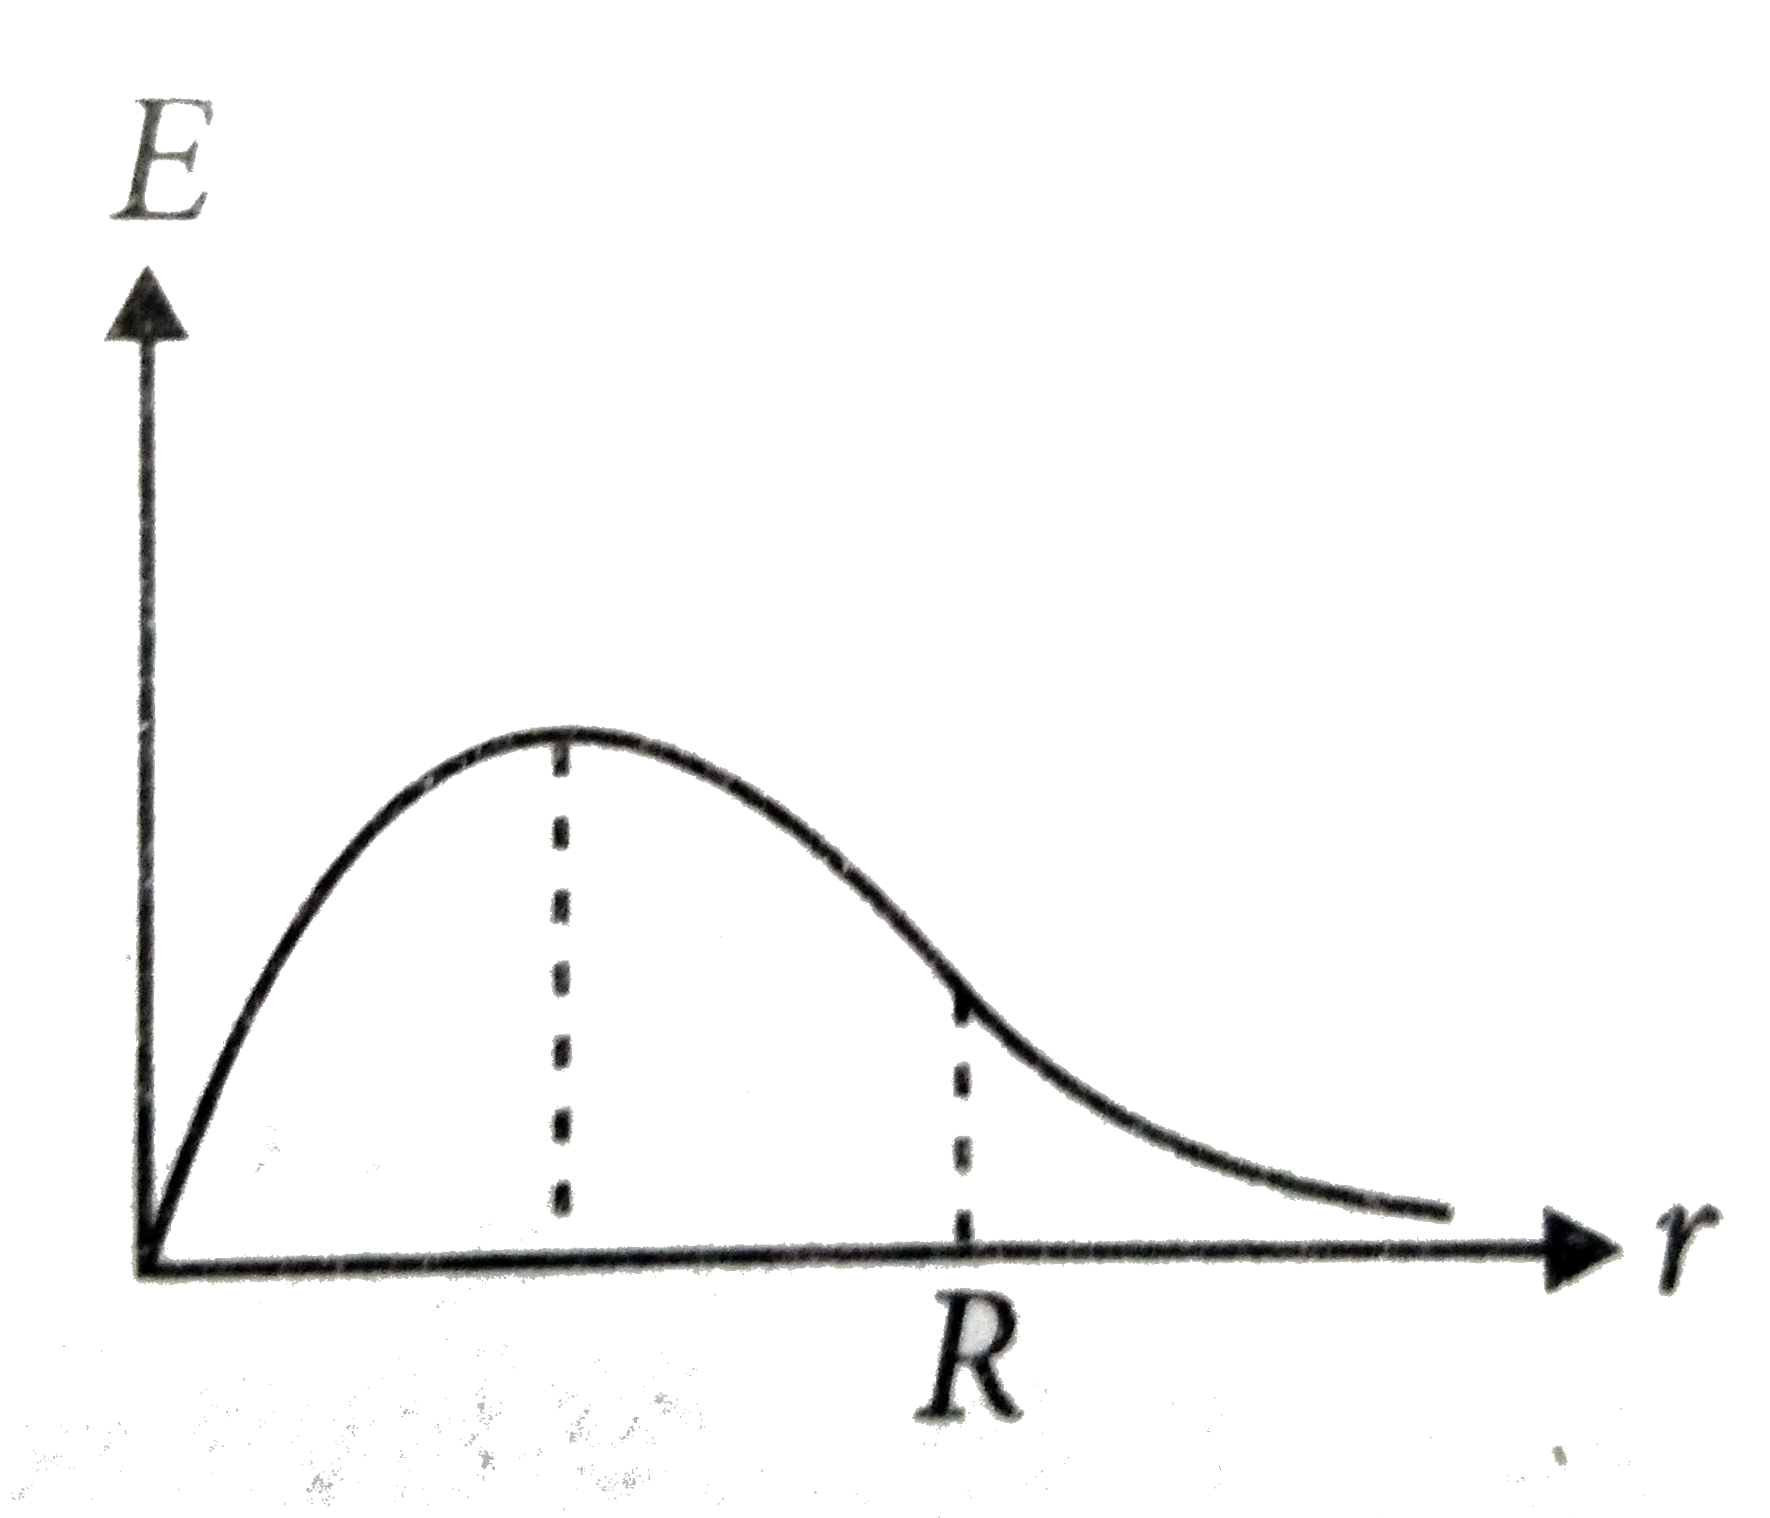 C
C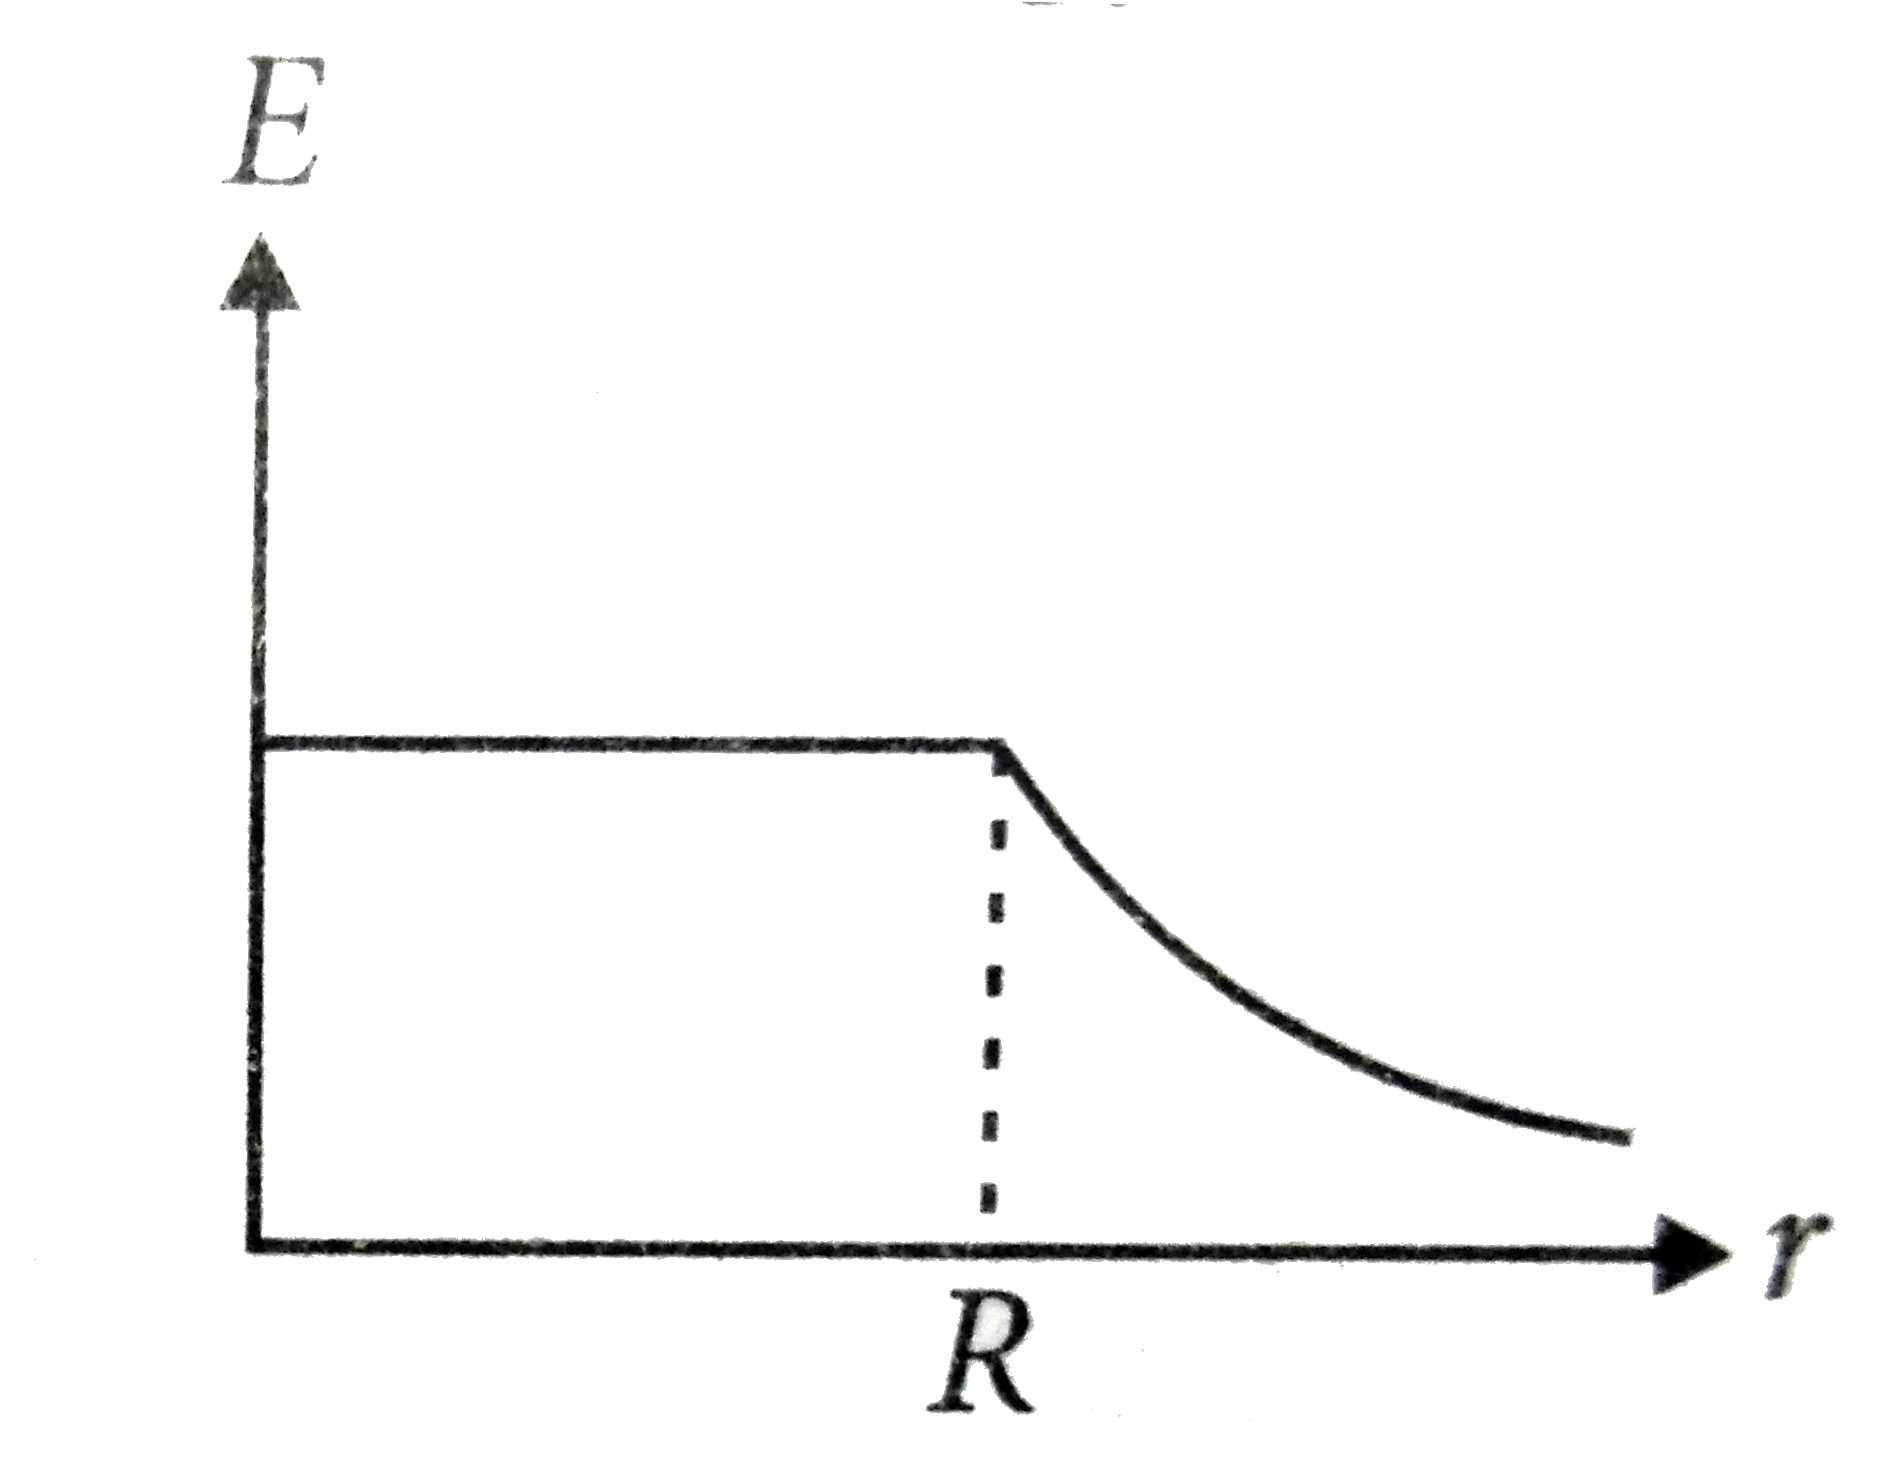 D
D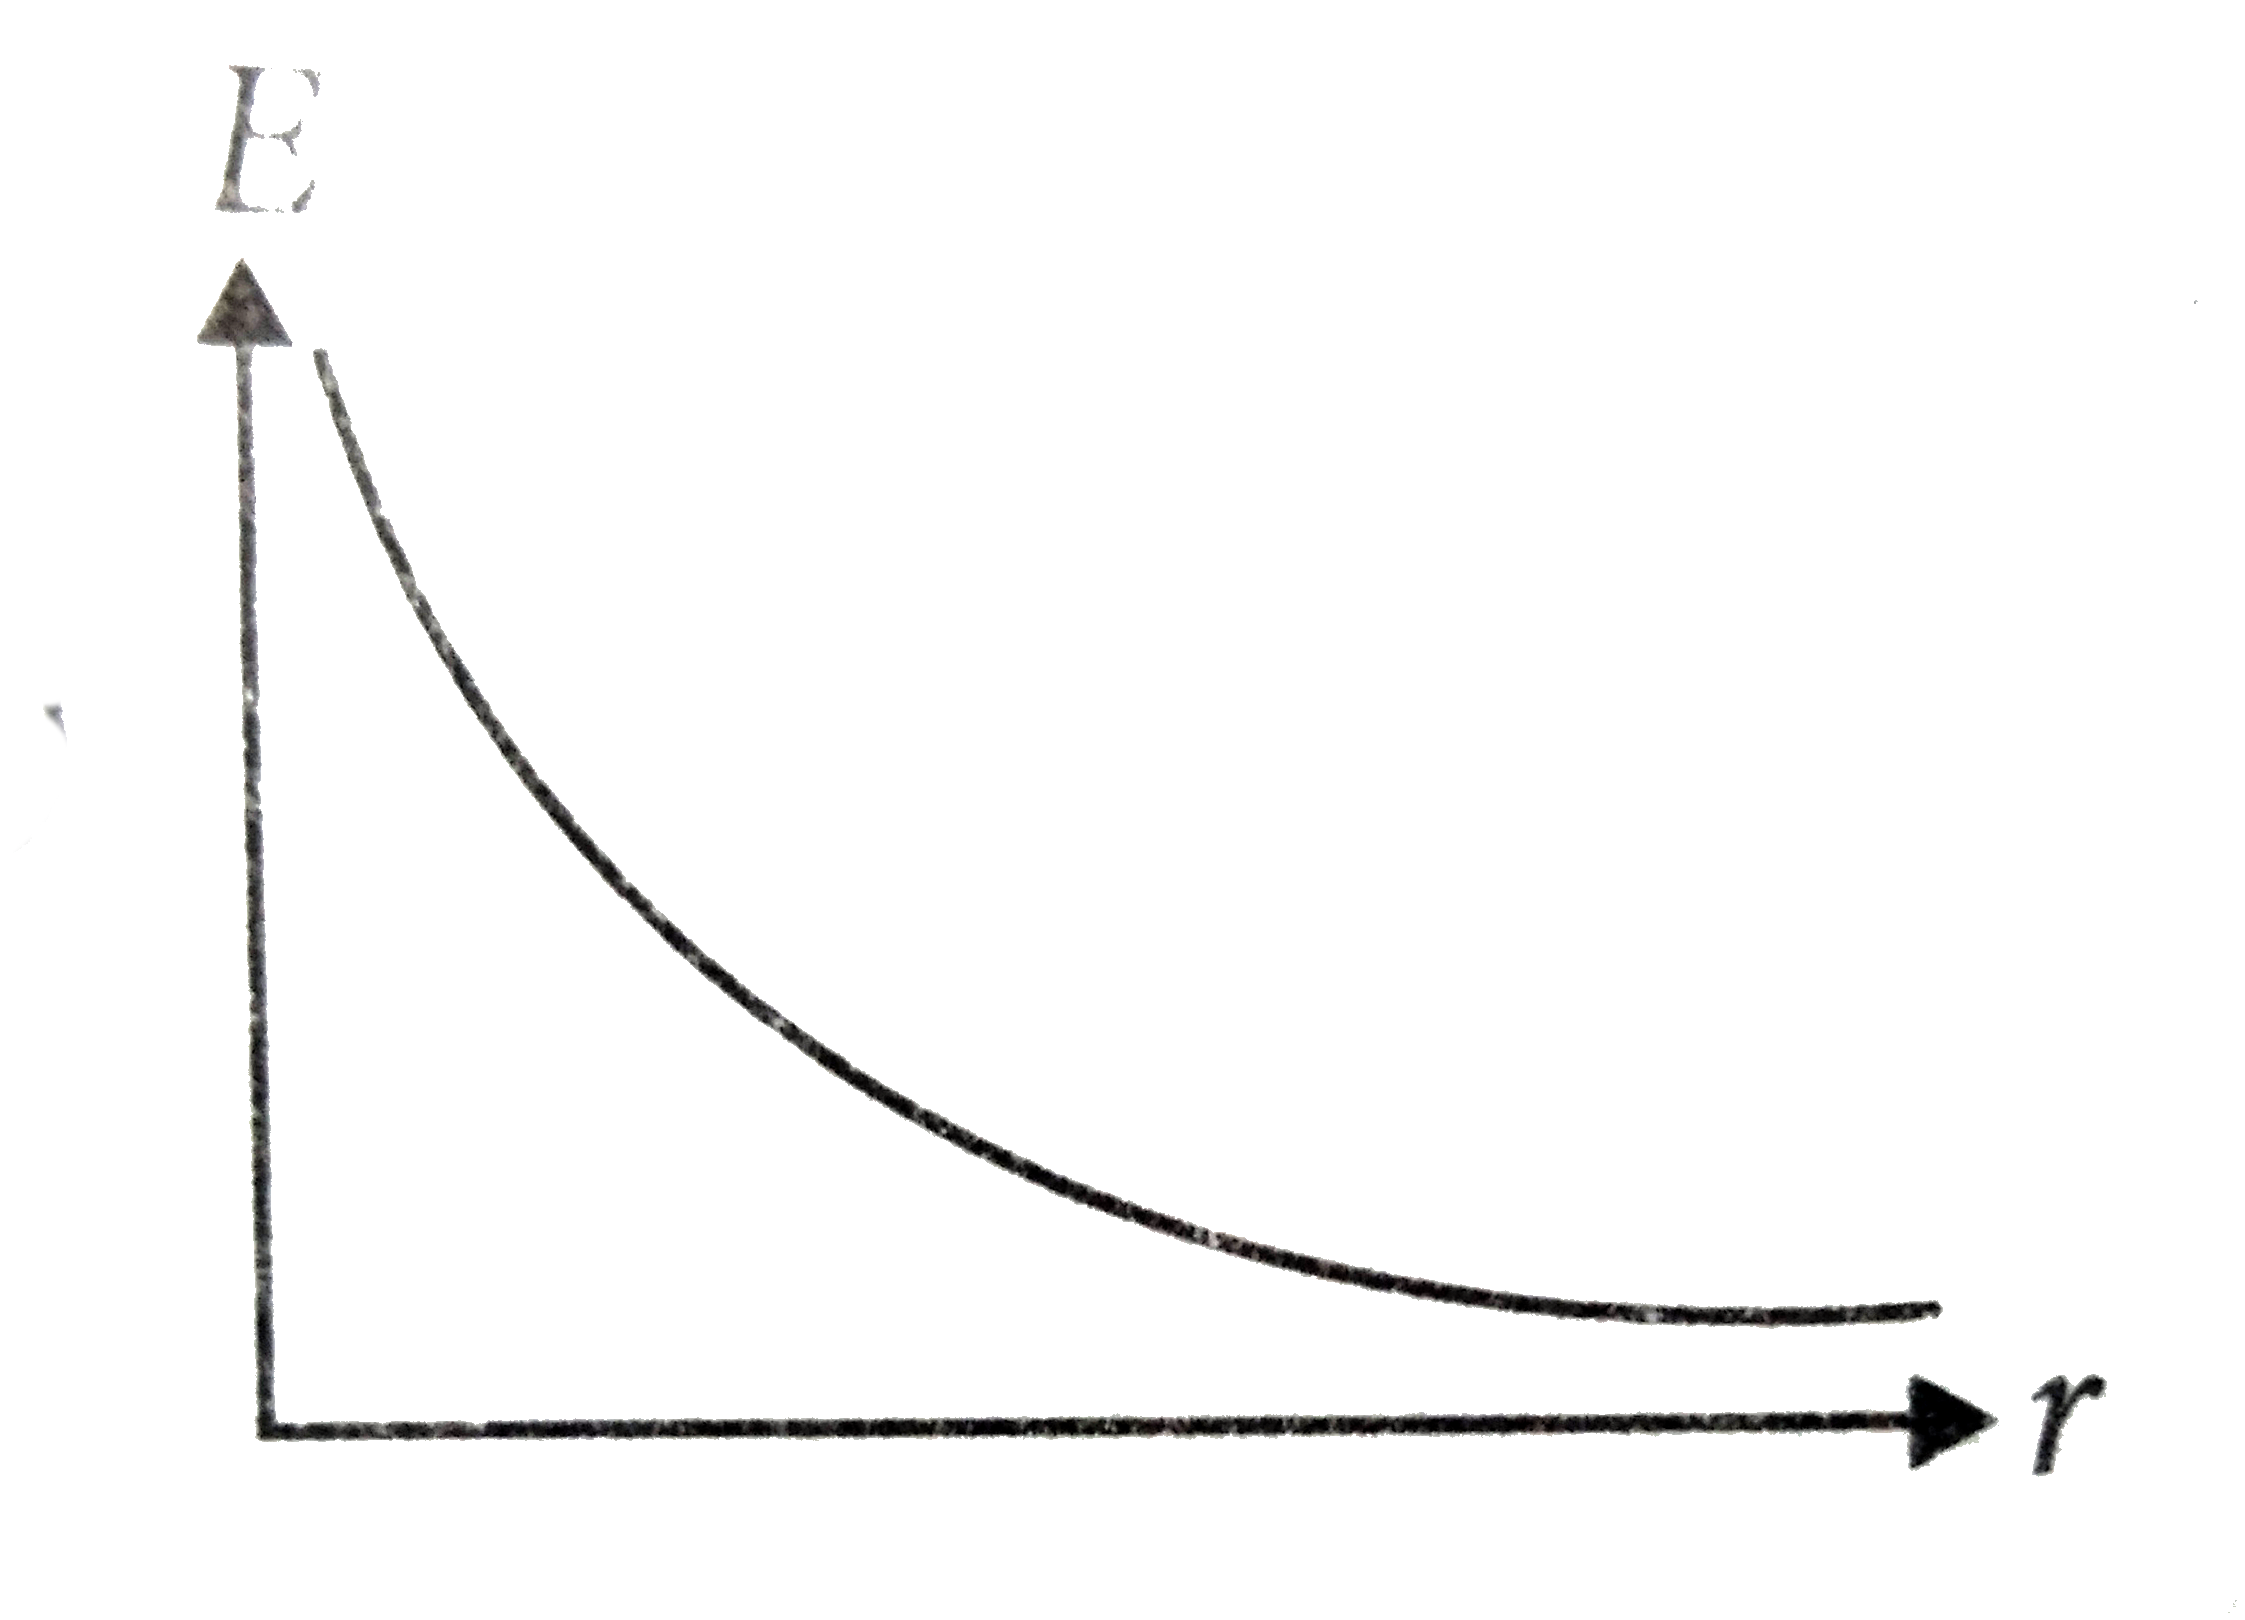
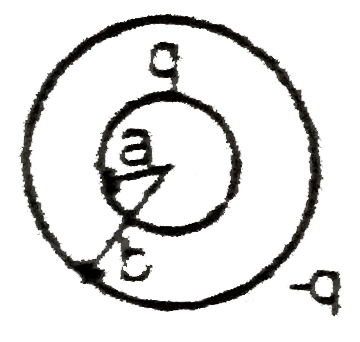
Figure shows two concentric shells of radii a and b uniformly distributed charges q and -q. Which of the following graphs gives correct variation of electric field intensity E with the distance r from the centre?
 View Solution
Using Gauss's law obtain the expression for the electric field due to uniformly charged thin spherical shell of radius R at a point outside the shell. Draw a graph showing the variation of electric tield with r, for r gt R and r lt R.
View SolutionUsing Gauss's law obtain the expression for the electric field due to uniformly charged thin spherical shell of radius R at a point outside the shell. Draw a graph showing the variation of electric tield with r, for r gt R and r lt R.
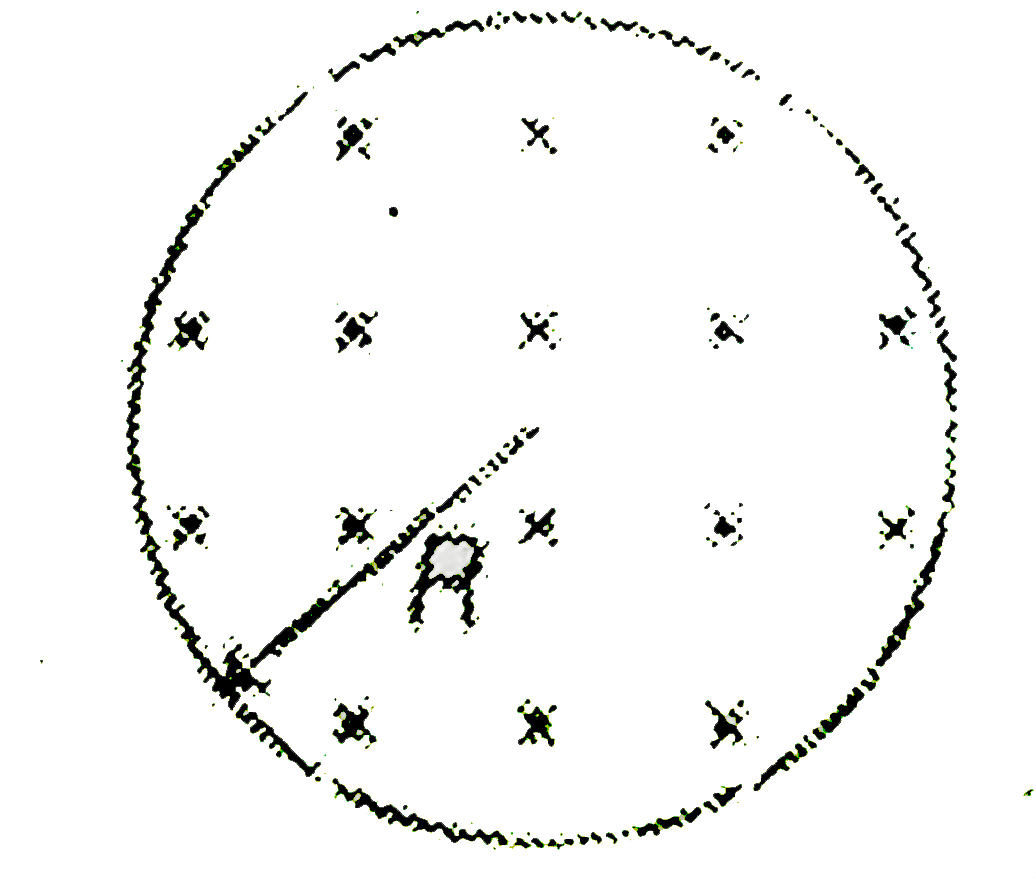
View SolutionA cylindrical space of radius R is filled with a uniform magnetic induction parallel to the axis of the cylinder. If B charges at a constant rate, the graph showin the variation of induced electric field with distance r from the axis of cylinder is
 View Solution
A point charge q is placed at a distance of r from the centre O of an uncharged spherical shell of inner radius R and outer radius 2R.The distance r<R.The electric potential at the centre of the shell will be
 View Solution
A point charge q is placed at a distance of r from the centre O of an uncharged spherical shell of inner radius R and outer radius 2R. The electric potential at the centre of the shell will be
 View Solution
Using Gauss' law deduce the expression for the electric field due to a uniformly charged sperical conducting shell of radius R at a point (i) outside and (ii) inside the shell.
Plot a graph showing variation of electric field as a function of r>Randr<R. (r being the distance from the centre of the shell)View Solution

