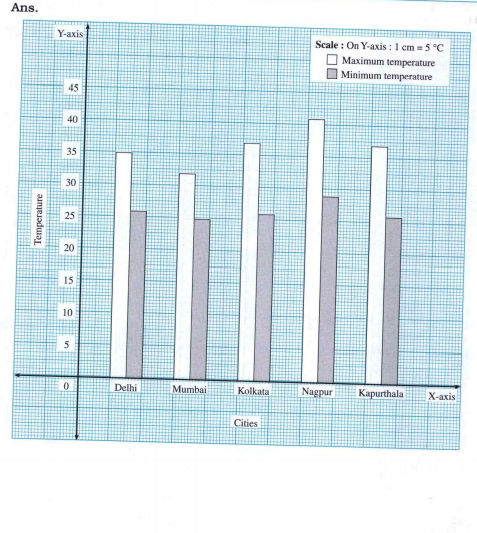
The maximum and minimum temperatures of five Indian cities are given in the box. Draw a joint bar graph for this data.

Topper's Solved these Questions
Similar Questions
Take the data giving the minimum and the maximum temperature of various cities given in the table.
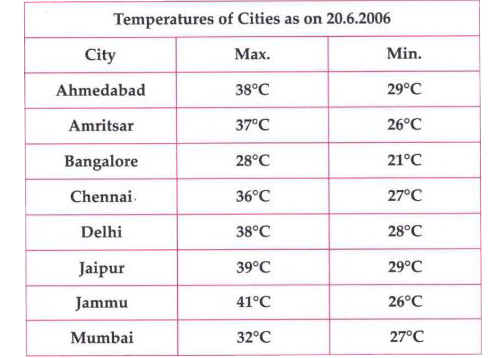
Which city has the largest difference in the minimum and maximum temperature on the given date ?
View SolutionTake the data giving the minimum and the maximum temperature of various cities given in the table.
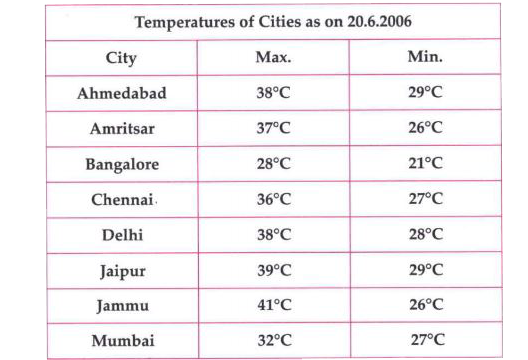
Which is the hottest city and which is the coldest city ?
View SolutionTake the data giving the minimum and the maximum temperature of various cities given in the table.
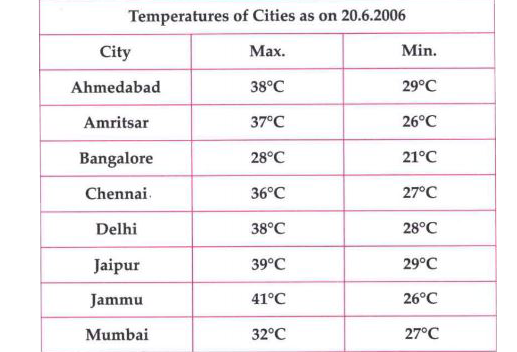
Name two cities where maximum temperature of one was less than the minimum temperature of the other
View SolutionTake the data giving the minimum and the maximum temperature of various cities given in the table.
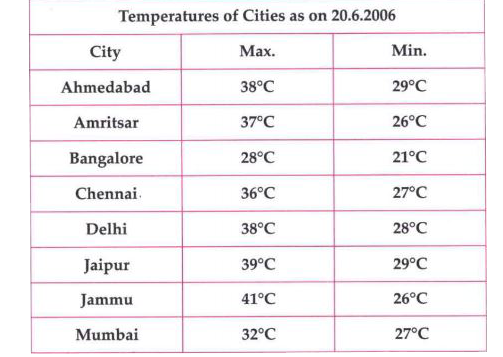
Name the city which has the least difference between its minimum and the maximum temperature
View SolutionDraw a bar graph from the following data:

View SolutionThe daily maximum and minimum temperature of a city during one week in the month a April is given below. Construct a double bar graph using this data

View SolutionThe names of the heads of some families in village and the quantity of drinking water their family consumes in one day are given below. Draw a bar graph for this data :

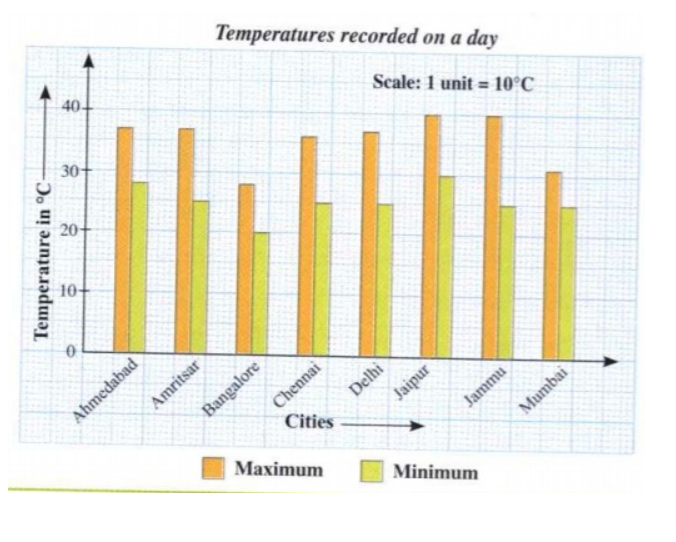
View SolutionThe following graph gives the minimum and maximum temperatures of various cities on a specific day. Read the graph and answer the following questions
Which city has the largest difference between the minimum and the maximum temperatures on the given day?
View SolutionThe following graph gives the minimum and maximum temperatures of various cities on a specific day. Read the graph and answer the following questions
Name the city which has the minimum difference between its minimum and maximum temperatures.

View SolutionThe following graph gives the minimum and maximum temperatures of various cities on a specific day. Read the graph and answer the following questions
Name the two cities where the maximum temperature of one city was less than the minimum temperature of the other city.

View Solution
