The names of the heads of some families in village and the quantity of drinking water their family consumes in one day are given below. Draw a bar graph for this data :

Step by step video & image solution for The names of the heads of some families in village and the quantity of drinking water their family consumes in one day are given below. Draw a bar graph for this data : by Maths experts to help you in doubts & scoring excellent marks in Class 6 exams.
Topper's Solved these Questions
Similar Questions
The approximate speeds of some objects are given below. Draw a bar graph to represent them:

View SolutionThe expenditure of a family of different heads in a month is given below

Draw a bar graph to represent the data above.View SolutionThe income of a family i different year are as follows. Draw a bar graph to represent the data
View SolutionThe ages (in years) of 360 patients treated in a hospital on a particular day are given below:

Draw a histogram for the given data.View SolutionThe runs scored by a cricket team in first 10 overs are given below:

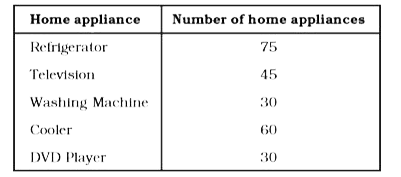
Draw a line graph representing the above data.View SolutionHome appliances sold by a shop in one month are given as below:

Draw a bar graph to represent the above information.View SolutionThe sales of a shopkeeper in the first week of january 2012, are given below :

Draw a graph representing the above data.View SolutionThe names and numbers of animals in a certain zoo are given below. Use the data to make a bar graph :
 View Solution
The daily maximum and minimum temperature of a city during one week in the month a April is given below. Construct a double bar graph using this data
 View Solution
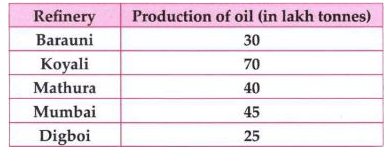
The production of oil (in lakh tonnes) in some of the refineries in India during 2008 is given below :

Construct a bar graph to represent the above dataView Solution

