The daily maximum and minimum temperature of a city during one week in the month a April is given below. Construct a double bar graph using this data

Step by step video & image solution for The daily maximum and minimum temperature of a city during one week in the month a April is given below. Construct a double bar graph using this data by Maths experts to help you in doubts & scoring excellent marks in Class 7 exams.
Topper's Solved these Questions
- BOOK - MTG IIT JEE FOUNDATIONCHAPTER - DATA HANDLINGEXERCISE - NCERT Section (Exercise - 3 .1 )23videos
DATA HANDLING
- BOOK - MTG IIT JEE FOUNDATIONCHAPTER - DATA HANDLINGEXERCISE - NCERT Section (Exercise - 3 .2 )9videos
DATA HANDLING
- BOOK - MTG IIT JEE FOUNDATIONCHAPTER - DATA HANDLINGEXERCISE - Olympiad / Hots Corner20videos
DATA HANDLING
- BOOK - MTG IIT JEE FOUNDATIONCHAPTER - CONGRUENCE OF TRIANGLES EXERCISE - Olympiad/HOTS Corner10videos
CONGRUENCE OF TRIANGLES
- BOOK - MTG IIT JEE FOUNDATIONCHAPTER - EXPONENTS AND POWERSEXERCISE - OLYMPIAD/HOTS CORNER15videos
EXPONENTS AND POWERS
Similar Questions
Take the data giving the minimum and the maximum temperature of various cities given in the table.
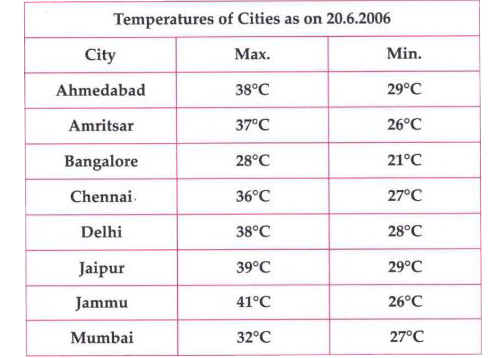
Which city has the largest difference in the minimum and maximum temperature on the given date ?View SolutionTake the data giving the minimum and the maximum temperature of various cities given in the table.
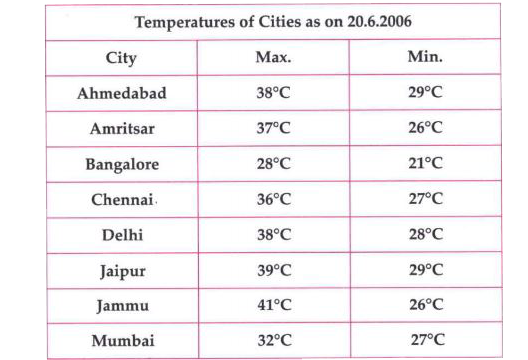
Which is the hottest city and which is the coldest city ?View Solution
Knowledge Check
- Question 1 - Select One
The following graph represents the maximum and minimum temperature recorded every day in a certain week. The day on which the difference between the maximum and minimum temperature was maximum is
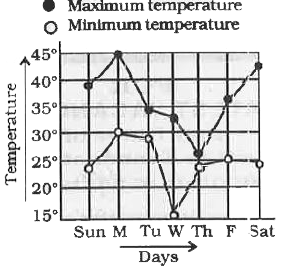 AWednesdayBSaturdayCSundayDMonday
Take the data giving the minimum and the maximum temperature of various cities given in the table.
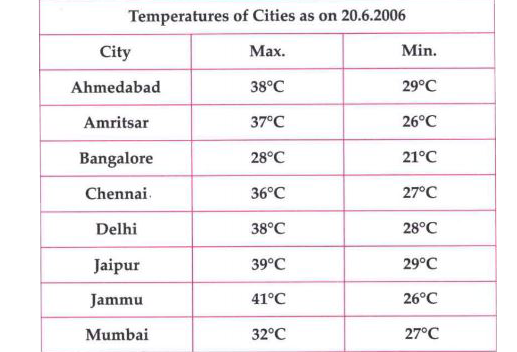
Name two cities where maximum temperature of one was less than the minimum temperature of the otherView SolutionTake the data giving the minimum and the maximum temperature of various cities given in the table.
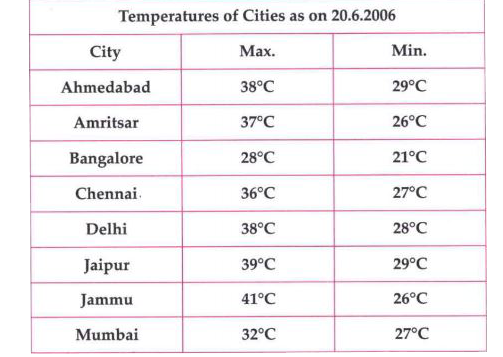
Name the city which has the least difference between its minimum and the maximum temperatureView SolutionThe expenditure of a family of different heads in a month is given below

Draw a bar graph to represent the data above.View SolutionThe production of oil (in lakh tonnes) in some of the refineries in India during 2008 is given below :
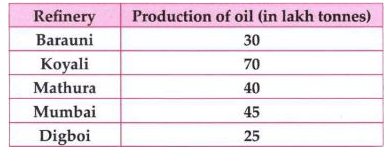
Construct a bar graph to represent the above dataView SolutionIn a school, there are five sections of class IX. The number of students in each section is given below. Construct a bar graph representing this data: Section: A B C D E No. of Students 40 48 52 45 30
View SolutionThe names of the heads of some families in village and the quantity of drinking water their family consumes in one day are given below. Draw a bar graph for this data :
 View Solution
In a school, there are five sections of class VII. The number of students in each section is given below. Construct a bar graph representing this data: Section, A, B, C, D, E No. of Students, 40, 48, 52, 45, 30
View Solution

