The following data is collected in a survey of some students of 10th standard from some schools. Draw the percentage bar graph of the data.

Topper's Solved these Questions
Similar Questions
Draw a bar graph from the following data:

View SolutionThe following data shows the number of students who attended the school on weekdays. Draw a bar graph to represent information by using appropriate scale.

View SolutionFollowing is a data collected from a survey of a colony about their favourite sports.

Draw a double bar graph choosing appropriate scale
View SolutionThe following table shows the favourite sports of 250 students of a school. Represent the data by a bar graph.
View SolutionThe following table shows the favourite games of 240 students of a school. Draw a pie chart for the following data.
¯¯¯¯¯¯¯¯¯¯¯¯¯¯¯¯¯¯¯¯¯¯¯¯¯¯¯¯¯¯¯¯¯¯¯¯¯¯¯¯¯¯¯¯¯¯¯¯¯¯¯¯¯¯¯¯¯¯¯¯¯¯¯¯¯¯¯¯¯¯¯¯¯¯¯¯¯¯¯¯¯¯¯¯¯¯¯¯¯¯¯¯¯¯¯¯¯¯¯¯¯¯¯¯¯¯¯¯¯¯¯¯¯¯¯¯¯¯¯¯Game Football Badminton Criket Volleyball HockeyNumber of 35 30 80 40 55students ––––––––––––––––––––––––––––––––––––––––––––––––––––––––––––––––––––––––––––––
View SolutionThe folliwng table shows the mode of transport used by boys and girls for going to the same school.

Draw a double bar graph representing the above data.
View SolutionGiven below is the data of school going students (boys and girls):

Draw the bar graph to represent the above data.
View SolutionGiven below is the data of school going students (boys and girls):

Draw the bar graph to represent the above data.
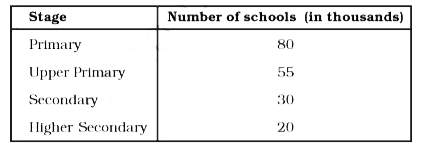
View SolutionThe following table gives the data of number of schools (stage-wise) of a country in the year 2002.

Draw a bar graph to represent the above data:
View SolutionThe following table shows the interest of students of a school in different games :

Represent the data by using a simple bar diagram.
View Solution

