Out of a line graph, a pie chart and a bar graph which one is the most suitable to show :
variation of distance covered by a car with time ?
Text Solution
The correct Answer is:Line graph
|
Topper's Solved these Questions
- MOTION AND TIMEBOOK - LAKHMIR SINGH & MANJIT KAURCHAPTER - MOTION AND TIMEEXERCISE - EXERCISE
108 Videos
- LIGHTBOOK - LAKHMIR SINGH & MANJIT KAURCHAPTER - LIGHTEXERCISE - EXERCISEE
130 Videos
- WINDS, STORMS AND CYCLONESBOOK - LAKHMIR SINGH & MANJIT KAURCHAPTER - WINDS, STORMS AND CYCLONESEXERCISE - EXERCISE
92 Videos
Similar Questions
Knowledge Check
Distance covered-time graph cannot be
Aa closed curveBbelow the time-axisCa line or curve with negative slopeDall of he aboveThe velocity - displacement graph of a particle moving along a straight line is shown
The most suitable acceleration - displacement graph will be
 A
A B
B C
C D
D
An alternating current I in an inductance coil varies with time t according to the graph as shown: Which one of the following graph gives the variation of voltage with time?
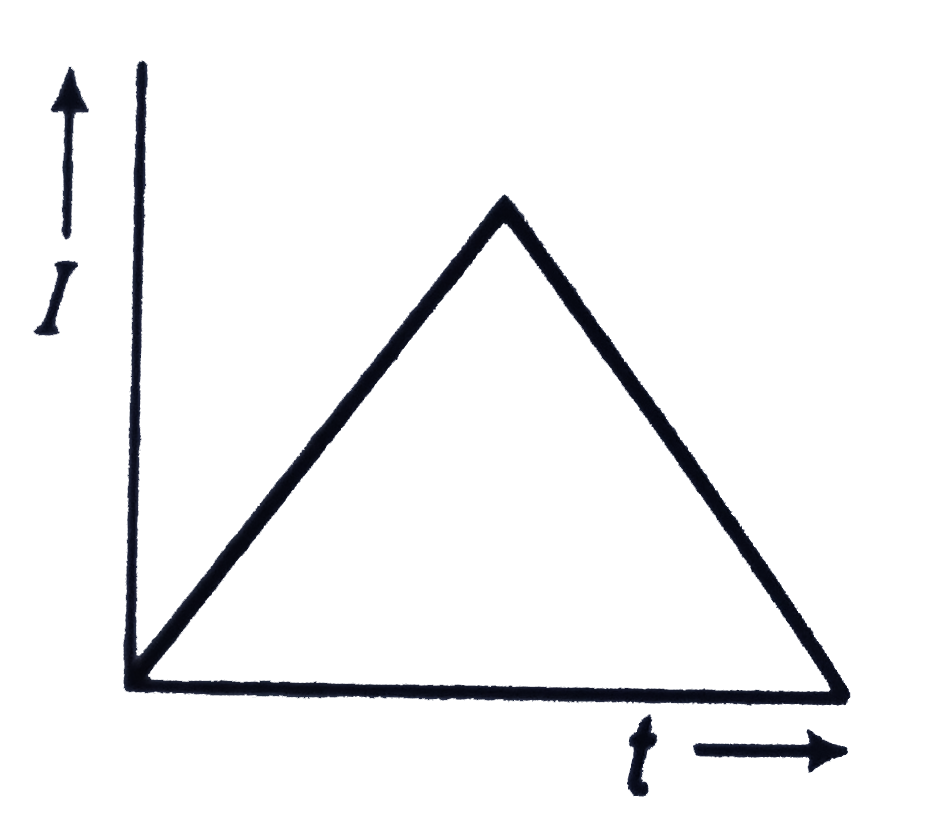 A
A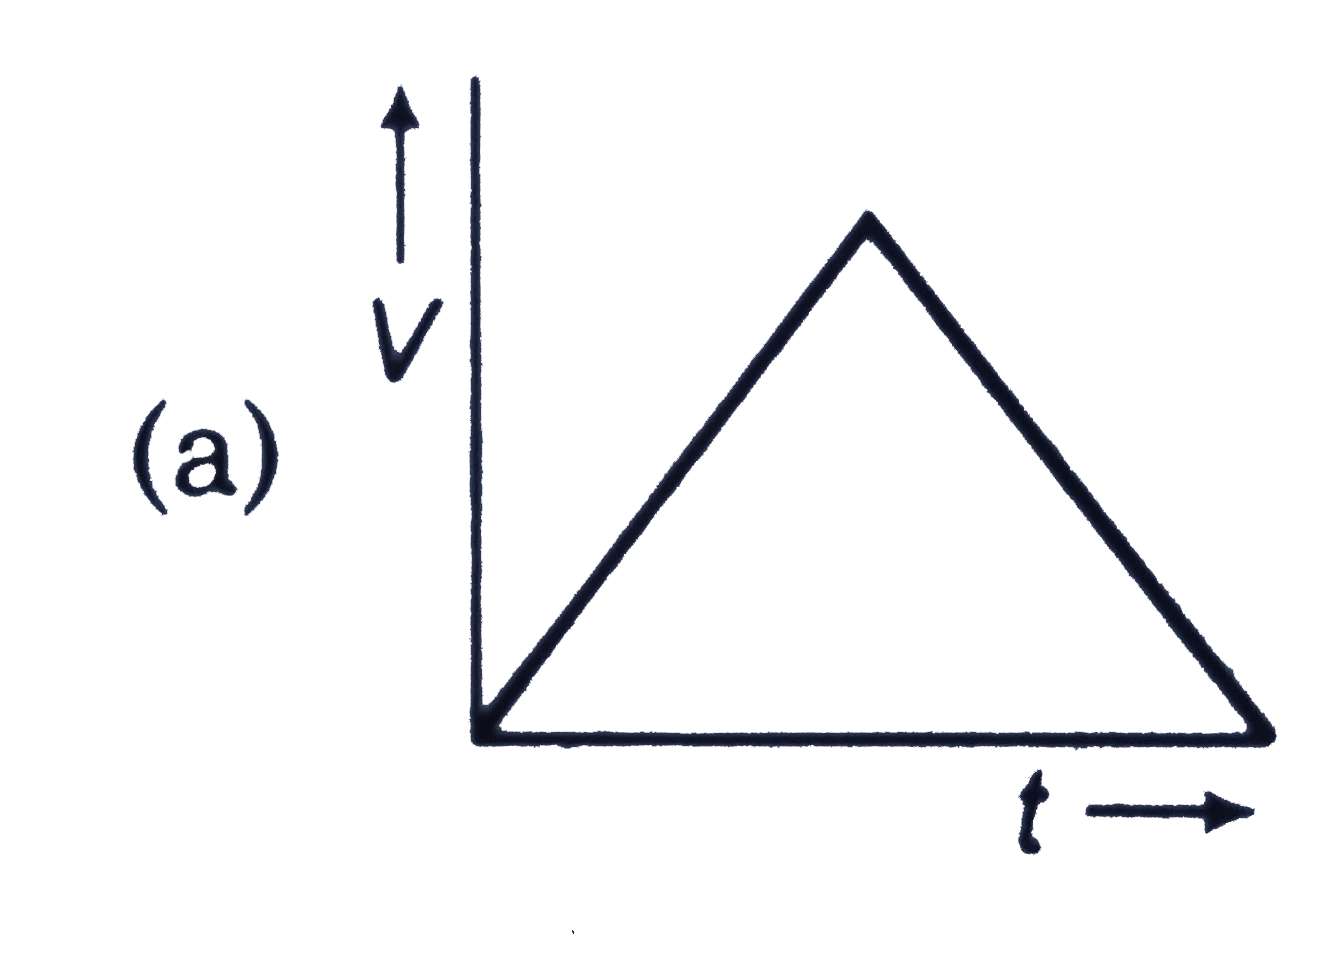 B (##DCP_V04_C27_E01_055_O02.png" width="30%">C
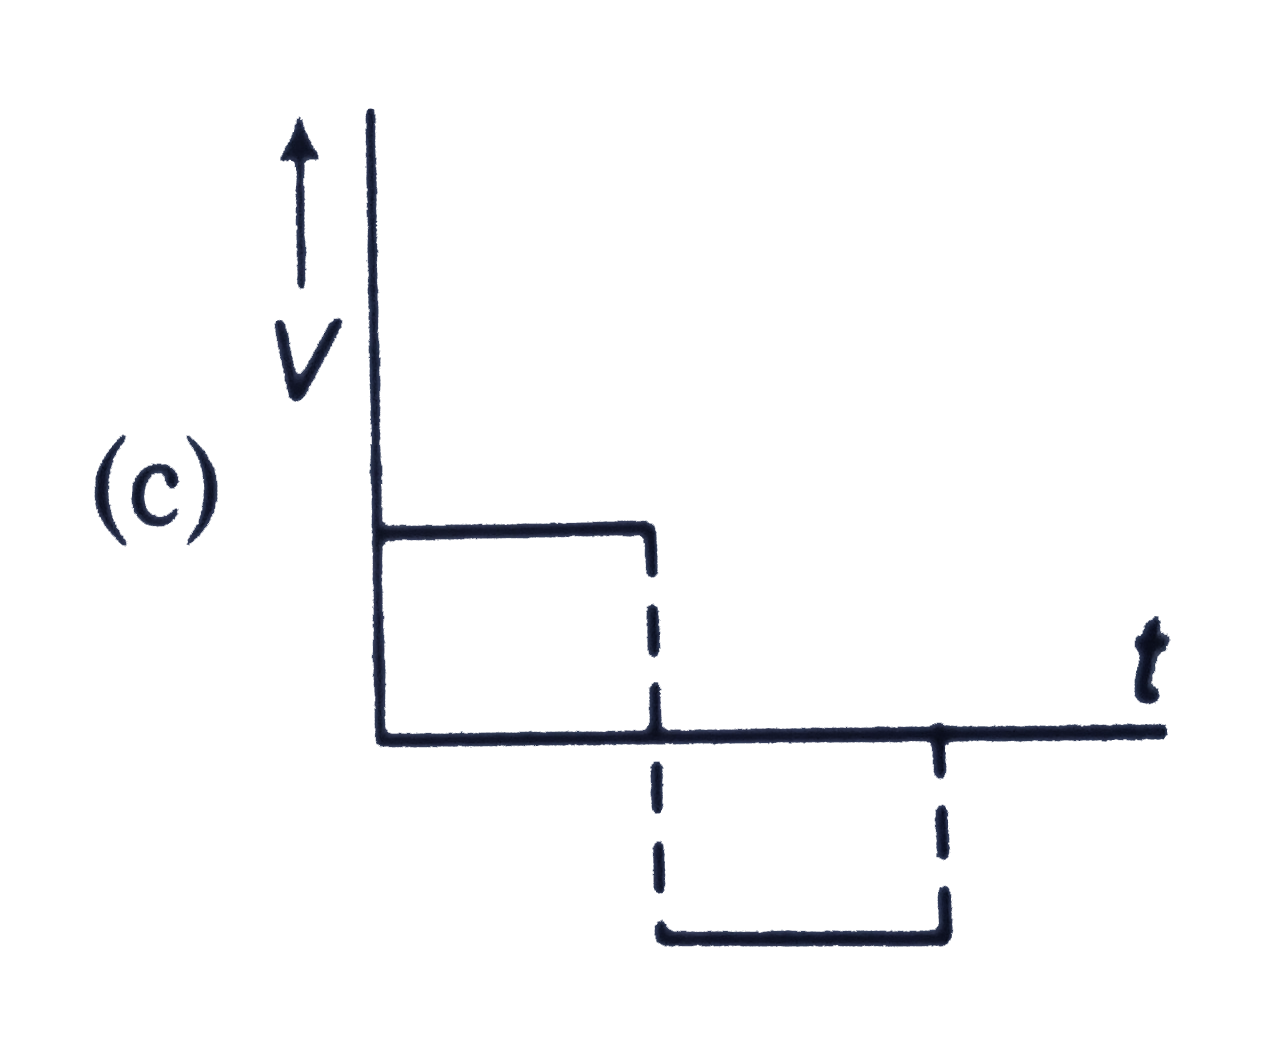 D
D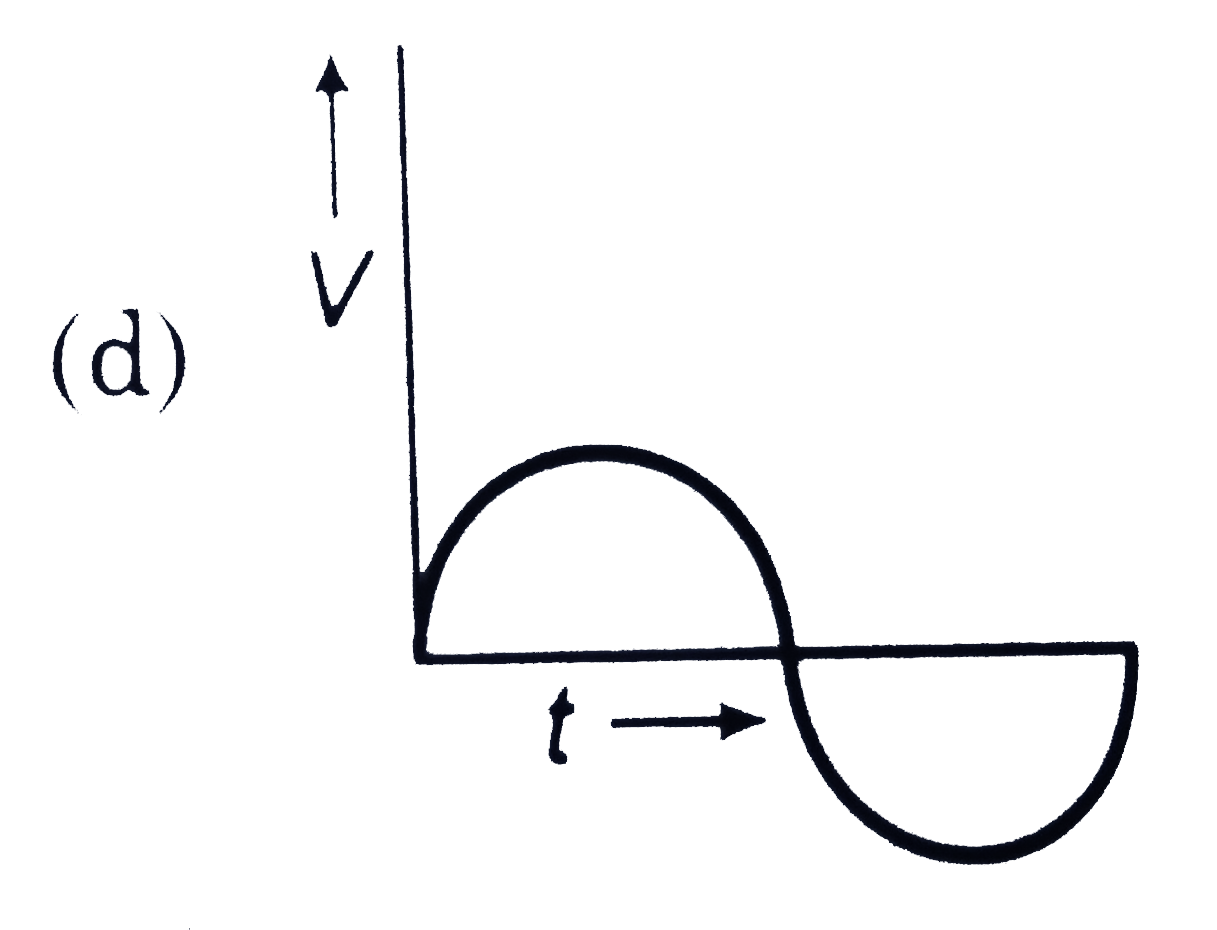
The given graph shows variation (with distance r form center) of :
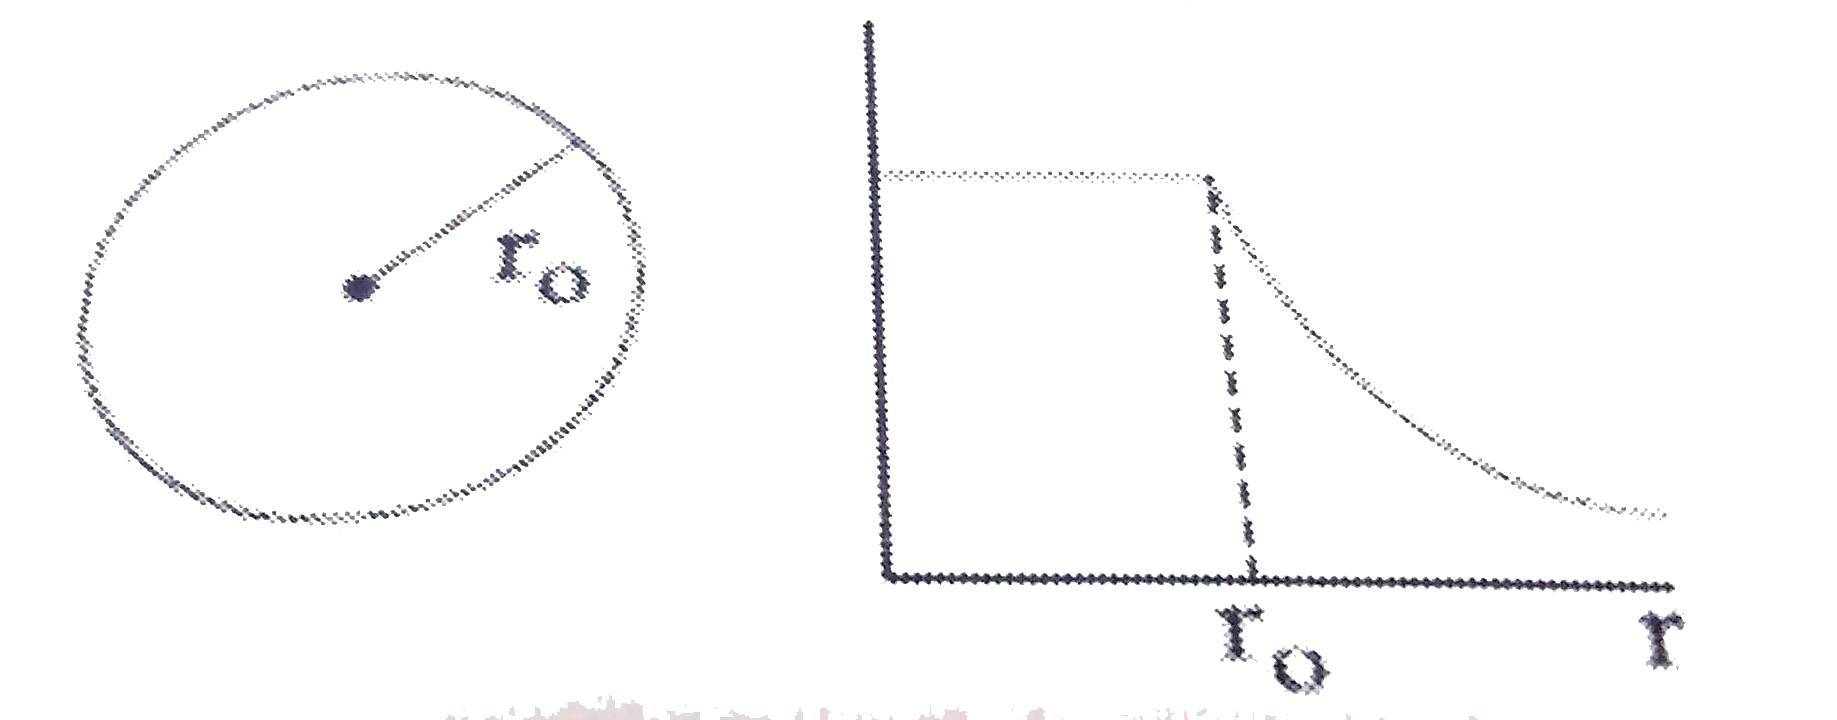
View SolutionThe given graph shows variation (with distance r form center) of :

View SolutionThe given graph shows variation (with distance r from centre) of:
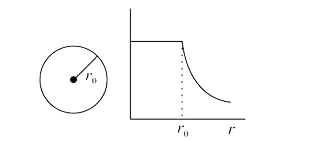
View SolutionThe given graph shows variation (with distance r from centre) of:
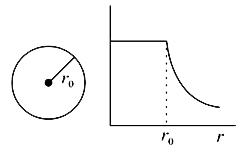
View SolutionThe velocity - displacement graph of a particle moving along a straight line is shown
The most suitable acceleration - displacement graph will be

View Solution
