Out of a line graph, a pie chart and a bar graph which one is the most suitable to show :
percentage composition of air?
The correct Answer is:Pie chart
Topper's Solved these Questions
- MOTION AND TIMEBOOK - LAKHMIR SINGH & MANJIT KAURCHAPTER - MOTION AND TIMEEXERCISE - EXERCISE
108 Videos
- LIGHTBOOK - LAKHMIR SINGH & MANJIT KAURCHAPTER - LIGHTEXERCISE - EXERCISEE
130 Videos
- WINDS, STORMS AND CYCLONESBOOK - LAKHMIR SINGH & MANJIT KAURCHAPTER - WINDS, STORMS AND CYCLONESEXERCISE - EXERCISE
92 Videos
Similar Questions
Out of a line graph, a pie chart and a bar graph which one is the most suitable to show :
variation of distance covered by a car with time ?
View SolutionOut of a line graph, a pie chart and a bar graph which one is the most suitable to show :
runs scored in various overs of a cricket match ?
View Solution
Knowledge Check
The velocity - displacement graph of a particle moving along a straight line is shown
The most suitable acceleration - displacement graph will be
 A
A B
B C
C D
D
The given pie chart shows the percentage distribution of 450 employees in an organisation. Read the pie chart and answer the question that follows.
Percentage of Employees in different Departments (Total 450 Employees )
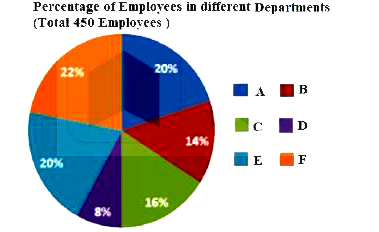
What is the number of employees working in department F?Aa)36Bb)99Cc)63Dd)72 , Which of the following graphs is suitableA
 B
B C
C D
D
In the given bar graph, in which college the percentage of boys is the higest?
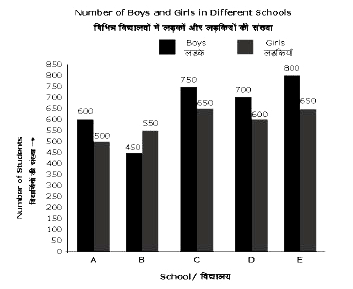
View SolutionIn the following questions are based on the following bar graph,Read the graphs and answer the questions.
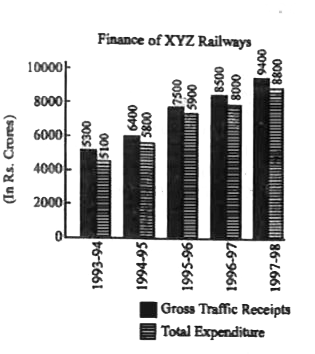
In which year was the profit as a percentage of gross traffic the highest?
View SolutionThe given pie chart shows the percentage distribution of the expenditure incurred in publishing a book study the pie chart and the answer the question based on it.
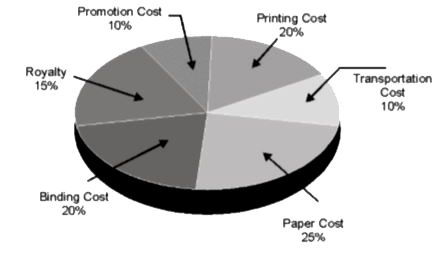
In the given pie chart by what percentage the promotion cost on the book is less than the paper cost?
View SolutionThe velocity - displacement graph of a particle moving along a straight line is shown
The most suitable acceleration - displacement graph will be

View SolutionThe following questions are based on the bar graph. Read the graph and answer the questions.
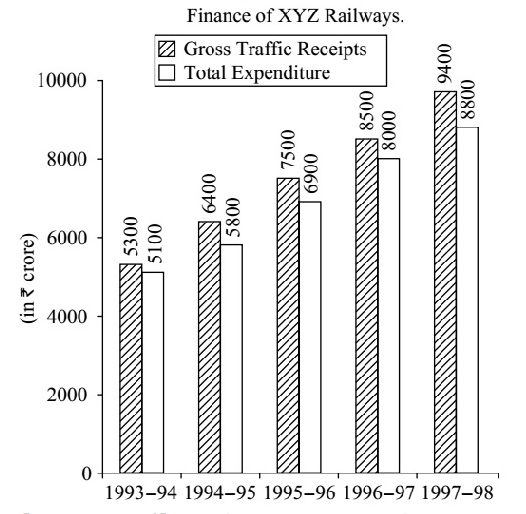
In which year was the profit as a percentage of gross traffic receipts highest?
View Solution
