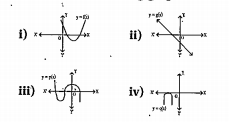
Observe the following graphs. Which of them are the graphs of quadratic polynomials? Solution in Telugu
(i), (ii) and (iii)
(i) and (iii)
(i) and (iv)
(i), (iii) and (iv)
Step by step video & image solution for Observe the following graphs. Which of them are the graphs of quadratic polynomials? by Maths experts to help you in doubts & scoring excellent marks in Class 10 exams.
Updated on:21/07/2023Topper's Solved these Questions
- QUADRATIC EQUATIONSBOOK - VGS PUBLICATION-BRILLIANTCHAPTER - QUADRATIC EQUATIONSEXERCISE - CREATIVE BITS FOR CCE MODEL EXAMINATION
130 Videos
- PROGRESSIONS (MULTIPLE CHOICE QUESTION)BOOK - VGS PUBLICATION-BRILLIANTCHAPTER - PROGRESSIONS (MULTIPLE CHOICE QUESTION)EXERCISE - PROGRESSIONS (MULTIPLE CHOICE QUESTION)
20 Videos
- QUADRATIC EQUATIONS (MULTIPLE CHOICE QUESTION)BOOK - VGS PUBLICATION-BRILLIANTCHAPTER - QUADRATIC EQUATIONS (MULTIPLE CHOICE QUESTION)EXERCISE - QUADRATIC EQUATIONS (MULTIPLE CHOICE QUESTION)
20 Videos
Similar Questions
One of the roots of the Q.E. 6x2−x−2=0 is
View SolutionA circle with area A, is contained in the interior of a larger with area A1+A2. IF the radius of the larger circle is 3 units and A1,A2 and (A1+A2) are in A.P., then find the radius of smaller circle…..
View Solution2x2+3x−1=0 is a quadratic equation the roots are α,β then α2+β2=……….
View SolutionHow many lines of symmetry does the above figure have ?
View SolutionWhich of the following are correct chain isomers of butane ? (i)
View SolutionDetermine the point of symmetry of a regular hexagon.
View SolutionDtermine the images of the following figure about the given line :
View SolutionMatch the following Column A to Column B

View SolutionMatch the following Column A to Column B

View SolutionMatch the following Column A to Column B

View SolutionThe inequation represented by the graph given below is :
View SolutionThe inequation that best describes the graph given below is _________
View SolutionThe inequation that best describes the following graph is _________
View SolutionWhich inequations represent the shaded region in the given figure
View SolutionWhich of the following statement is not correc for following straight line graph :-
ltimg src="https://d10lpgp6xz60nq.cloudfront.net/physics_images/ALN_PHY_R04_E01_015_Q01.png" width="80%"gt
View SolutionMagnitude of slope i.e. steepness of graph shown in figure ltimg src="https://d10lpgp6xz60nq.cloudfront.net/physics_images/ALN_PHY_R04_E01_026_Q01.png" width="80%"gt
View Solution
