Graphs are very useful to represent a physical situation. Various quantities can be easily represented on graphs and other quantites can be determined from the graph. For example the slope of velocity-time graph represents instantaneous acceleration. For a motion with constant acceleration slope of velocity-time graph is constant. If acceleration is changing with time, slope with change and thus velocity-time graph will be a non-linear curve. Further the area of velocity-time graph gives displacement.
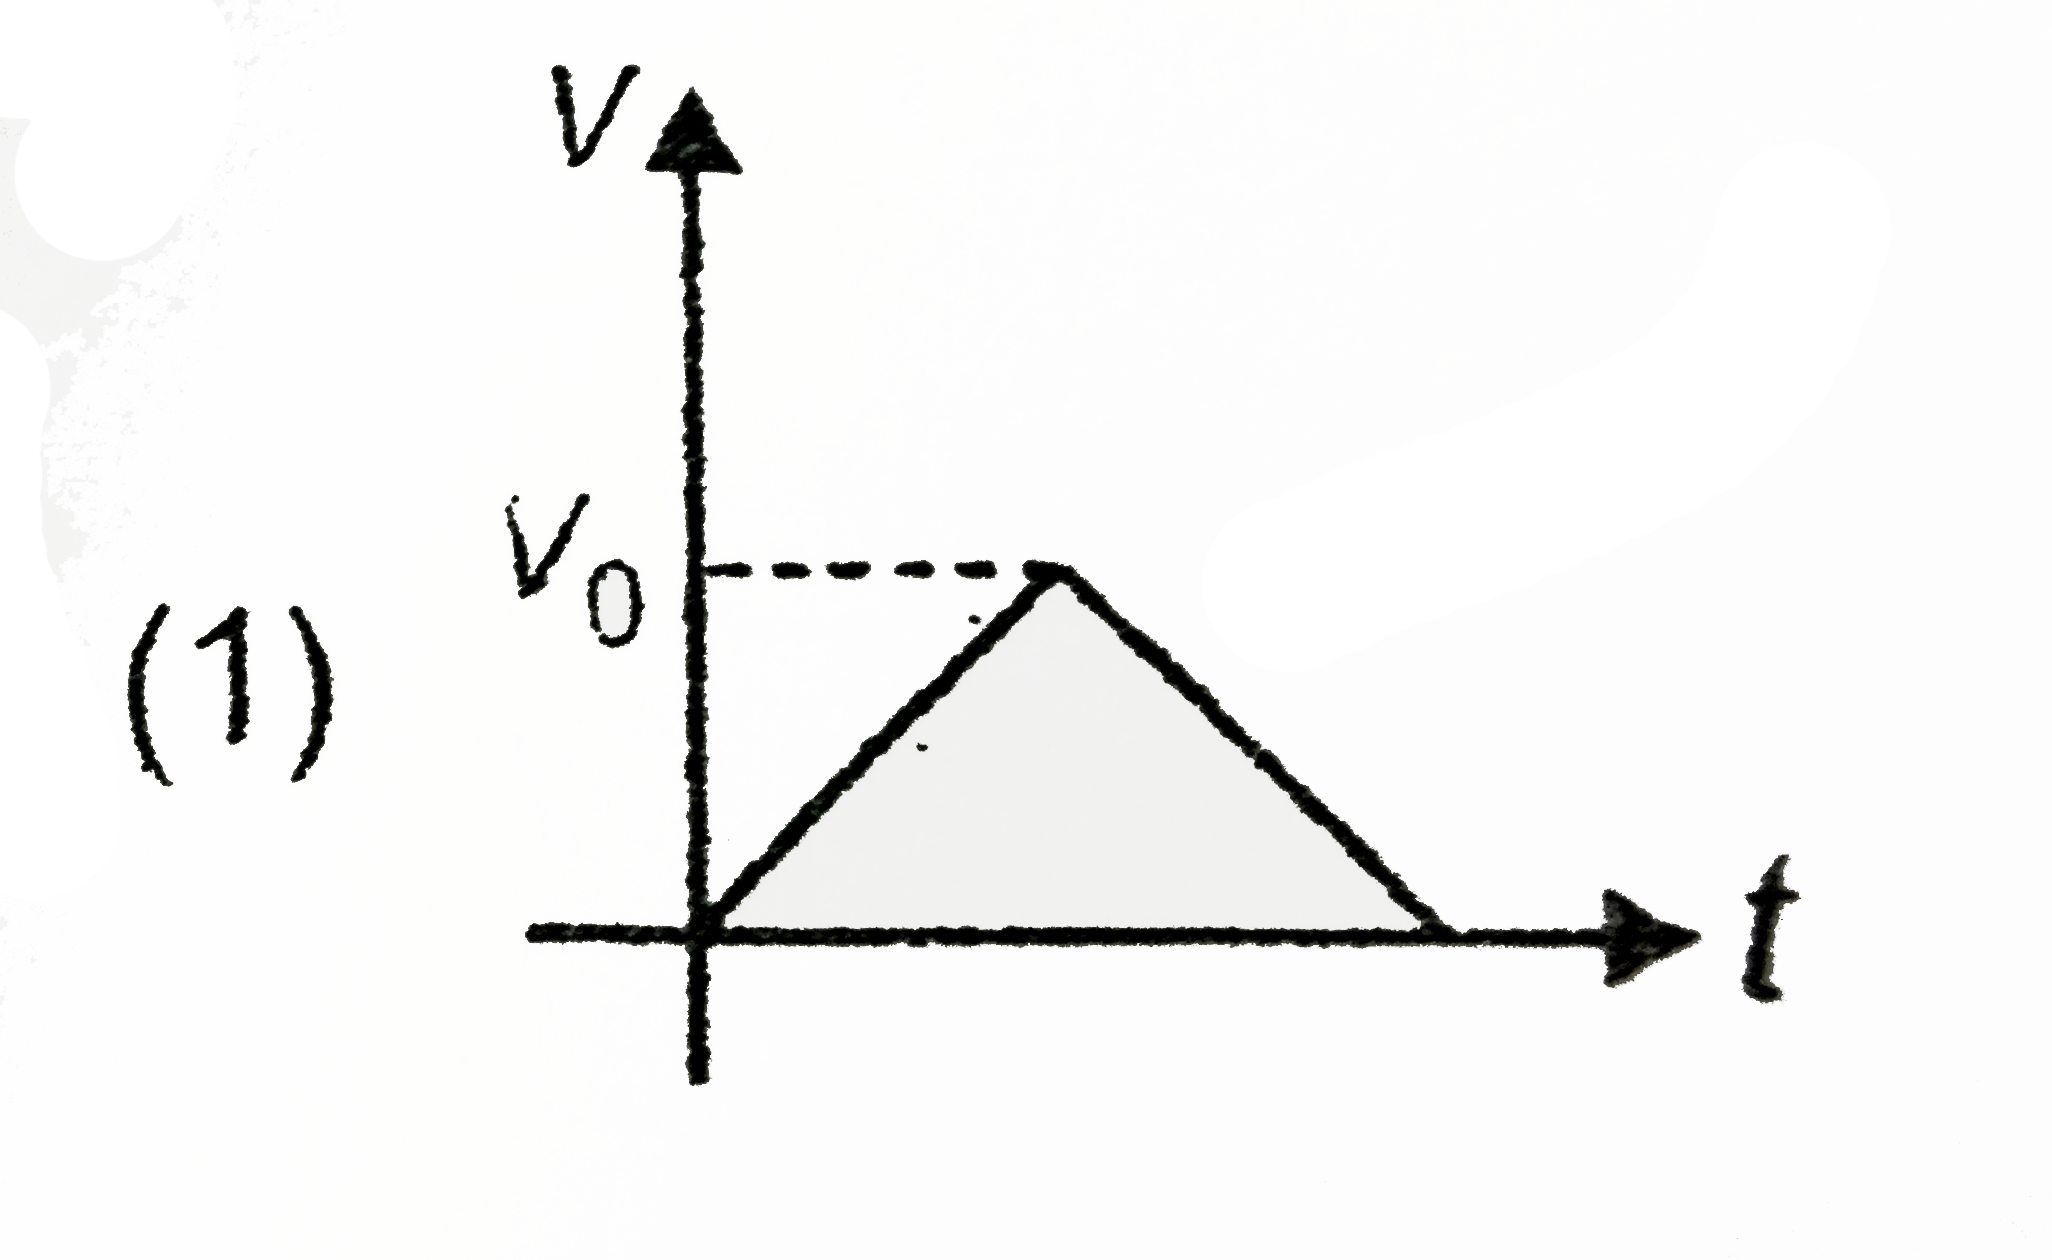
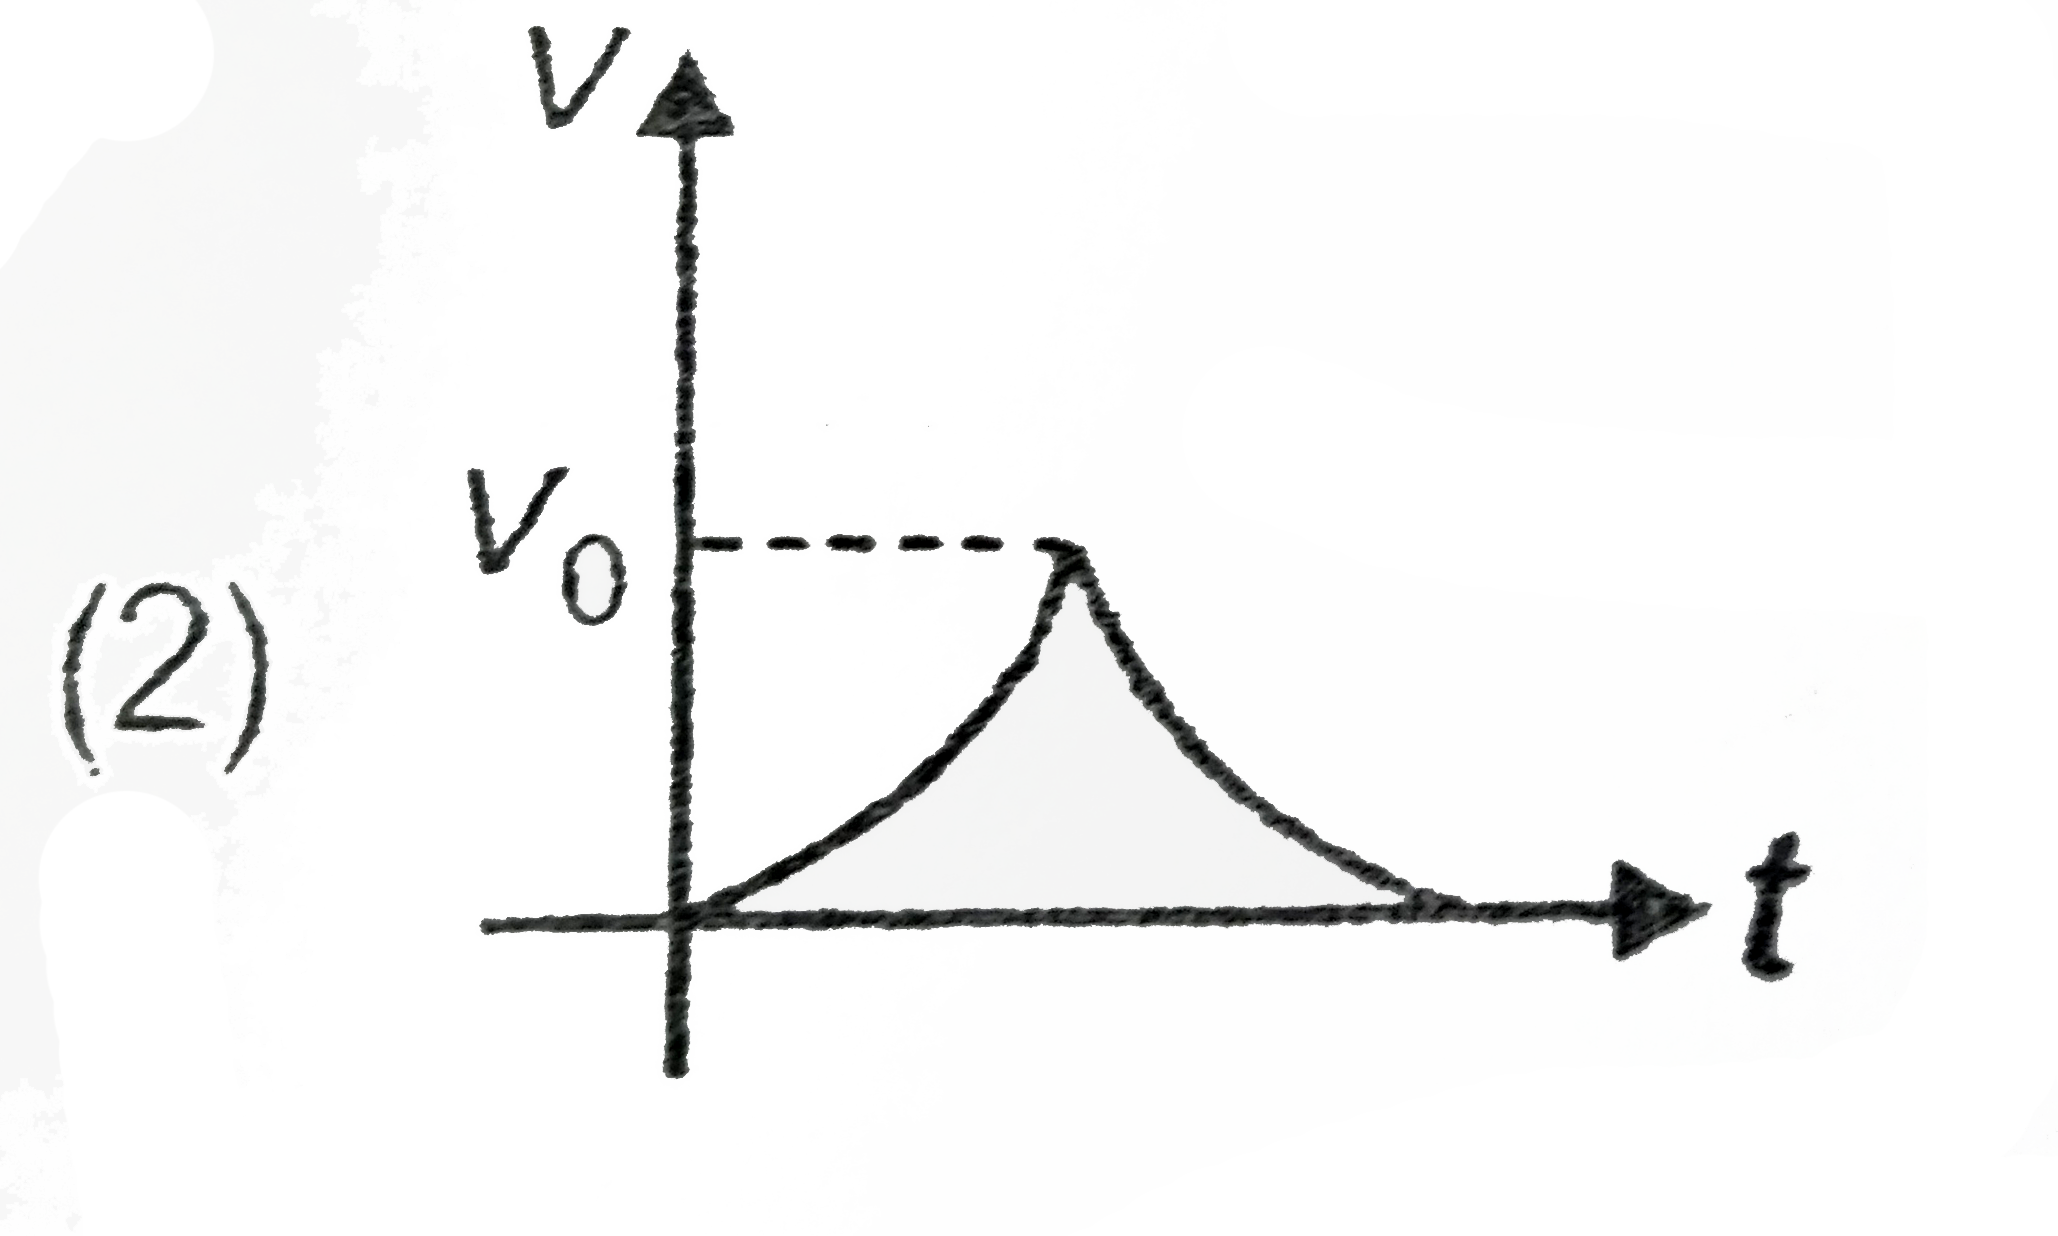
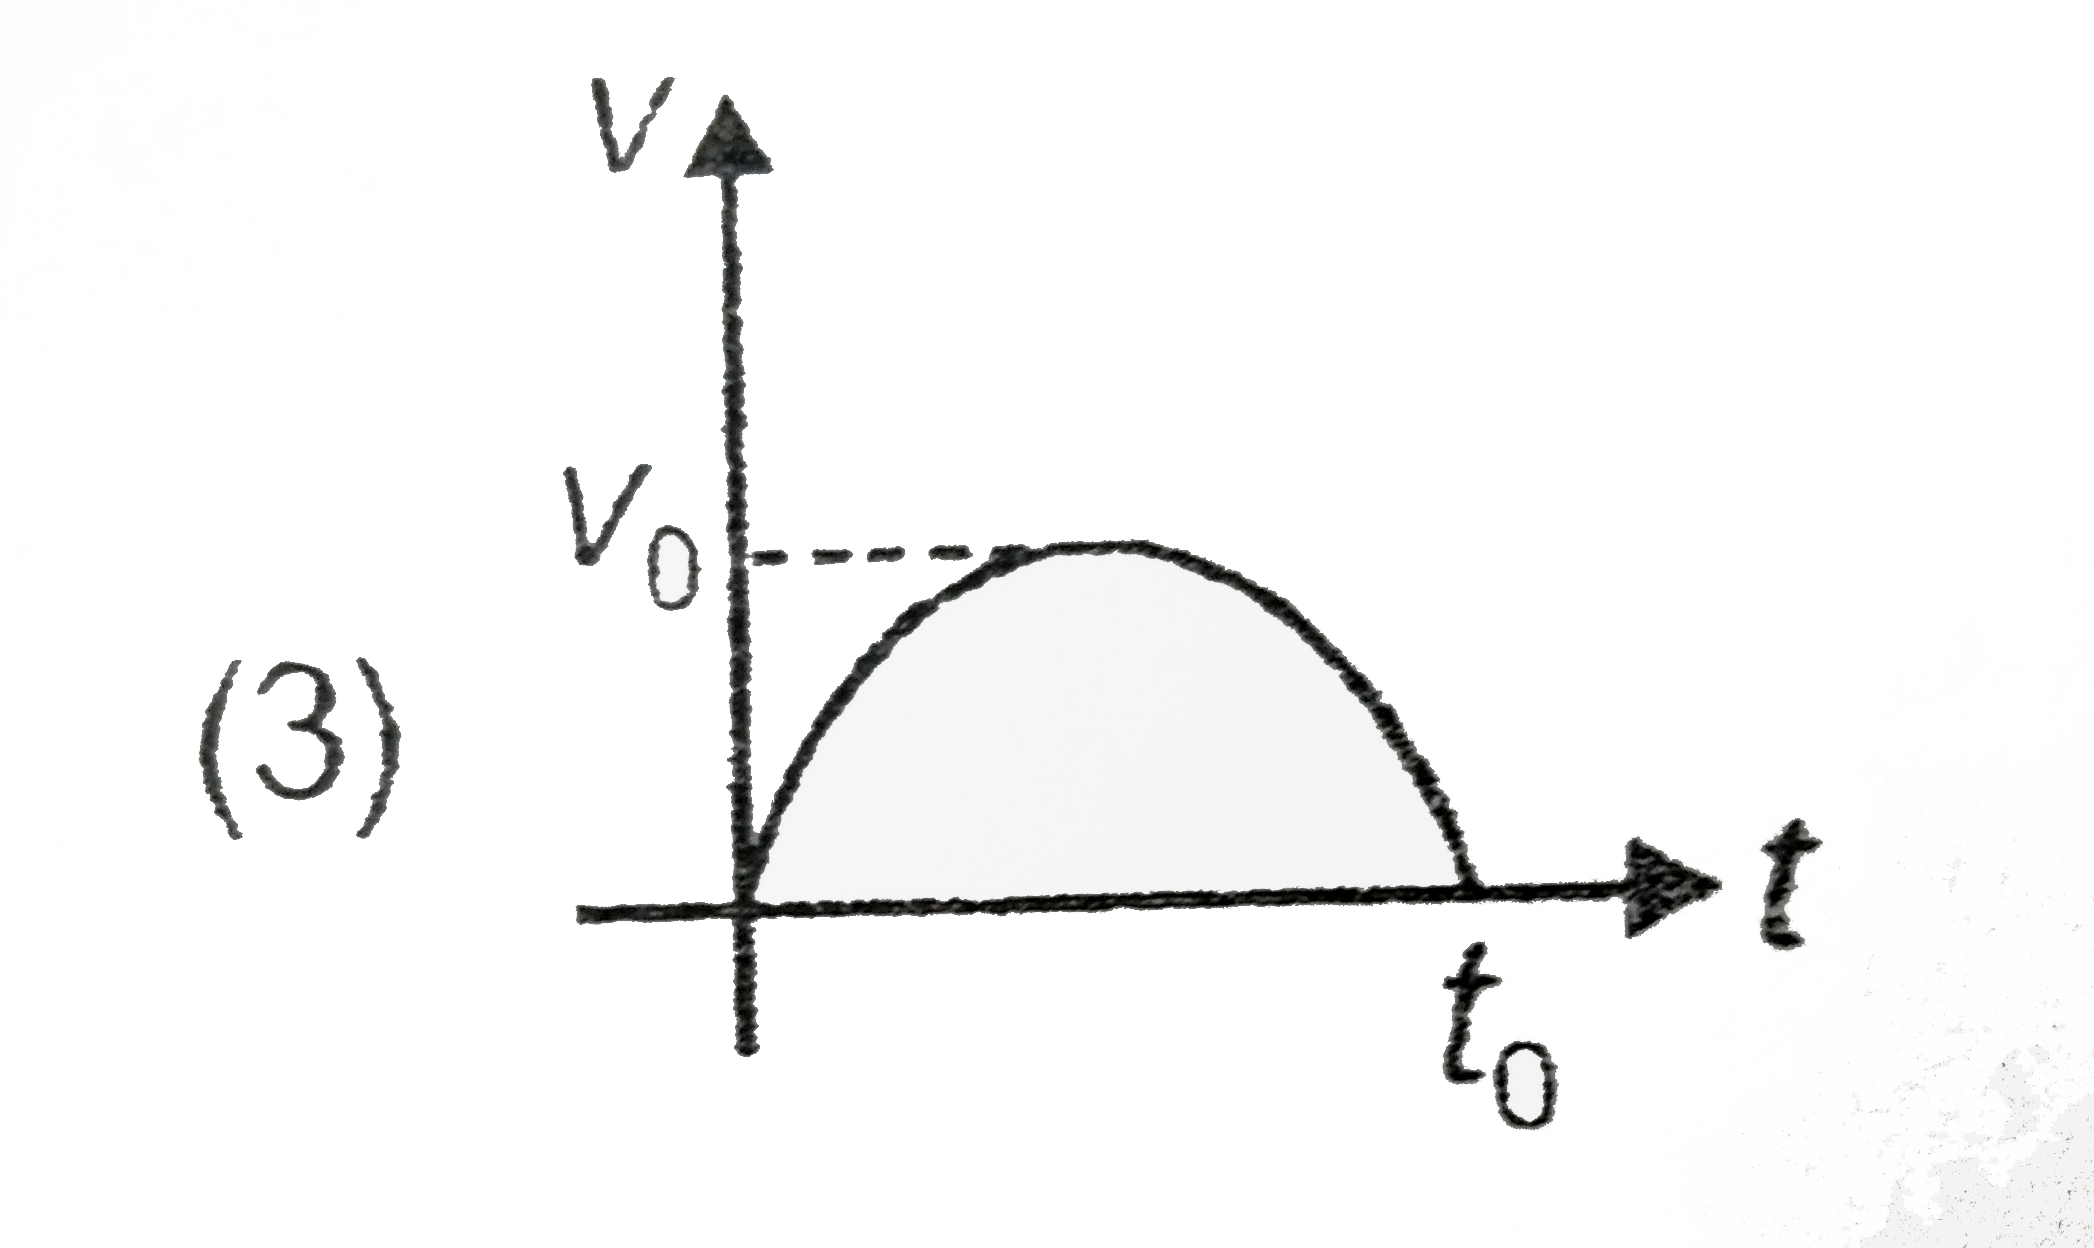
A car starts from rest with a constant acceleration a1 for some time and attains a velocity v0. Then it immediately retards at a constant rate a2 to rest. The total time to journey is t0 Identify the correct velocity-time graph
(4). None of these
The correct Answer is:A
To solve the problem, we need to analyze the motion of the car as described in the question. The car undergoes two phases: acceleration and deceleration. Let's break down the steps to identify the correct velocity-time graph.
Step 1: Understand the Motion Phases
1. Acceleration Phase: The car starts from rest and accelerates with a constant acceleration a1 until it reaches a maximum velocity v0.
2. Deceleration Phase: After reaching v0, the car immediately starts to decelerate at a constant rate a2 until it comes to rest.
Step 2: Analyze the Velocity-Time Graph
- During the acceleration phase, the velocity increases linearly from 0 to v0. This indicates that the graph will be a straight line with a positive slope.
- During the deceleration phase, the velocity decreases from v0 to 0. This also indicates a straight line, but with a negative slope.
Step 3: Total Time of Journey
- The total time of the journey is t0, which is the sum of the time taken to accelerate to v0 and the time taken to decelerate to rest.
Step 4: Identify the Correct Graph
- The correct velocity-time graph should show:
- A straight line from the origin (0,0) to the point (t1, v0), where t1 is the time taken to reach maximum velocity.
- A straight line from (t1, v0) to (t0, 0), where t0 is the total time taken to come to rest.
Step 5: Evaluate the Options
1. Option 1: A straight line increasing to v0 and then a straight line decreasing to 0. This matches our analysis.
2. Option 2: A non-linear curve, which indicates changing acceleration. This is incorrect.
3. Option 3: A semicircular curve, which also indicates changing acceleration. This is incorrect.
4. Option 4: Another non-linear curve, which is incorrect.
Conclusion
The correct velocity-time graph is Option 1, as it accurately represents the motion of the car with constant acceleration followed by constant deceleration.
---
1. Acceleration Phase: The car starts from rest and accelerates with a constant acceleration a1 until it reaches a maximum velocity v0.
2. Deceleration Phase: After reaching v0, the car immediately starts to decelerate at a constant rate a2 until it comes to rest.
- During the acceleration phase, the velocity increases linearly from 0 to v0. This indicates that the graph will be a straight line with a positive slope.
- During the deceleration phase, the velocity decreases from v0 to 0. This also indicates a straight line, but with a negative slope.
- The total time of the journey is t0, which is the sum of the time taken to accelerate to v0 and the time taken to decelerate to rest.
- The correct velocity-time graph should show:
- A straight line from the origin (0,0) to the point (t1, v0), where t1 is the time taken to reach maximum velocity.
- A straight line from (t1, v0) to (t0, 0), where t0 is the total time taken to come to rest.
1. Option 1: A straight line increasing to v0 and then a straight line decreasing to 0. This matches our analysis.
2. Option 2: A non-linear curve, which indicates changing acceleration. This is incorrect.
3. Option 3: A semicircular curve, which also indicates changing acceleration. This is incorrect.
4. Option 4: Another non-linear curve, which is incorrect.
The correct velocity-time graph is Option 1, as it accurately represents the motion of the car with constant acceleration followed by constant deceleration.
Topper's Solved these Questions
- MOTION IN STRAIGHT LINEBOOK - AAKASH INSTITUTE ENGLISHCHAPTER - MOTION IN STRAIGHT LINEEXERCISE - Assignment (SECTION - E)
8 Videos
- MOTION IN STRAIGHT LINEBOOK - AAKASH INSTITUTE ENGLISHCHAPTER - MOTION IN STRAIGHT LINEEXERCISE - Assignment (SECTION - F)
2 Videos
- MOTION IN STRAIGHT LINEBOOK - AAKASH INSTITUTE ENGLISHCHAPTER - MOTION IN STRAIGHT LINEEXERCISE - Assignment (SECTION - C)
7 Videos
- MOTION IN A STRAIGHT LINEBOOK - AAKASH INSTITUTE ENGLISHCHAPTER - MOTION IN A STRAIGHT LINEEXERCISE - ASSIGNMENT (SECTION - D)
15 Videos
- MOVING CHARGE AND MAGNESIUMBOOK - AAKASH INSTITUTE ENGLISHCHAPTER - MOVING CHARGE AND MAGNESIUMEXERCISE - SECTION D
16 Videos
Similar Questions
Graphs are very useful to represent a physical situation. Various quantities can be easily represented on graphs and other quantites can be determined from the graph. For example the slope of velocity-time graph represents instantaneous acceleration. For a motion with constant acceleration slope of velocity-time graph is constant. If acceleration is changing with time, slope with change and thus velocity-time graph will be a non-linear curve. Further the area of velocity-time graph gives displacement.
The average velocity of the car for the entire trip is
View SolutionGraphs are very useful to represent a physical situation. Various quantities can be easily represented on graphs and other quantites can be determined from the graph. For example the slope of velocity-time graph represents instantaneous acceleration. For a motion with constant acceleration slope of velocity-time graph is constant. If acceleration is changing with time, slope will change and thus velocity-time graph will be a non-linear curve. Further the area of velocity-time graph gives displacement.
The correct relation between v0,a1,a2andt0 is
View SolutionGraphs are very useful to represent a physical situation. Various quantities can be easily represented on graphs and other quantites can be determined from the graph. For example the slope of velocity-time graph represents instantaneous acceleration. For a motion with constant acceleration slope of velocity-time graph is constant. If acceleration is changing with time, slope will change and thus velocity-time graph will be a non-linear curve. Further the area of velocity-time graph gives displacement.
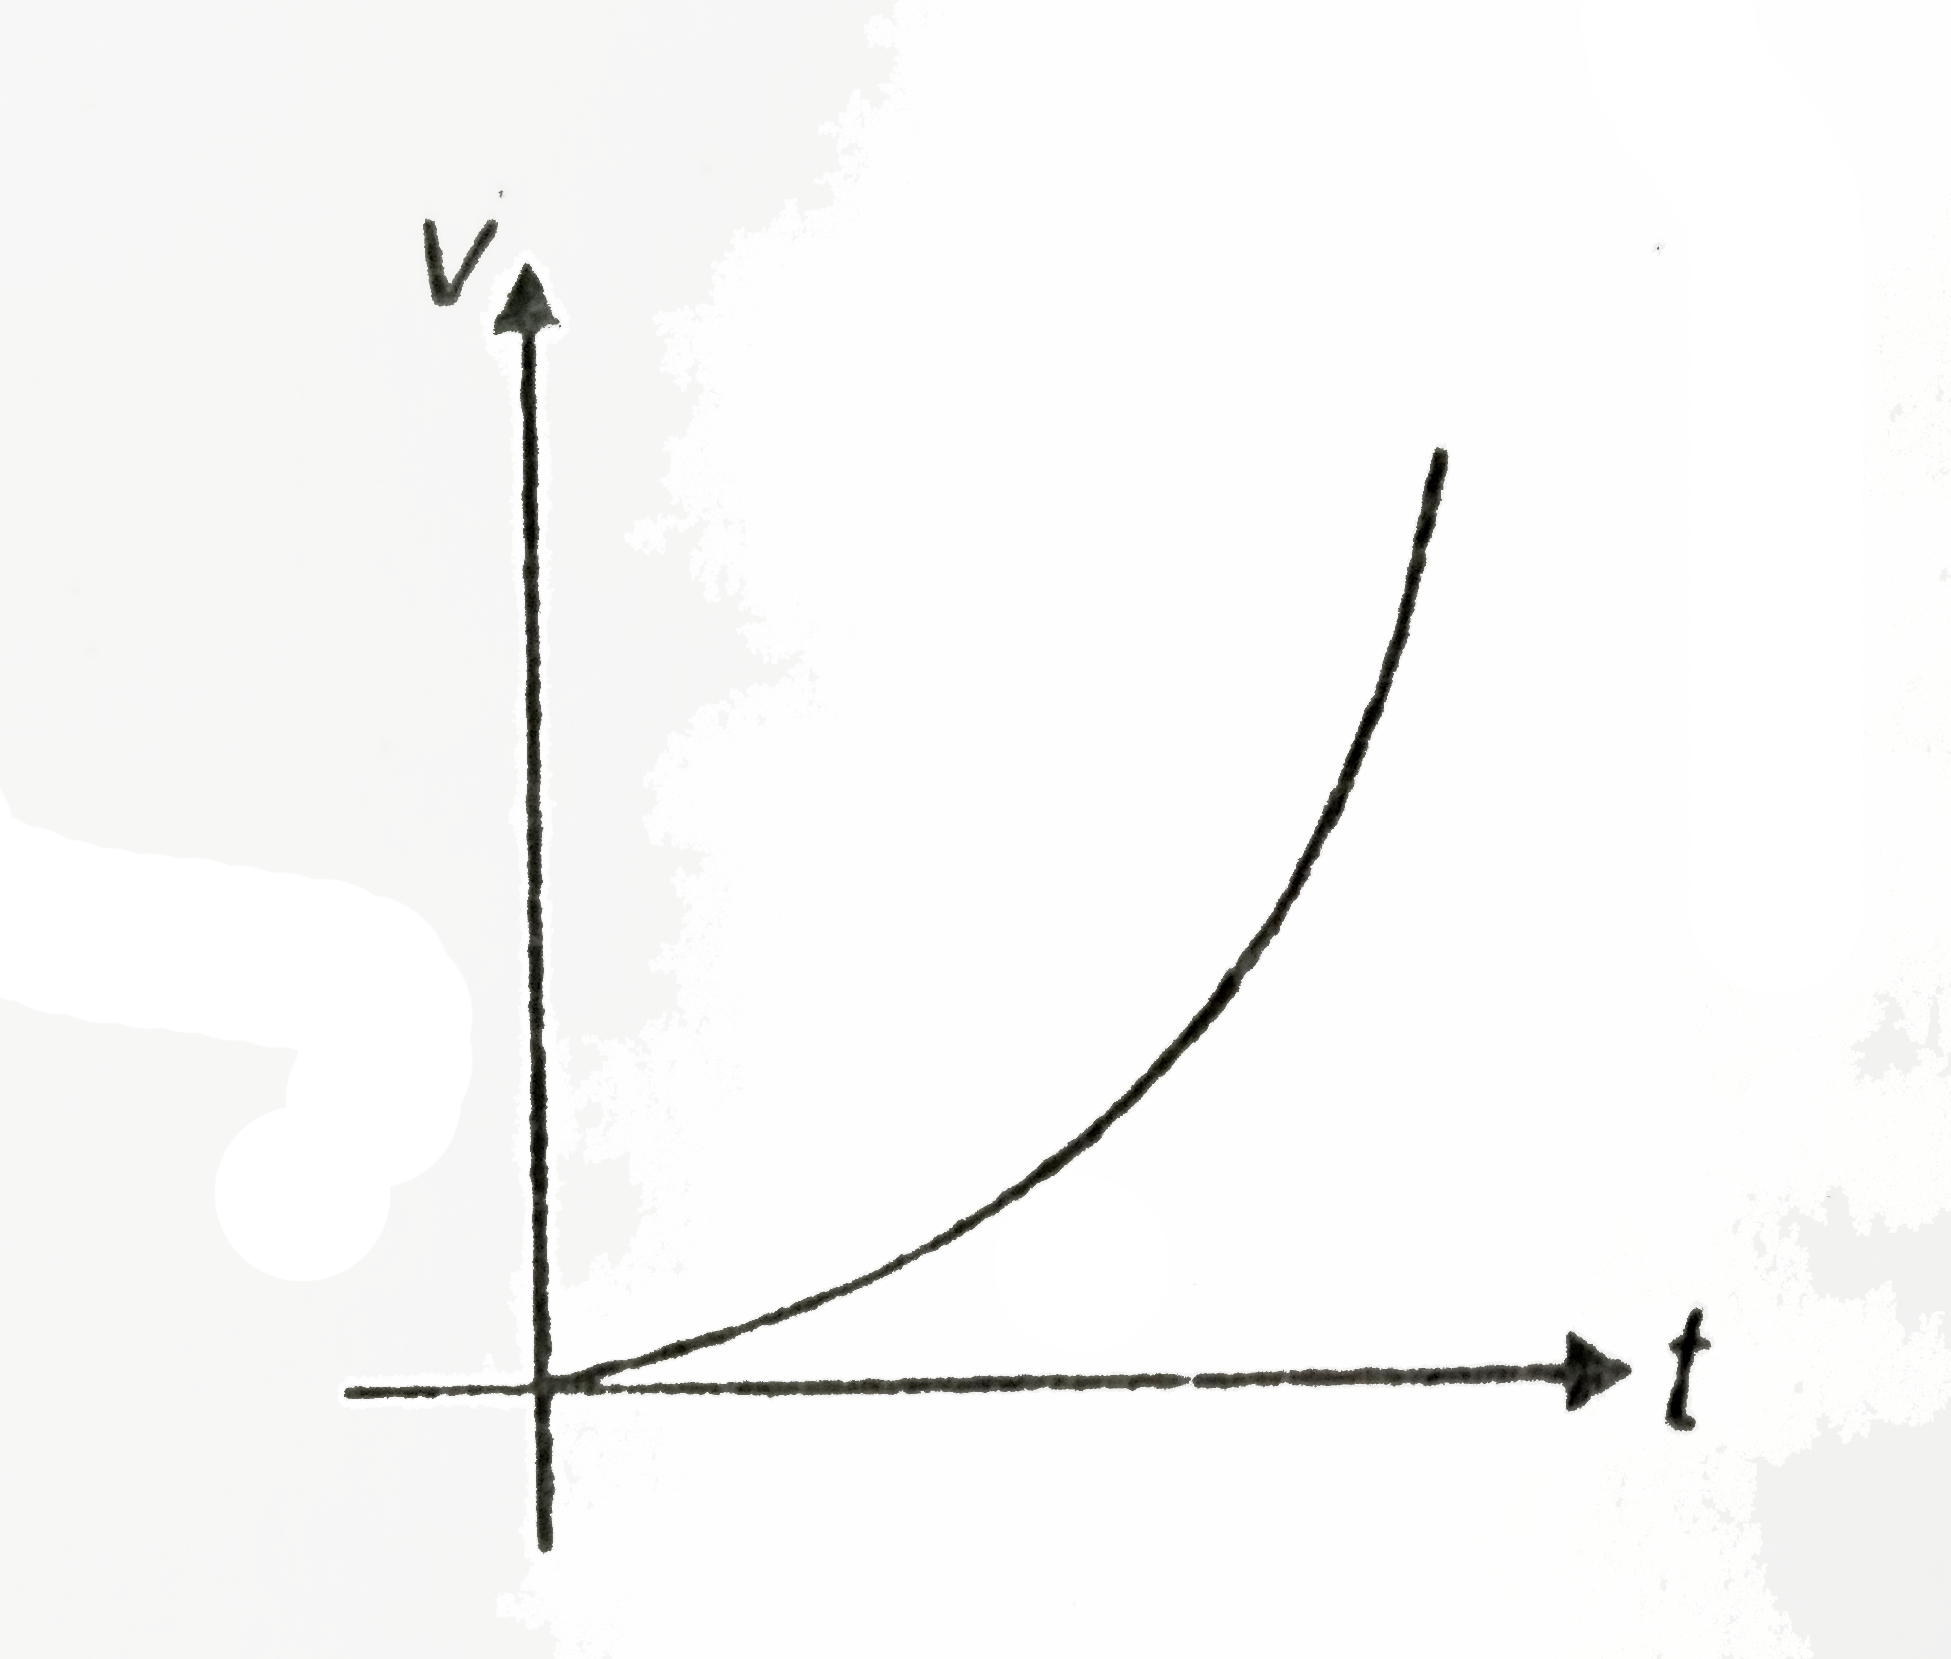
For the given velocity-time graph the possibly correct acceleration-time relationship is
View SolutionGraphs are very useful to represent a physical situation. Various quantities can be easily represented on graphs and other quantites can be determined from the graph. For example the slope of velocity-time graph represents instantaneous acceleration. For a motion with constant acceleration slope of velocity-time graph is constant. If acceleration is changing with time, slope with change and thus velocity-time graph will be a non-linear curve. Further the area of velocity-time graph gives displacement.
The velocity-time graph for two objects P and Q are shown. The ratio of their respective acceleration is
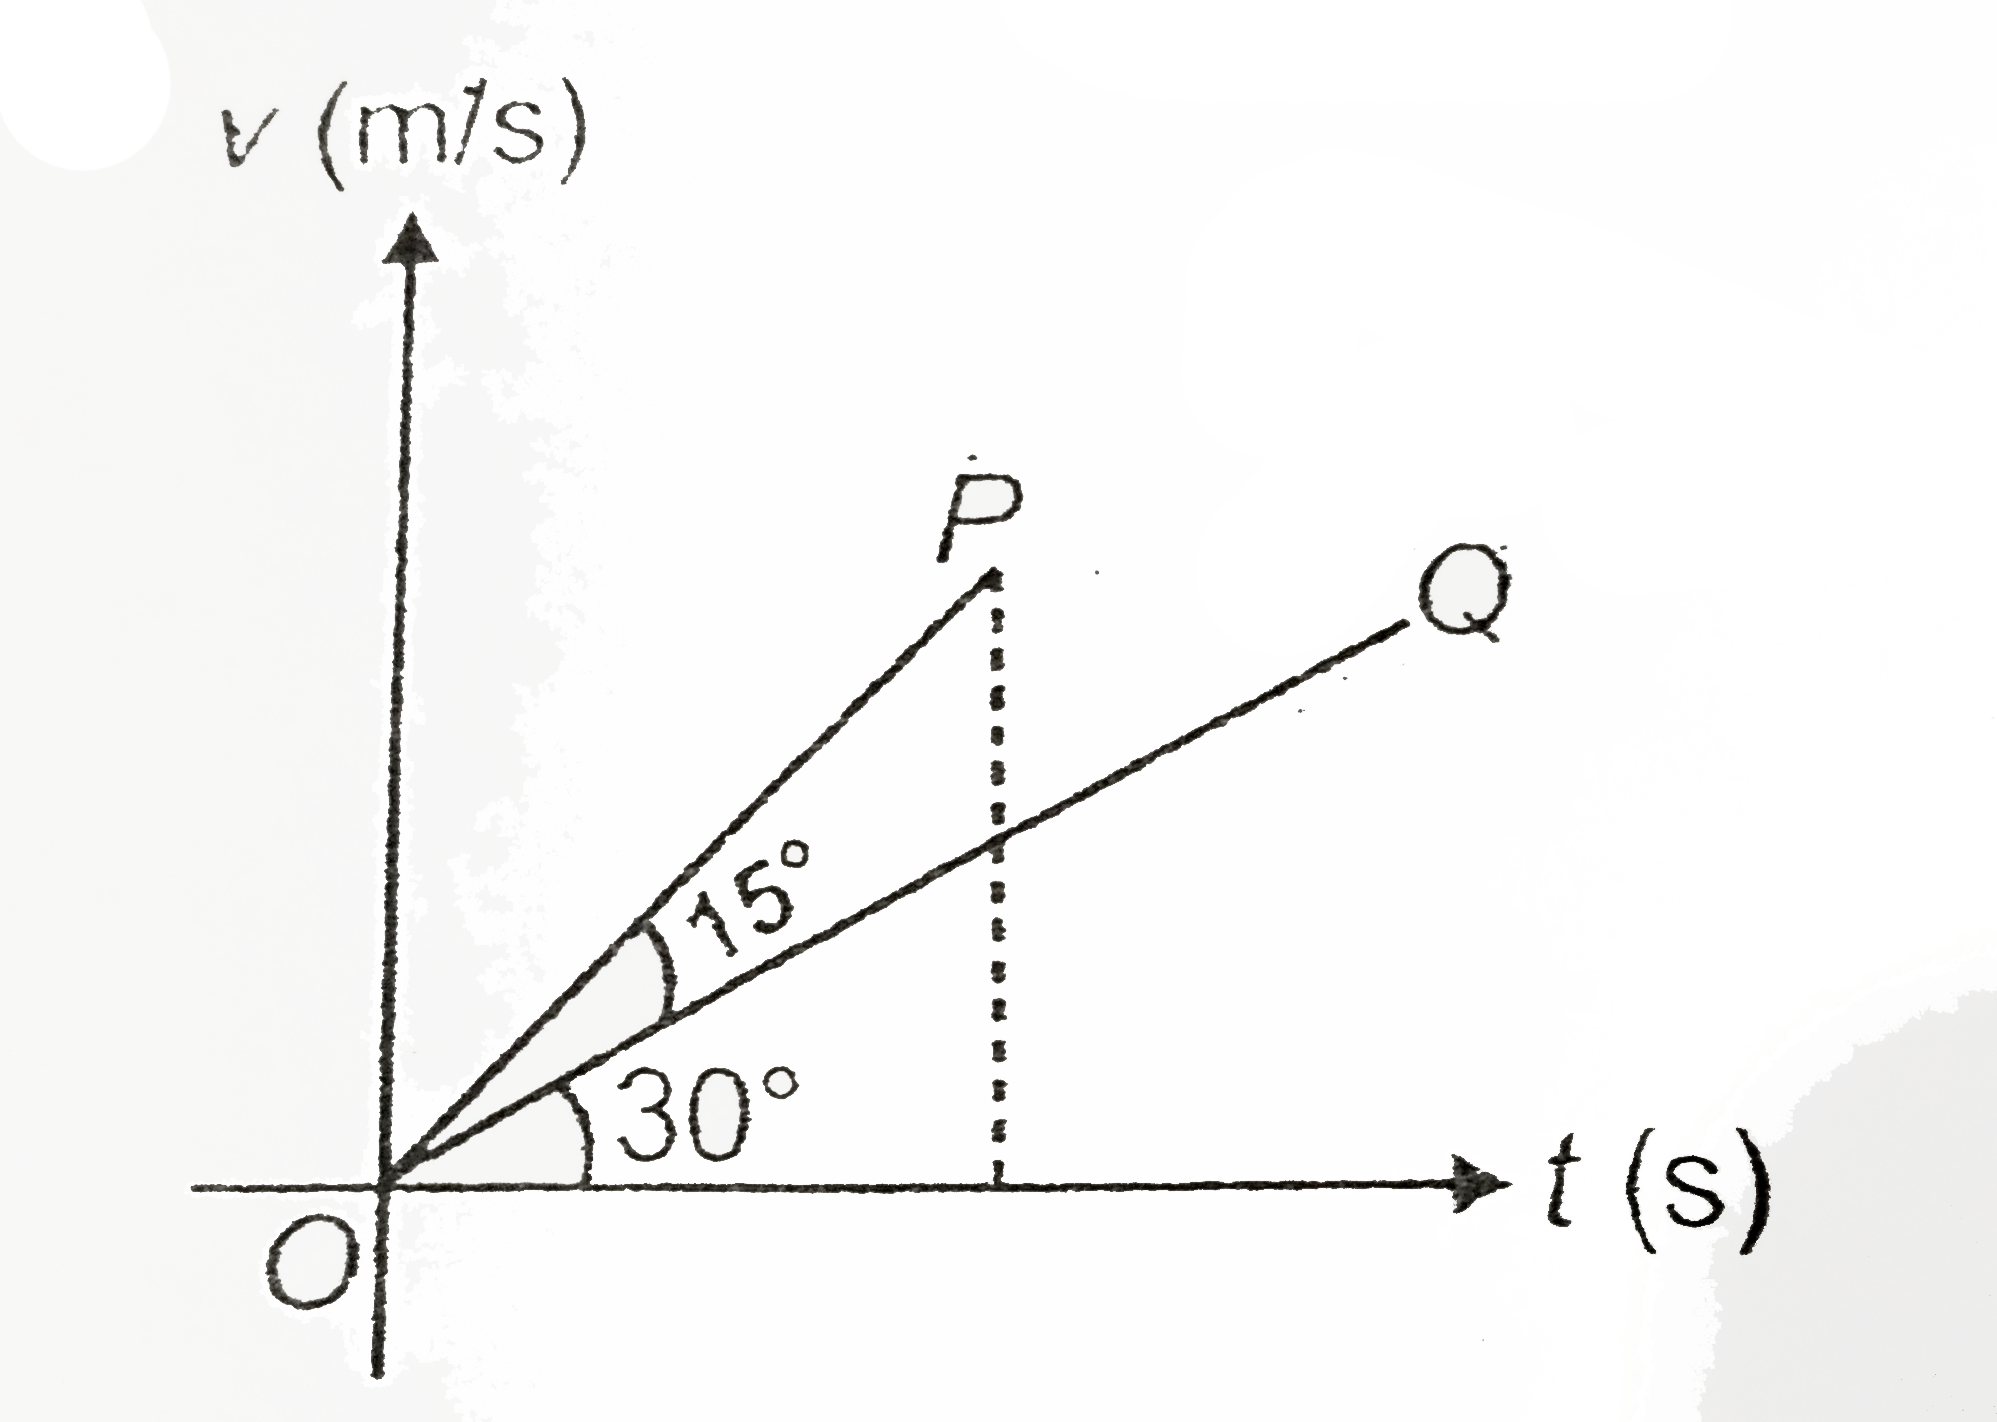
View SolutionGraphs are very useful to represent a physical situation. Various quantities can be easily represented on graphs and other quantites can be determined from the graph. For example the slope of velocity-time graph represents instantaneous acceleration. For a motion with constant acceleration slope of velocity-time graph is constant. If acceleration is changing with time, slope will change and thus velocity-time graph will be a non-linear curve. Further the area of velocity-time graph gives displacement.
For the given velocity-time graph the displacement of the object between t = 2 s to t = 4 s is
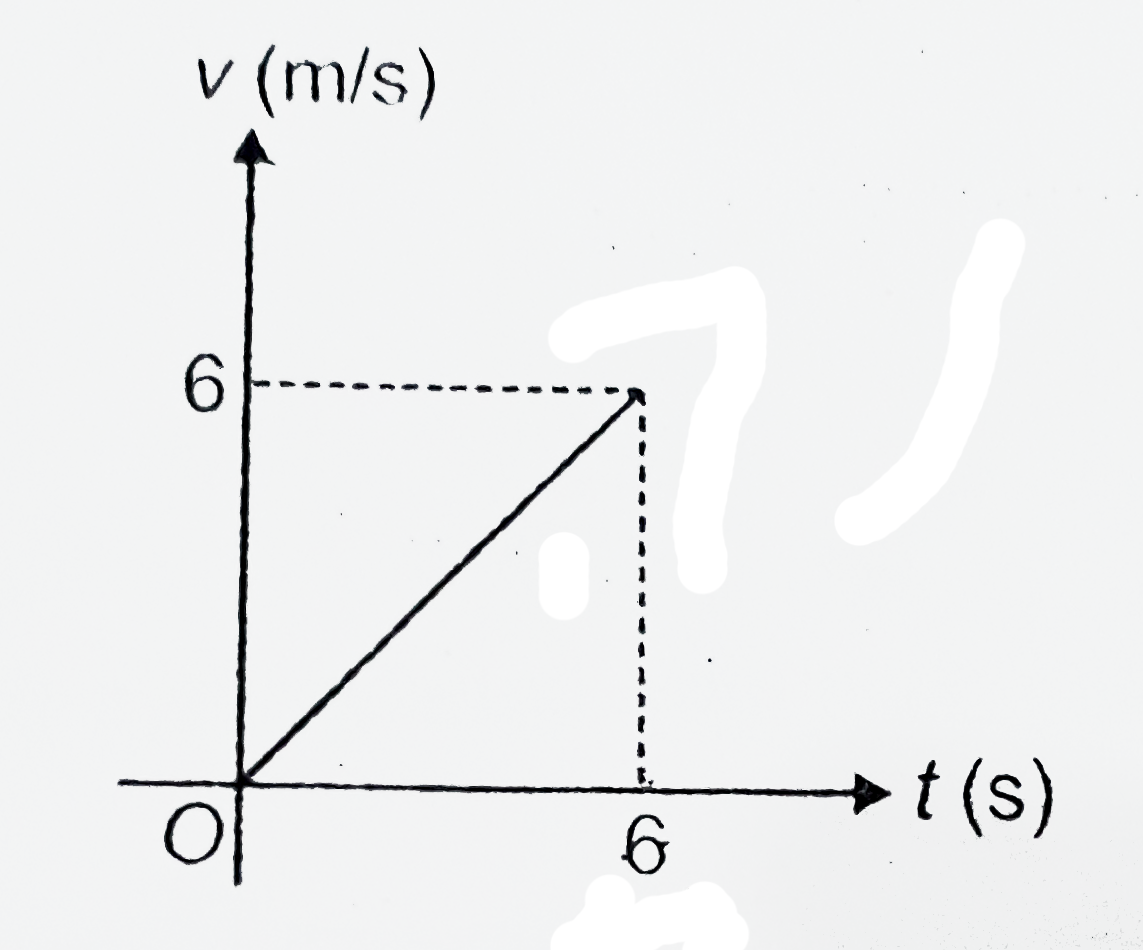
View SolutionGraphs are very useful to represent a physical situation. Various quantities can be easily represented on graphs and other quantites can be determined from the graph. For example the slope of velocity-time graph represents instantaneous acceleration. For a motion with constant acceleration slope of velocity-time graph is constant. If acceleration is changing with time, slope with change and thus velocity-time graph will be a non-linear curve. Further the area of velocity-time graph gives displacement.
For the above situation let t1 be the time of accelerated motion and t2 be the time or retarded motion, then the correct relation is
View SolutionSlope of a velocity – time graph gives
View SolutionWhat does the slope of a work-time graph represent?
View SolutionWhich graph represents positive acceleration ?
View SolutionWhat does the slope of a displacement-time graph represent?
View Solution
