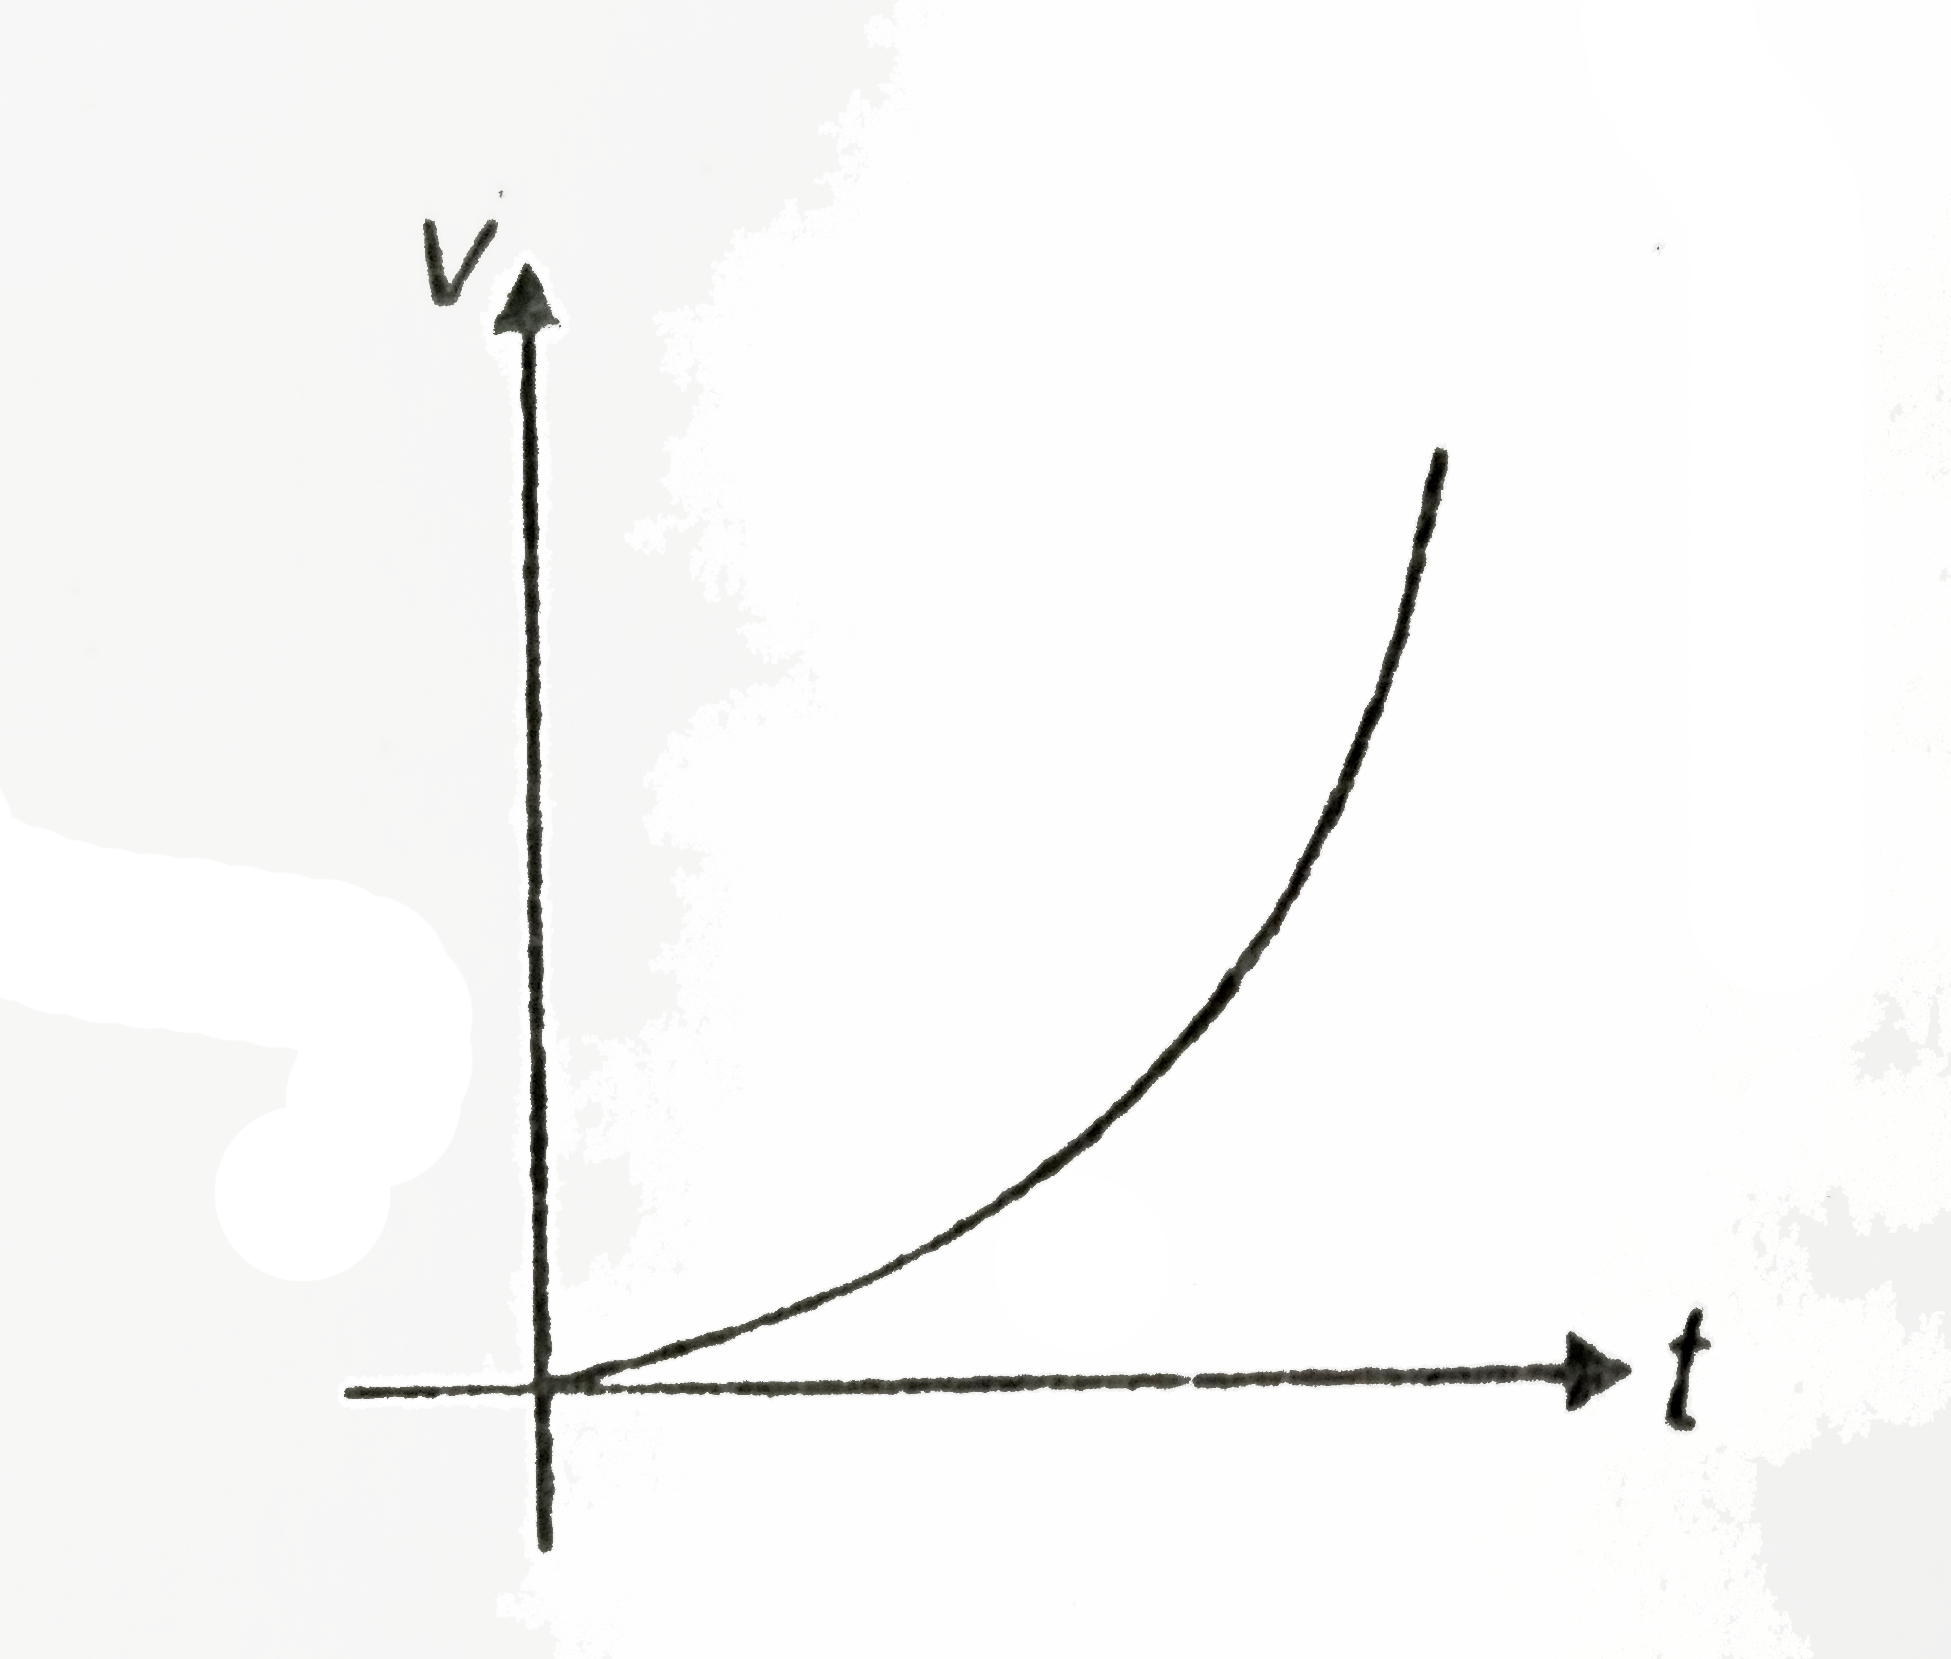
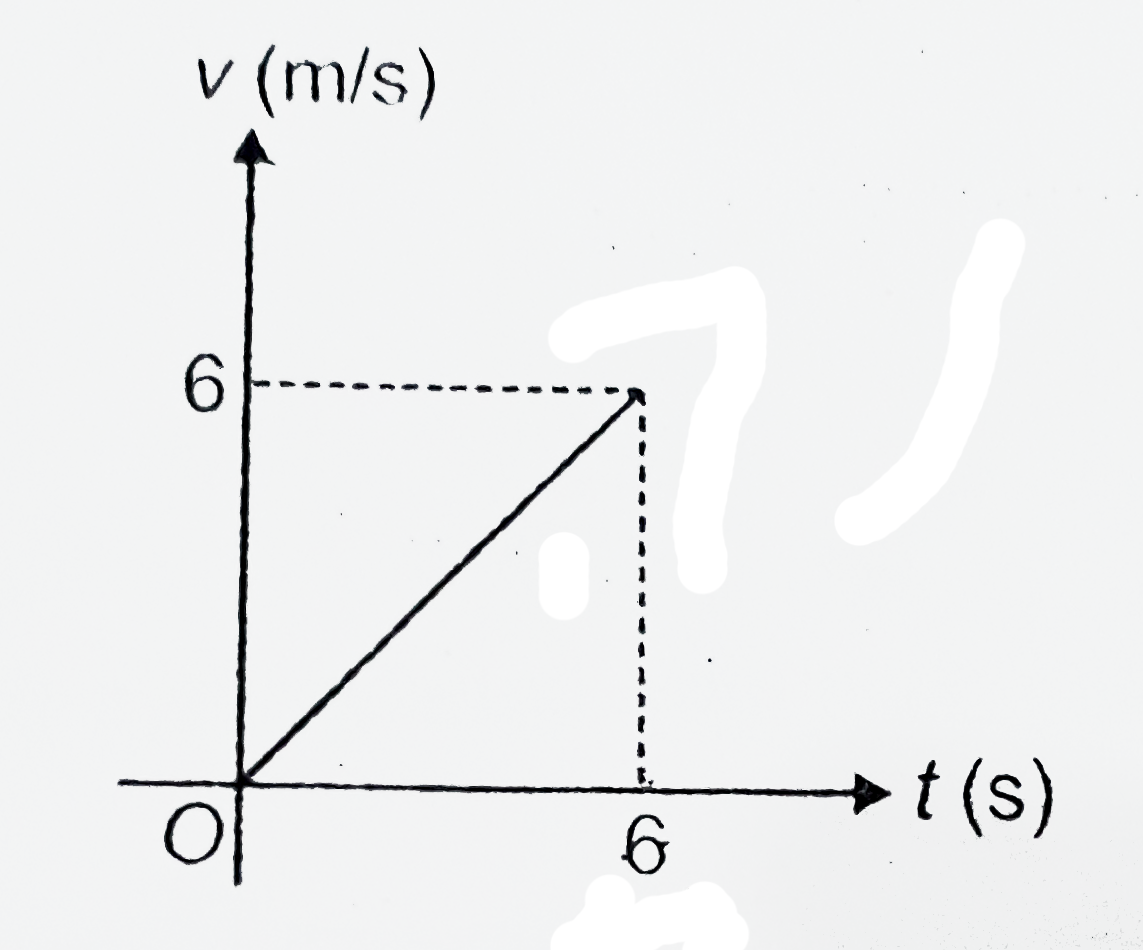
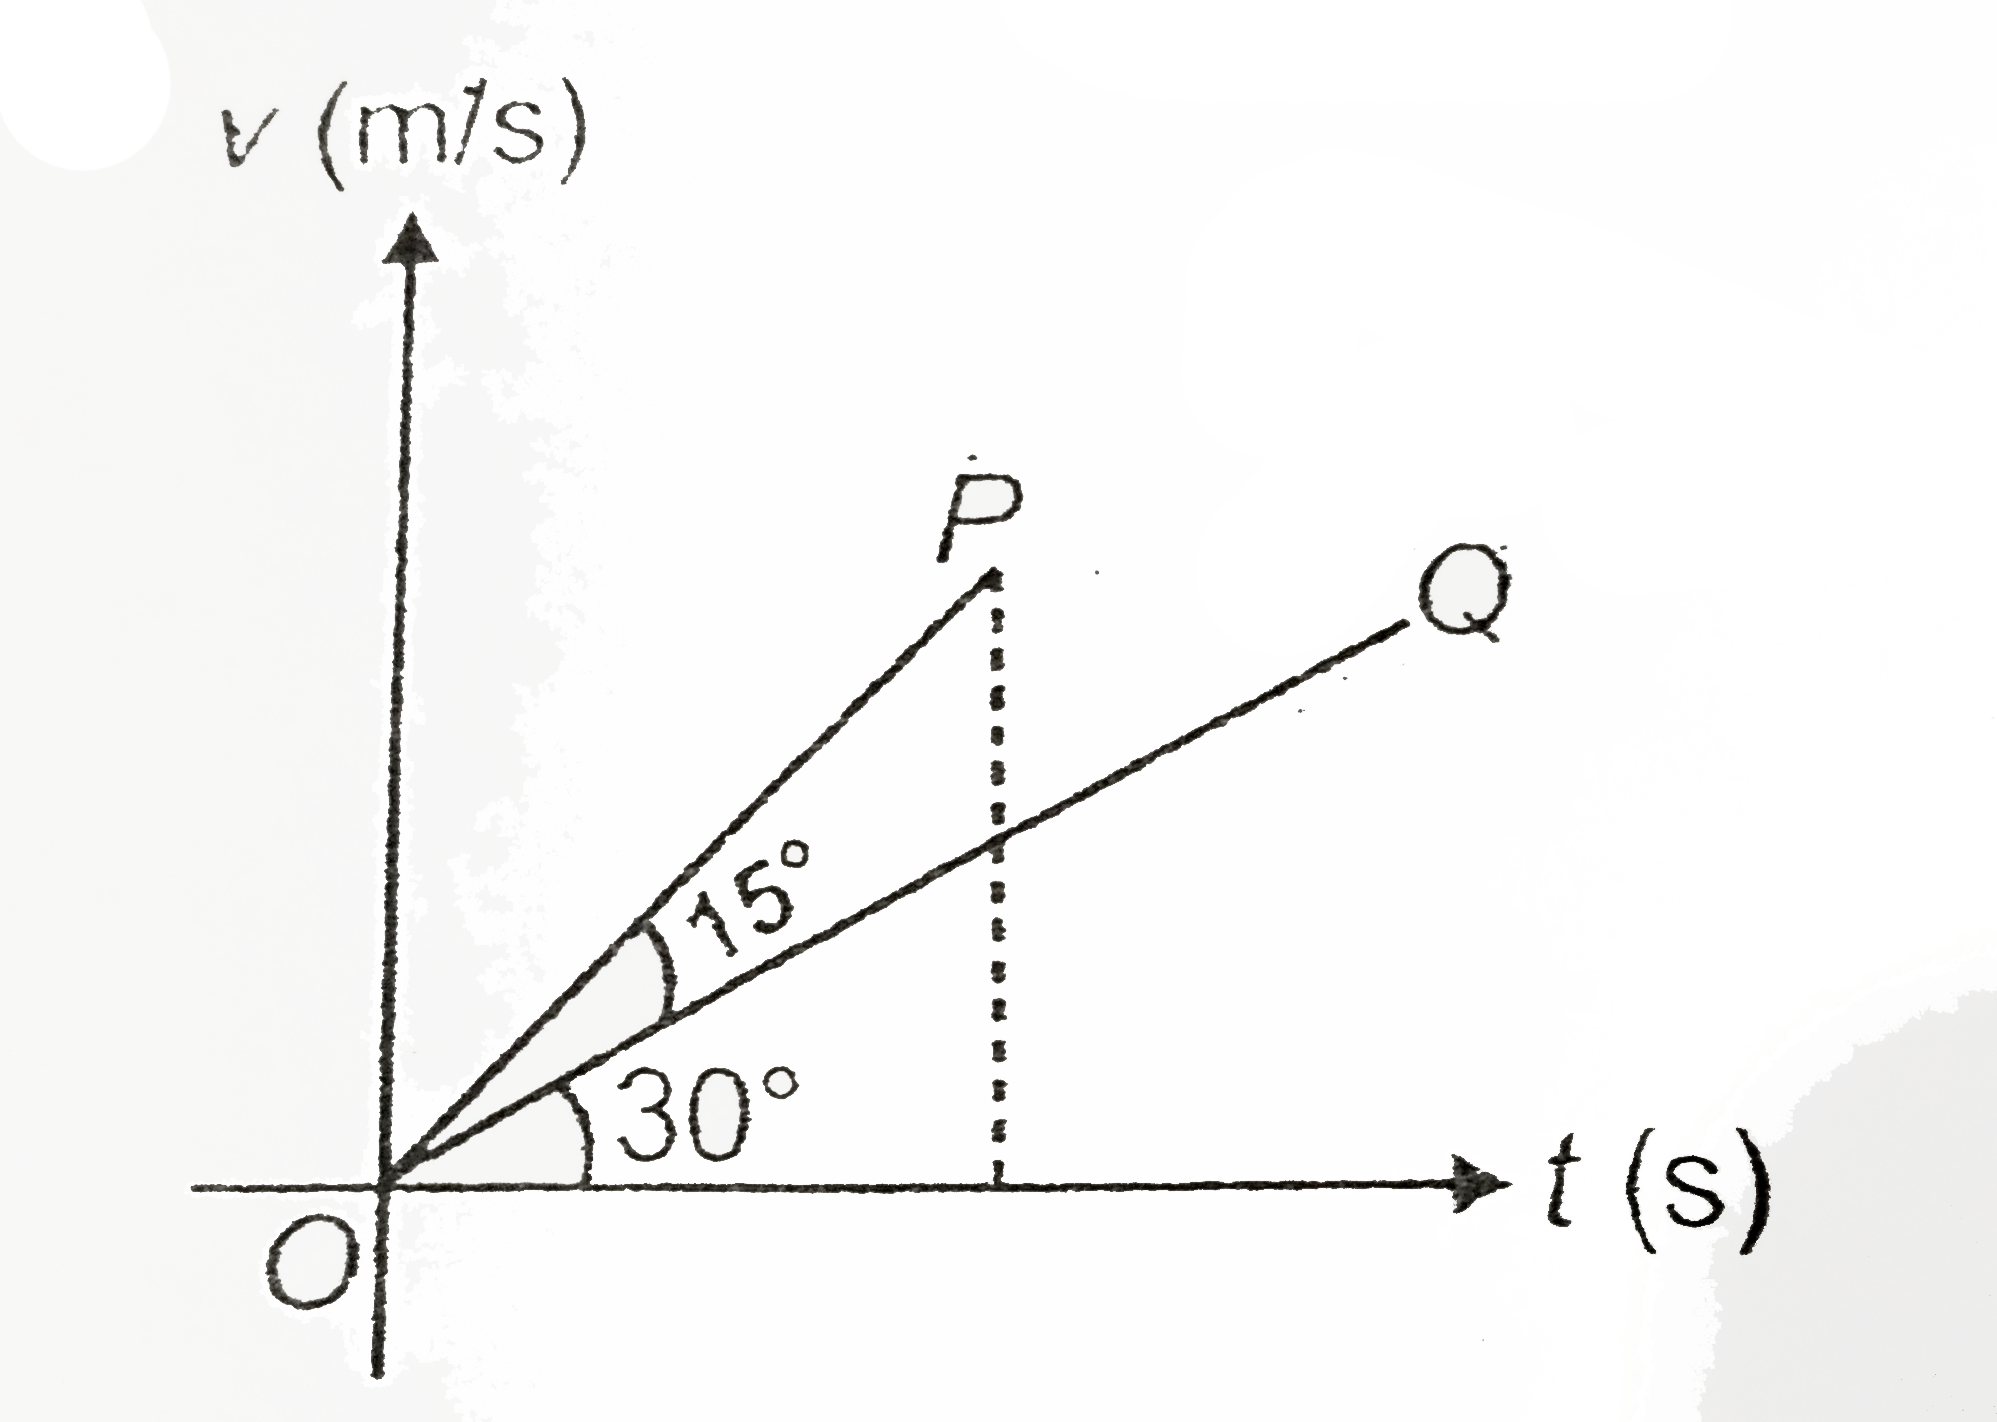
Graphs are very useful to represent a physical situation. Various quantities can be easily represented on graphs and other quantites can be determined from the graph. For example the slope of velocity-time graph represents instantaneous acceleration. For a motion with constant acceleration slope of velocity-time graph is constant. If acceleration is changing with time, slope with change and thus velocity-time graph will be a non-linear curve. Further the area of velocity-time graph gives displacement.
For the above situation let t1 be the time of accelerated motion and t2 be the time or retarded motion, then the correct relation is
a1t2=a2t1
a1t1=a2t2
a1t21=a2t22
a1t22=a2t21
The correct Answer is:B
To solve the problem, we will analyze the motion of an object under two different phases: accelerated motion and retarded motion. We will use the first equation of motion to derive the relationship between the times of these two phases.
1. Define the Variables:
- Let t1 be the time of accelerated motion.
- Let t2 be the time of retarded motion.
- Let a1 be the acceleration during the accelerated motion.
- Let a2 be the retardation (negative acceleration) during the retarded motion.
- Let V0 be the maximum velocity reached after the accelerated motion.
2. Apply the First Equation of Motion for Accelerated Motion:
- The first equation of motion states:
V=u+at
- For the accelerated motion, the initial velocity u=0 (starting from rest), so:
V0=0+a1t1
- This simplifies to:
V0=a1t1(Equation 1)
3. Apply the First Equation of Motion for Retarded Motion:
- In the retarded motion, the initial velocity is V0 and the final velocity is 0 (the object comes to rest). Thus, we have:
0=V0−a2t2
- Rearranging gives:
V0=a2t2(Equation 2)
4. Equate the Two Equations:
- Since both equations equal V0, we can set them equal to each other:
a1t1=a2t2
5. Final Relation:
- The final relation between the acceleration during the accelerated motion and the retardation during the retarded motion, along with their respective times, is:
a1t1=a2t2
6. Conclusion:
- The correct relation between the times of accelerated motion and retarded motion is given by the equation derived above.
- Let t1 be the time of accelerated motion.
- Let t2 be the time of retarded motion.
- Let a1 be the acceleration during the accelerated motion.
- Let a2 be the retardation (negative acceleration) during the retarded motion.
- Let V0 be the maximum velocity reached after the accelerated motion.
- The first equation of motion states:
V=u+at
- For the accelerated motion, the initial velocity u=0 (starting from rest), so:
V0=0+a1t1
- This simplifies to:
V0=a1t1(Equation 1)
- In the retarded motion, the initial velocity is V0 and the final velocity is 0 (the object comes to rest). Thus, we have:
0=V0−a2t2
- Rearranging gives:
V0=a2t2(Equation 2)
- Since both equations equal V0, we can set them equal to each other:
a1t1=a2t2
- The final relation between the acceleration during the accelerated motion and the retardation during the retarded motion, along with their respective times, is:
a1t1=a2t2
- The correct relation between the times of accelerated motion and retarded motion is given by the equation derived above.
Topper's Solved these Questions
- MOTION IN STRAIGHT LINEBOOK - AAKASH INSTITUTE ENGLISHCHAPTER - MOTION IN STRAIGHT LINEEXERCISE - Assignment (SECTION - E)
8 Videos
- MOTION IN STRAIGHT LINEBOOK - AAKASH INSTITUTE ENGLISHCHAPTER - MOTION IN STRAIGHT LINEEXERCISE - Assignment (SECTION - F)
2 Videos
- MOTION IN STRAIGHT LINEBOOK - AAKASH INSTITUTE ENGLISHCHAPTER - MOTION IN STRAIGHT LINEEXERCISE - Assignment (SECTION - C)
7 Videos
- MOTION IN A STRAIGHT LINEBOOK - AAKASH INSTITUTE ENGLISHCHAPTER - MOTION IN A STRAIGHT LINEEXERCISE - ASSIGNMENT (SECTION - D)
15 Videos
- MOVING CHARGE AND MAGNESIUMBOOK - AAKASH INSTITUTE ENGLISHCHAPTER - MOVING CHARGE AND MAGNESIUMEXERCISE - SECTION D
16 Videos
Similar Questions
Graphs are very useful to represent a physical situation. Various quantities can be easily represented on graphs and other quantites can be determined from the graph. For example the slope of velocity-time graph represents instantaneous acceleration. For a motion with constant acceleration slope of velocity-time graph is constant. If acceleration is changing with time, slope with change and thus velocity-time graph will be a non-linear curve. Further the area of velocity-time graph gives displacement.
The average velocity of the car for the entire trip is
View SolutionGraphs are very useful to represent a physical situation. Various quantities can be easily represented on graphs and other quantites can be determined from the graph. For example the slope of velocity-time graph represents instantaneous acceleration. For a motion with constant acceleration slope of velocity-time graph is constant. If acceleration is changing with time, slope will change and thus velocity-time graph will be a non-linear curve. Further the area of velocity-time graph gives displacement.
The correct relation between v0,a1,a2andt0 is
View SolutionGraphs are very useful to represent a physical situation. Various quantities can be easily represented on graphs and other quantites can be determined from the graph. For example the slope of velocity-time graph represents instantaneous acceleration. For a motion with constant acceleration slope of velocity-time graph is constant. If acceleration is changing with time, slope will change and thus velocity-time graph will be a non-linear curve. Further the area of velocity-time graph gives displacement.
For the given velocity-time graph the possibly correct acceleration-time relationship is

View SolutionGraphs are very useful to represent a physical situation. Various quantities can be easily represented on graphs and other quantites can be determined from the graph. For example the slope of velocity-time graph represents instantaneous acceleration. For a motion with constant acceleration slope of velocity-time graph is constant. If acceleration is changing with time, slope will change and thus velocity-time graph will be a non-linear curve. Further the area of velocity-time graph gives displacement.
For the given velocity-time graph the displacement of the object between t = 2 s to t = 4 s is

View SolutionGraphs are very useful to represent a physical situation. Various quantities can be easily represented on graphs and other quantites can be determined from the graph. For example the slope of velocity-time graph represents instantaneous acceleration. For a motion with constant acceleration slope of velocity-time graph is constant. If acceleration is changing with time, slope with change and thus velocity-time graph will be a non-linear curve. Further the area of velocity-time graph gives displacement.
The velocity-time graph for two objects P and Q are shown. The ratio of their respective acceleration is

View SolutionGraphs are very useful to represent a physical situation. Various quantities can be easily represented on graphs and other quantites can be determined from the graph. For example the slope of velocity-time graph represents instantaneous acceleration. For a motion with constant acceleration slope of velocity-time graph is constant. If acceleration is changing with time, slope with change and thus velocity-time graph will be a non-linear curve. Further the area of velocity-time graph gives displacement.
A car starts from rest with a constant acceleration a1 for some time and attains a velocity v0. Then it immediately retards at a constant rate a2 to rest. The total time to journey is t0 Identify the correct velocity-time graph
View SolutionSlope of a velocity – time graph gives
View SolutionWhat does the slope of a work-time graph represent?
View SolutionWhich graph represents positive acceleration ?
View SolutionWhat does the slope of a displacement-time graph represent?
View Solution
