Which of the following graphs represents stress-strain variation for elastomers?
A
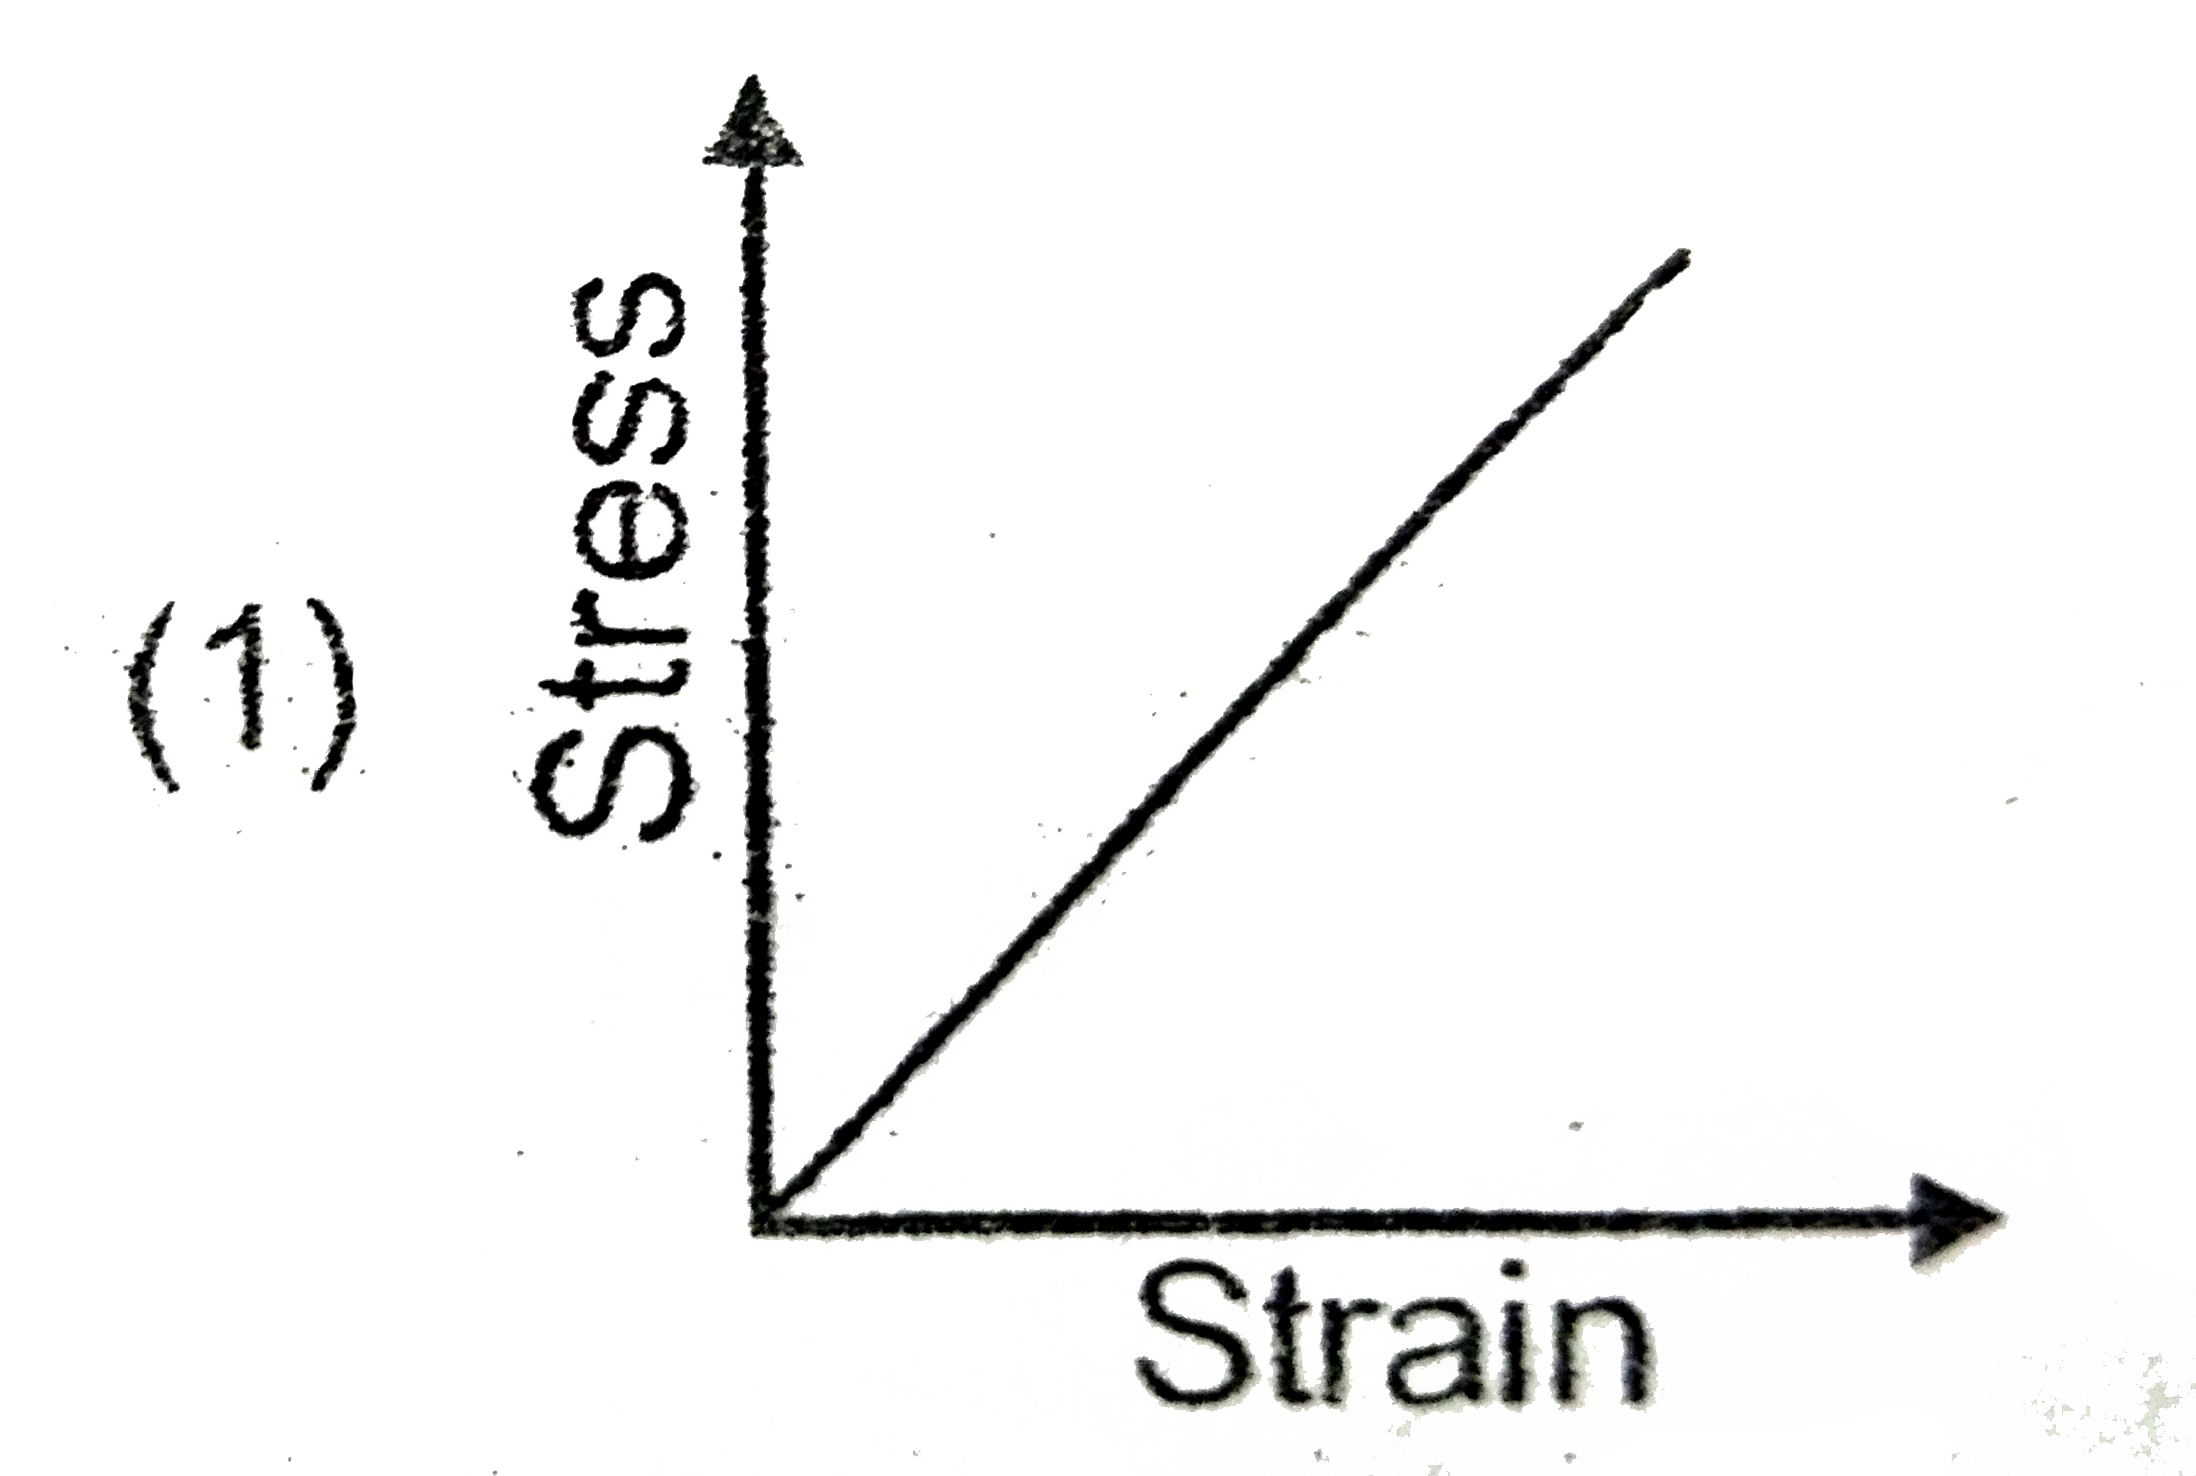
B
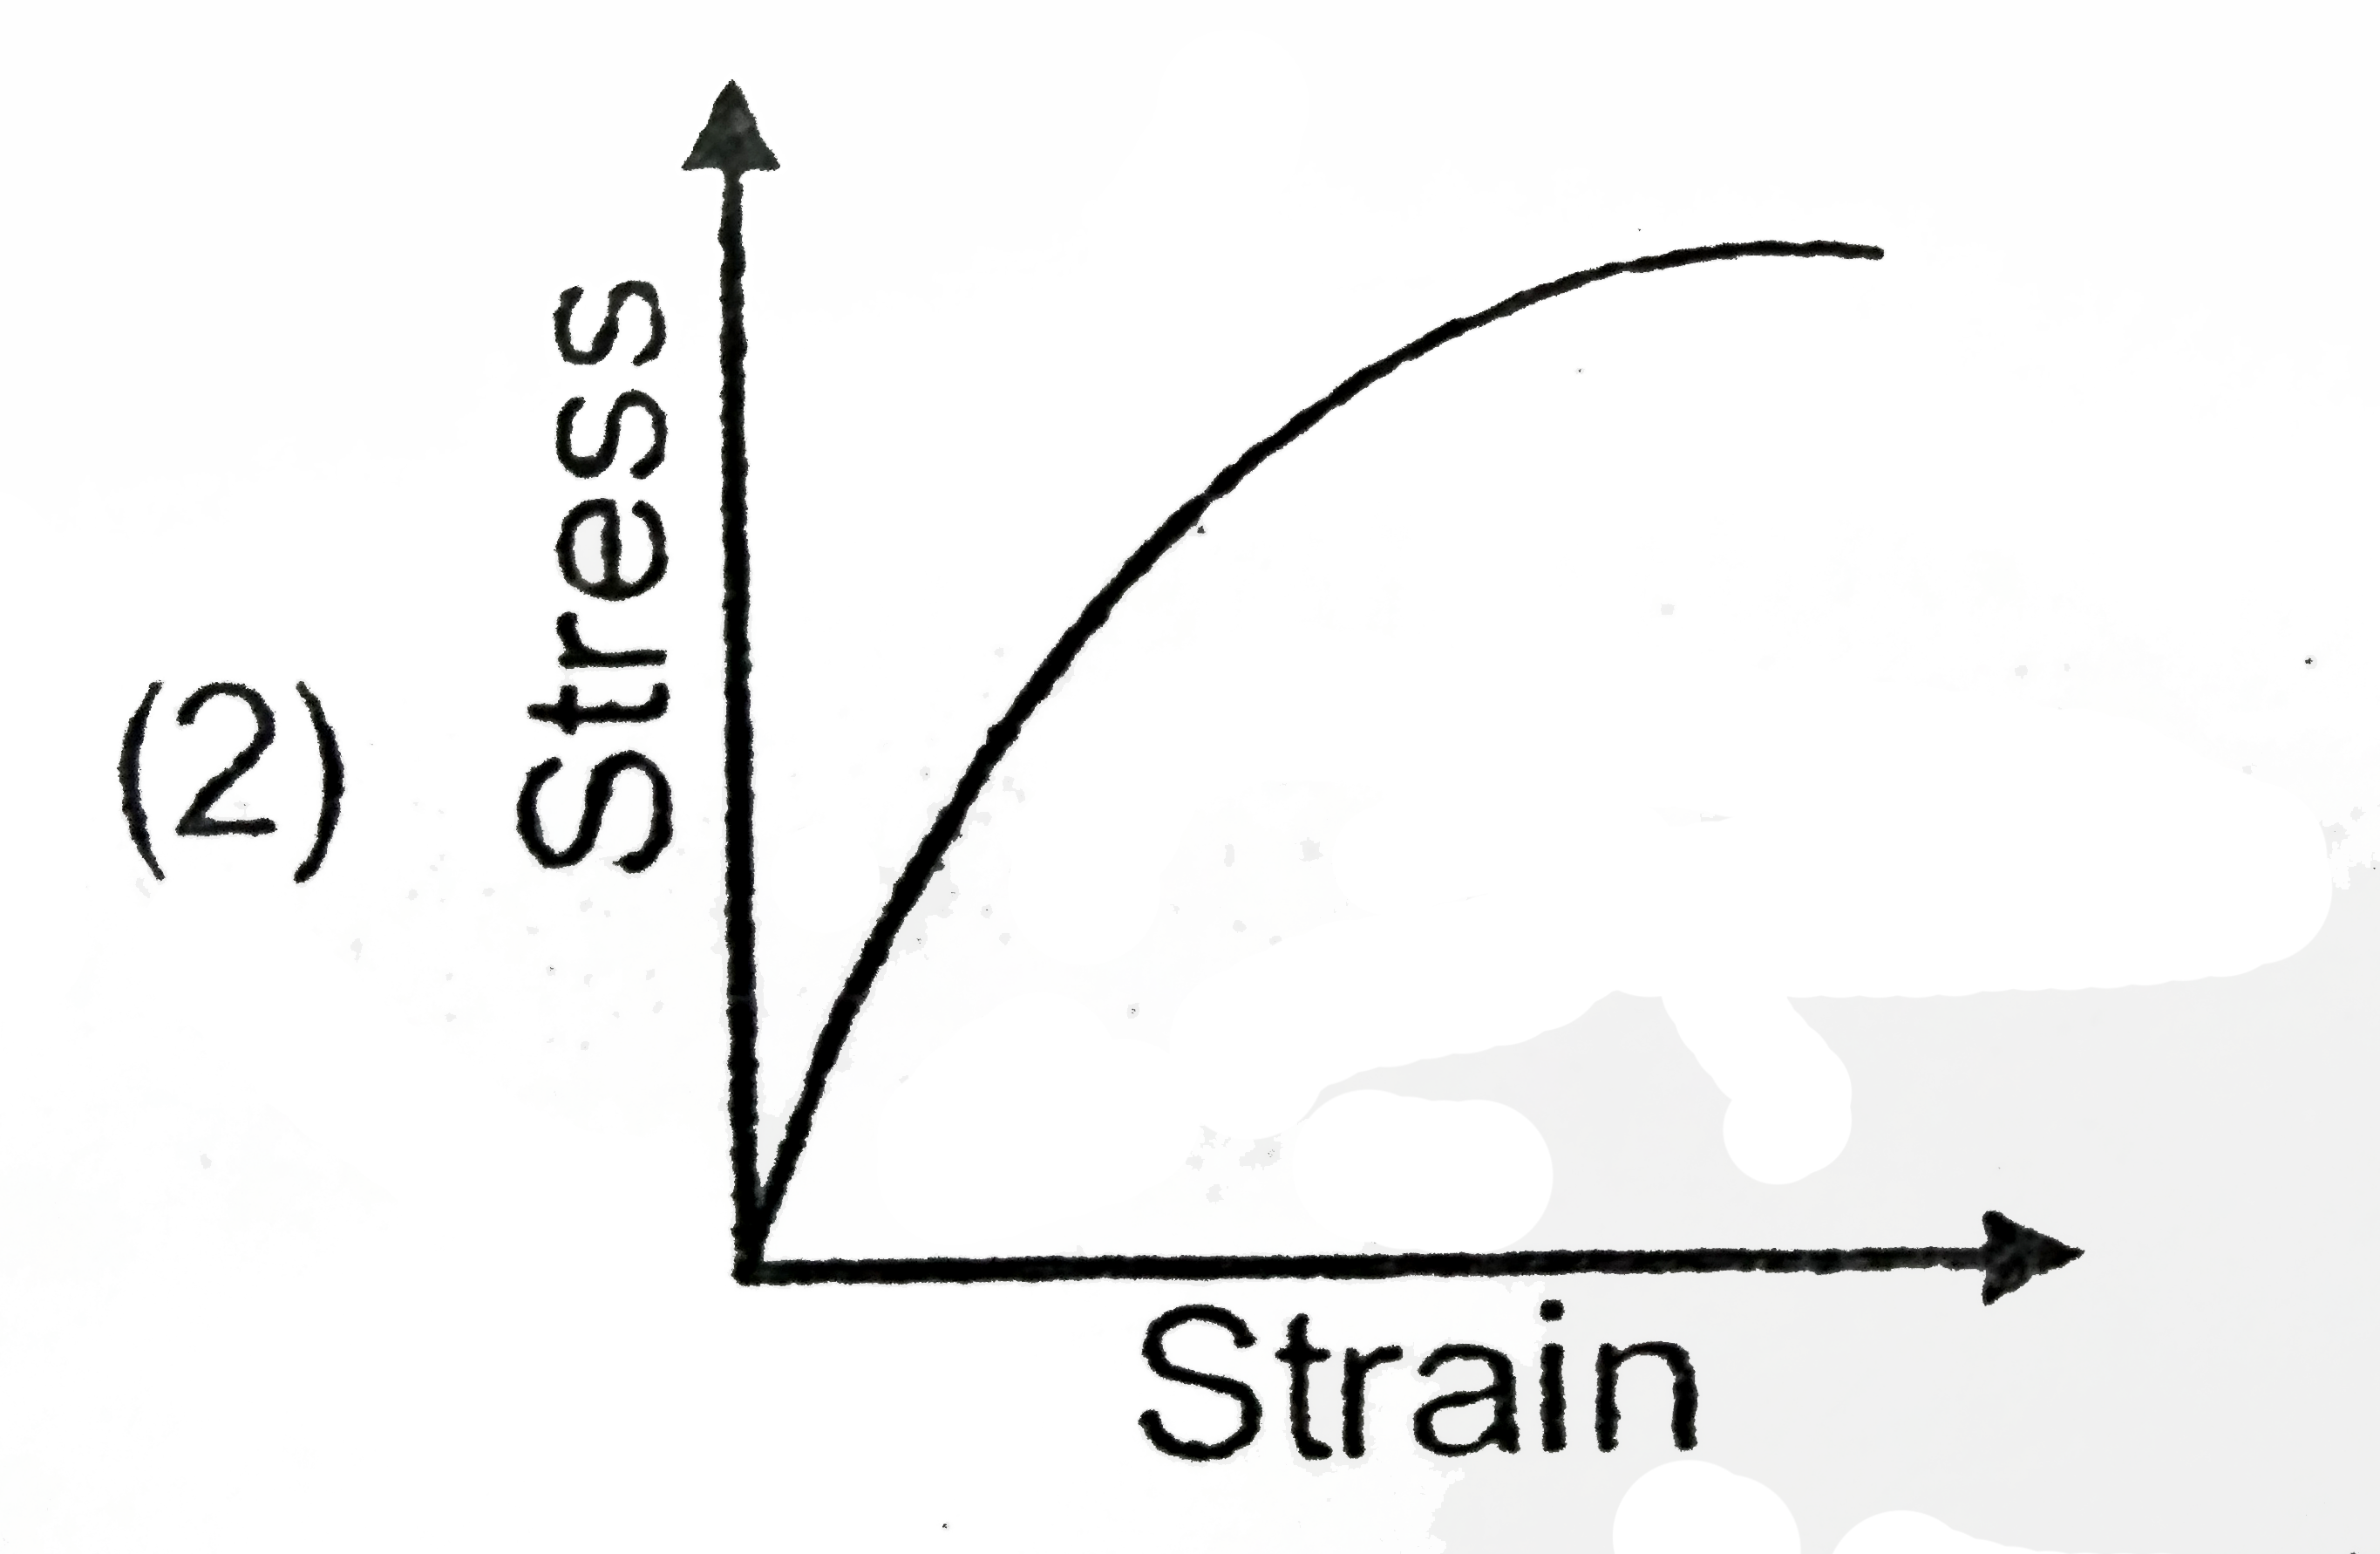
C
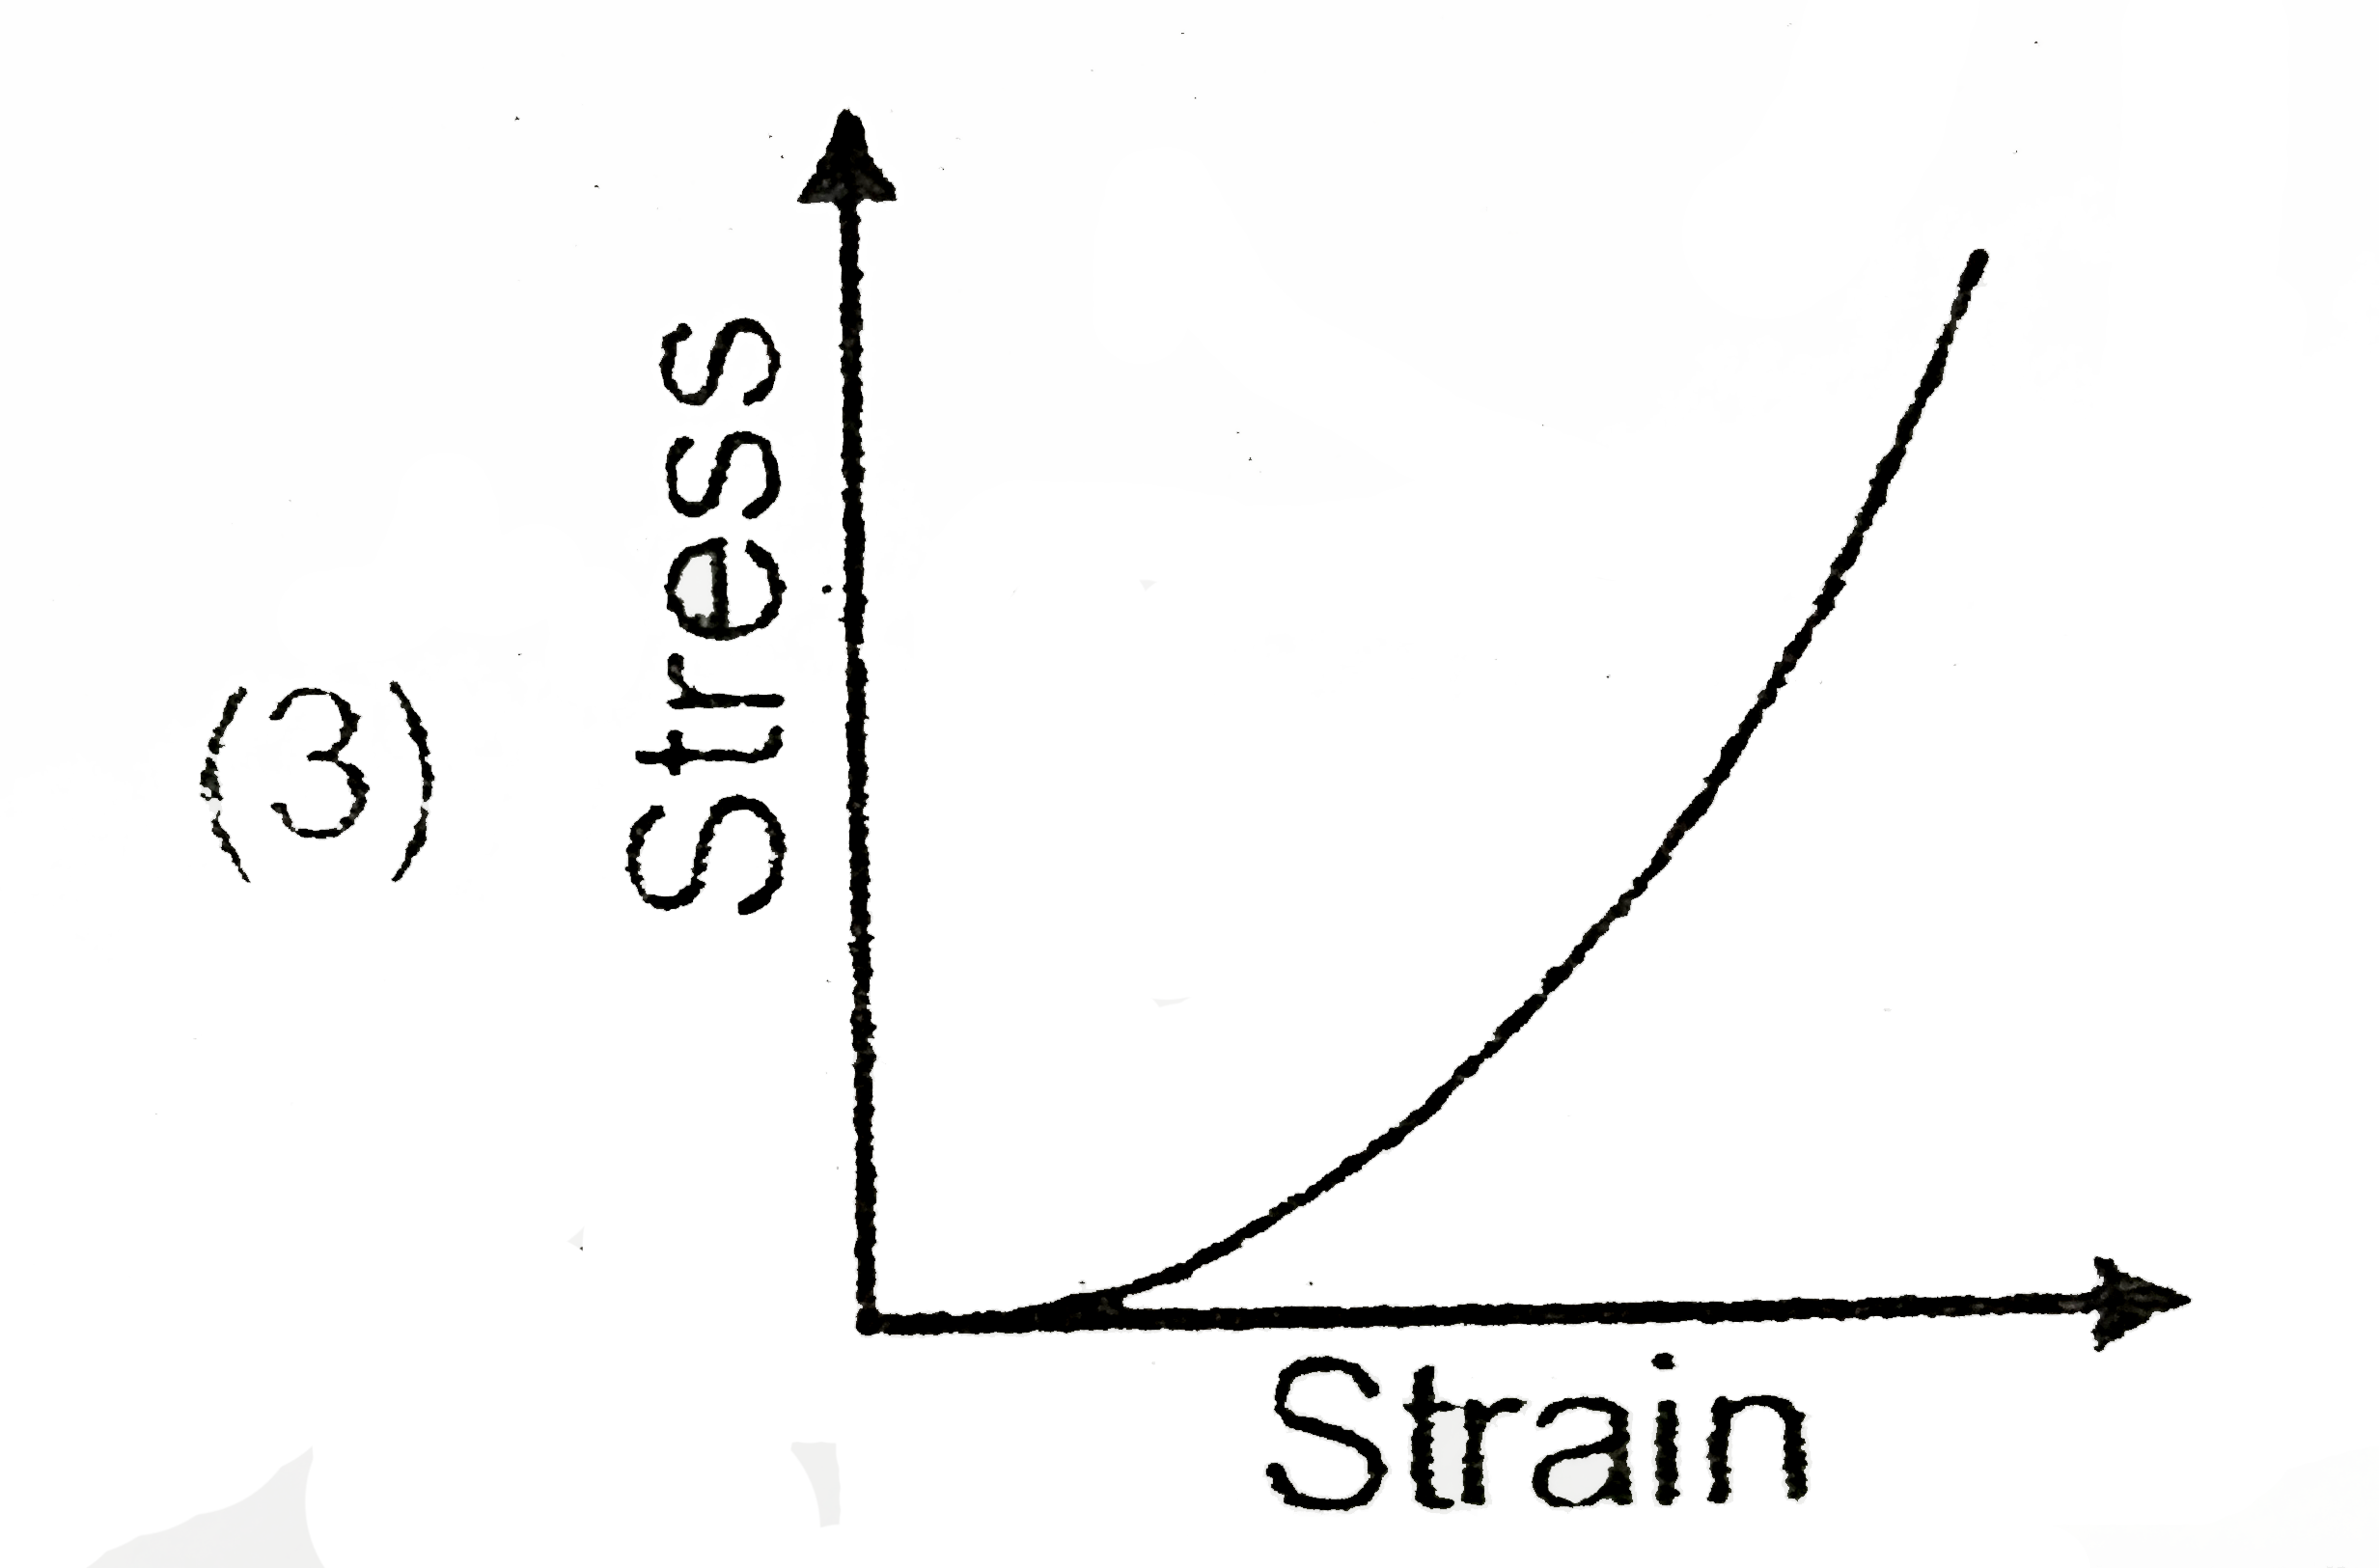
D
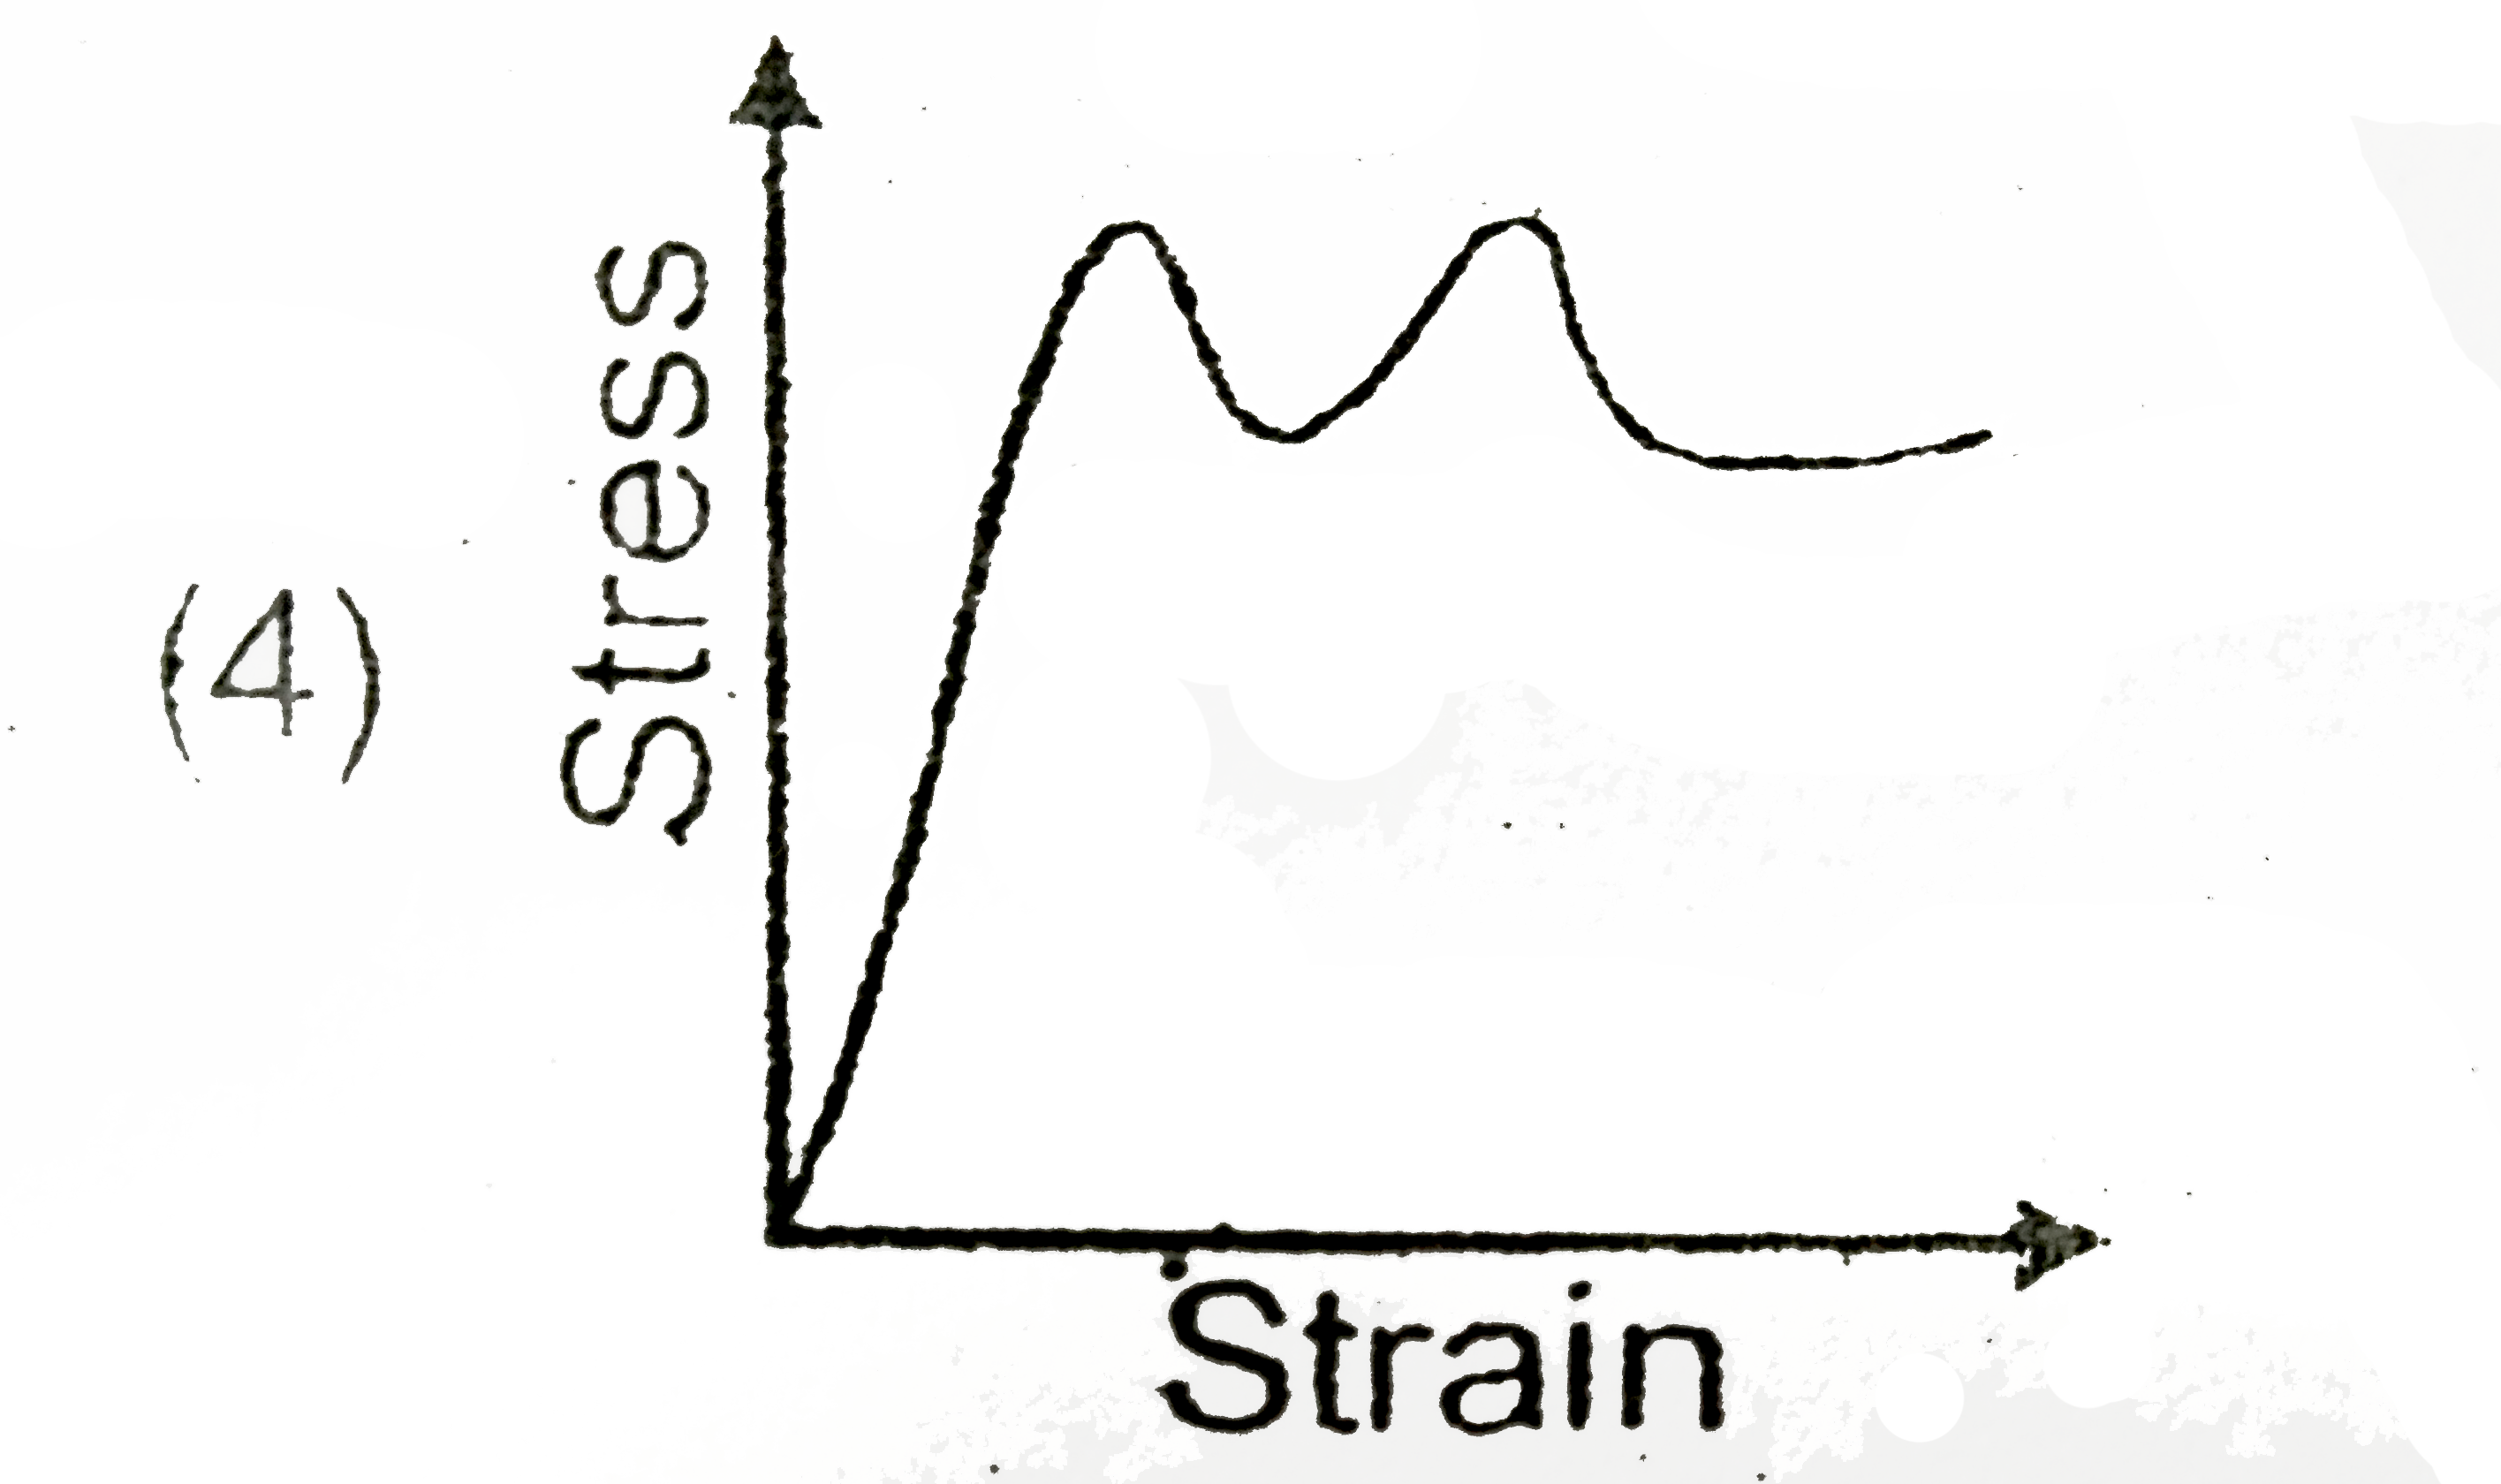
Video Solution
Text Solution
The correct Answer is:C
|
Answer
Step by step video & image solution for Which of the following graphs represents stress-strain variation for elastomers? by Physics experts to help you in doubts & scoring excellent marks in Class 12 exams.
Updated on:21/07/2023Topper's Solved these Questions
- MECHANICAL PROPERTIES OF SOLIDSBOOK - AAKASH INSTITUTE ENGLISHCHAPTER - MECHANICAL PROPERTIES OF SOLIDSEXERCISE - Assignment (SECTION - B)
15 Videos
- MECHANICAL PROPERTIES OF SOLIDSBOOK - AAKASH INSTITUTE ENGLISHCHAPTER - MECHANICAL PROPERTIES OF SOLIDSEXERCISE - Assignment (SECTION - C)
2 Videos
- MECHANICAL PROPERTIES OF SOLIDSBOOK - AAKASH INSTITUTE ENGLISHCHAPTER - MECHANICAL PROPERTIES OF SOLIDSEXERCISE - Try Yourself
32 Videos
- MECHANICAL PROPERTIES OF FLUIDSBOOK - AAKASH INSTITUTE ENGLISHCHAPTER - MECHANICAL PROPERTIES OF FLUIDSEXERCISE - SECTION - J
9 Videos
- Mock test 03BOOK - AAKASH INSTITUTE ENGLISHCHAPTER - Mock test 03EXERCISE - EXAMPLE
44 Videos
Similar Questions
Knowledge Check
Which of the following is the graph showing stress-strain variation for elastomers ?
A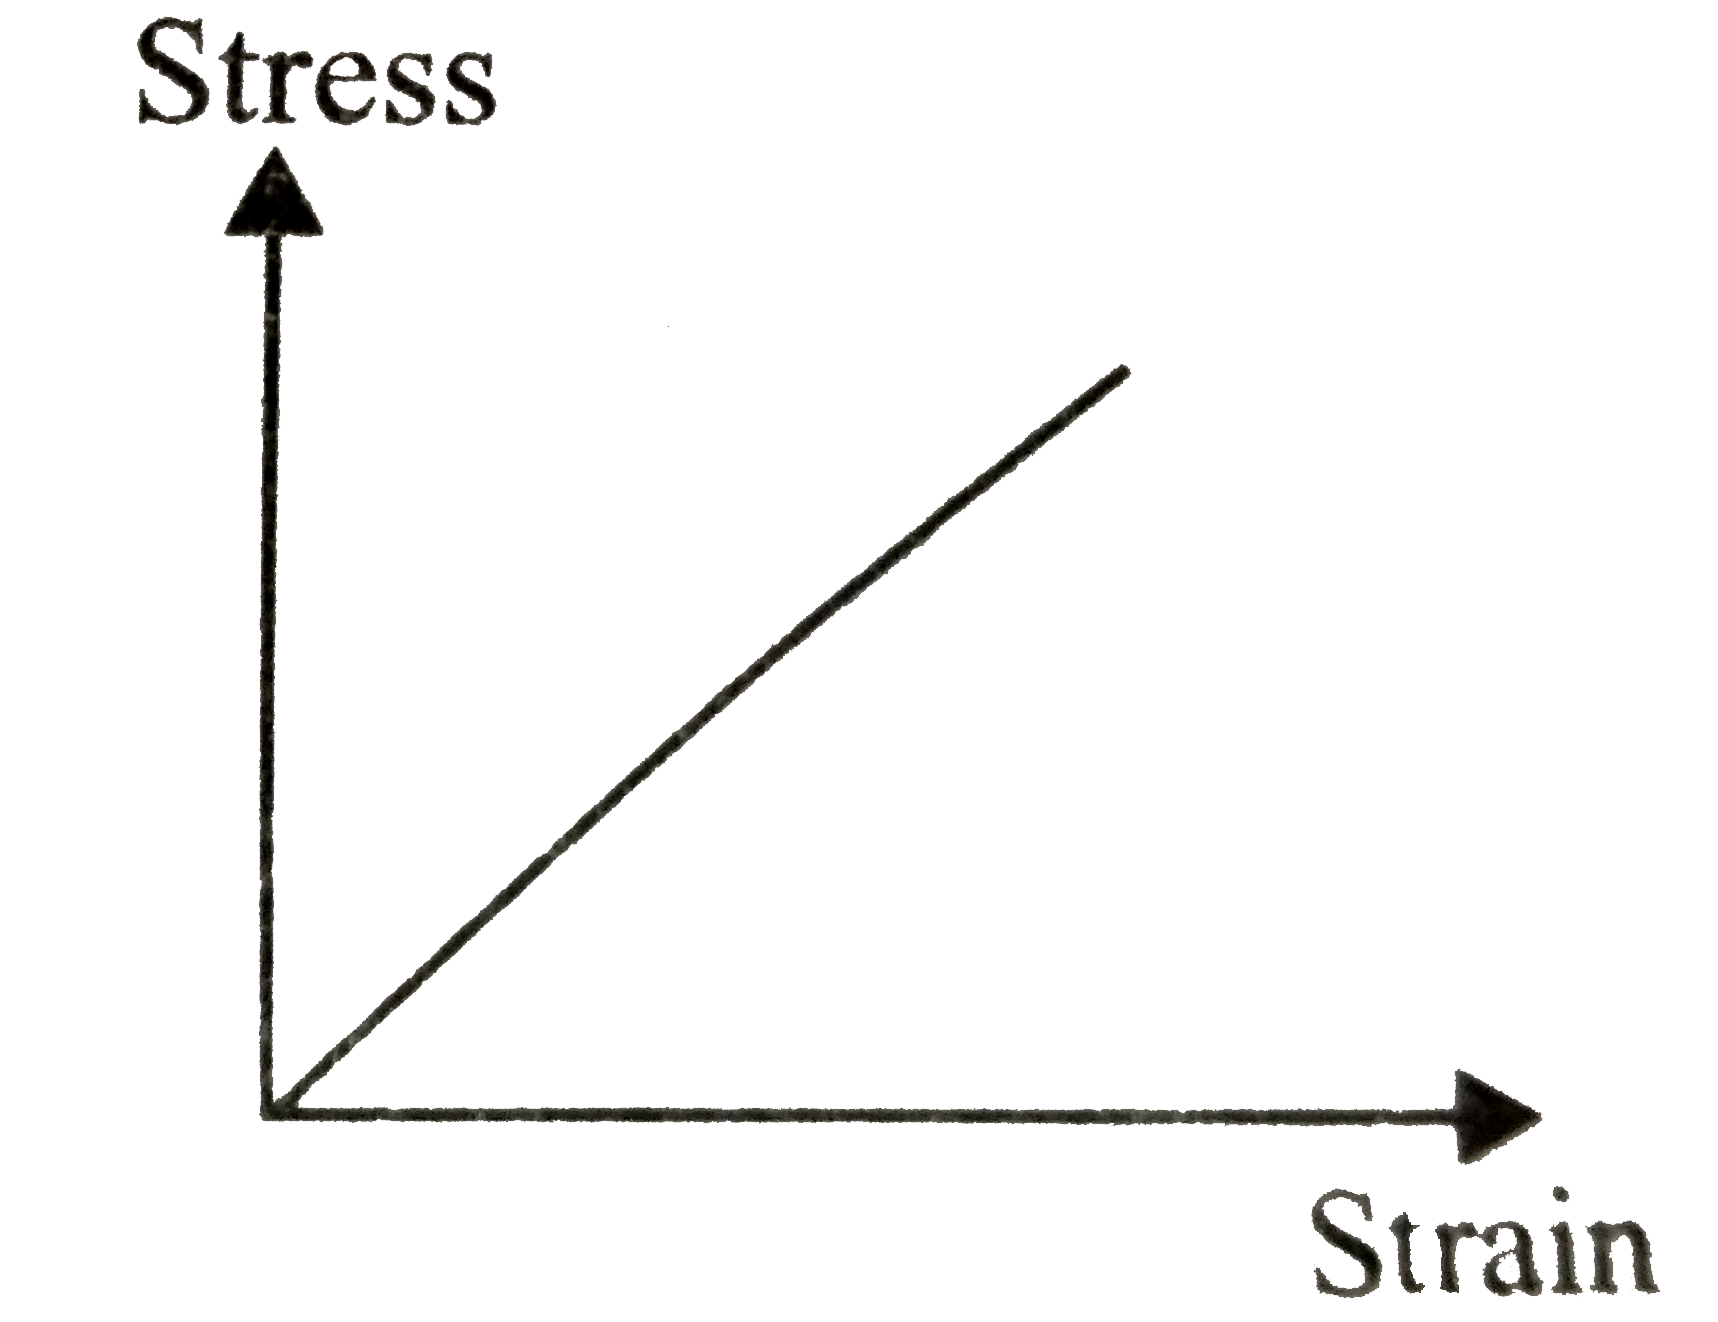 B
B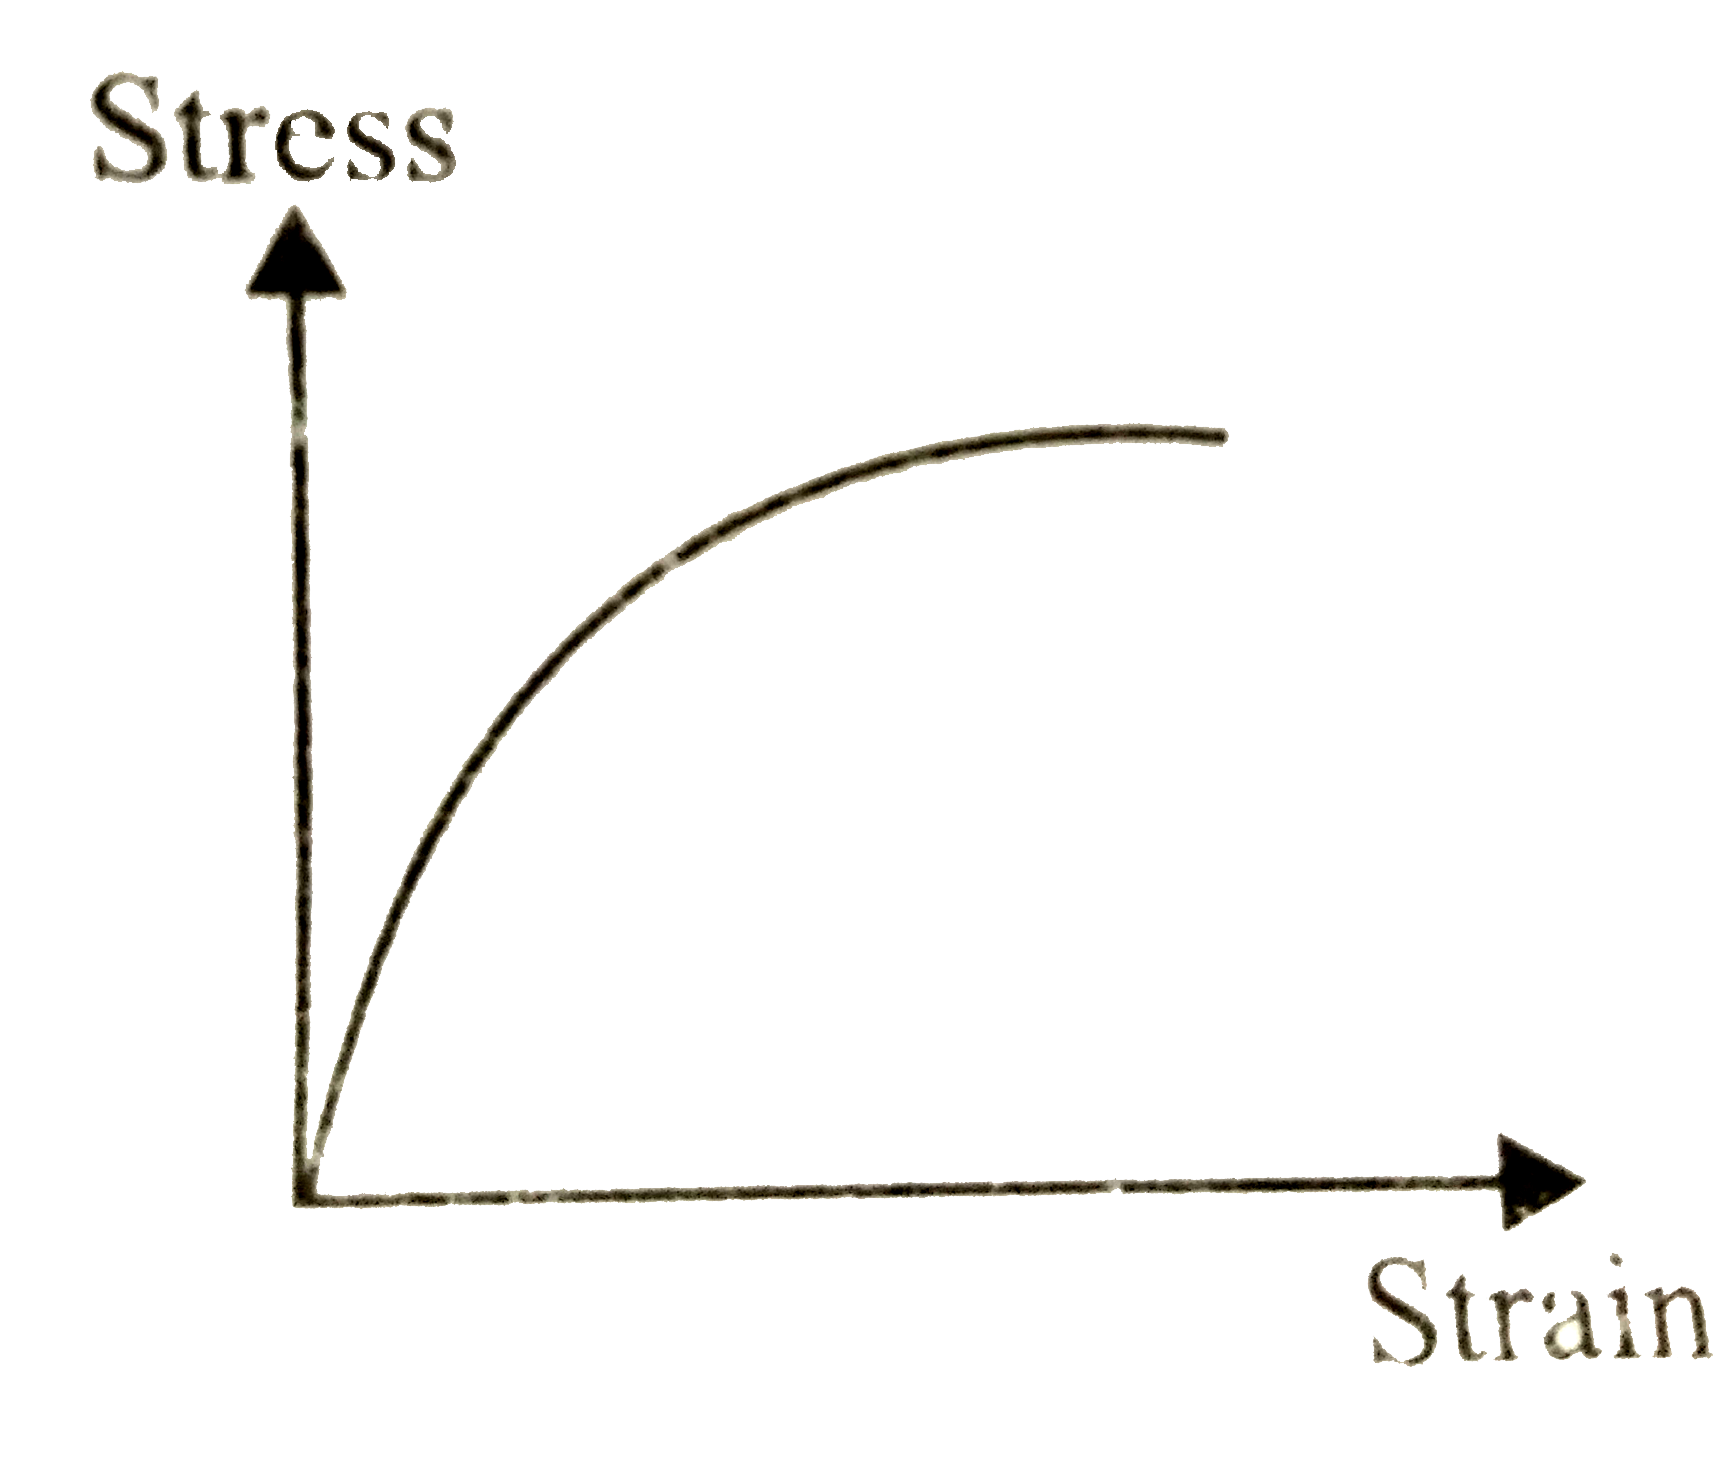 C
C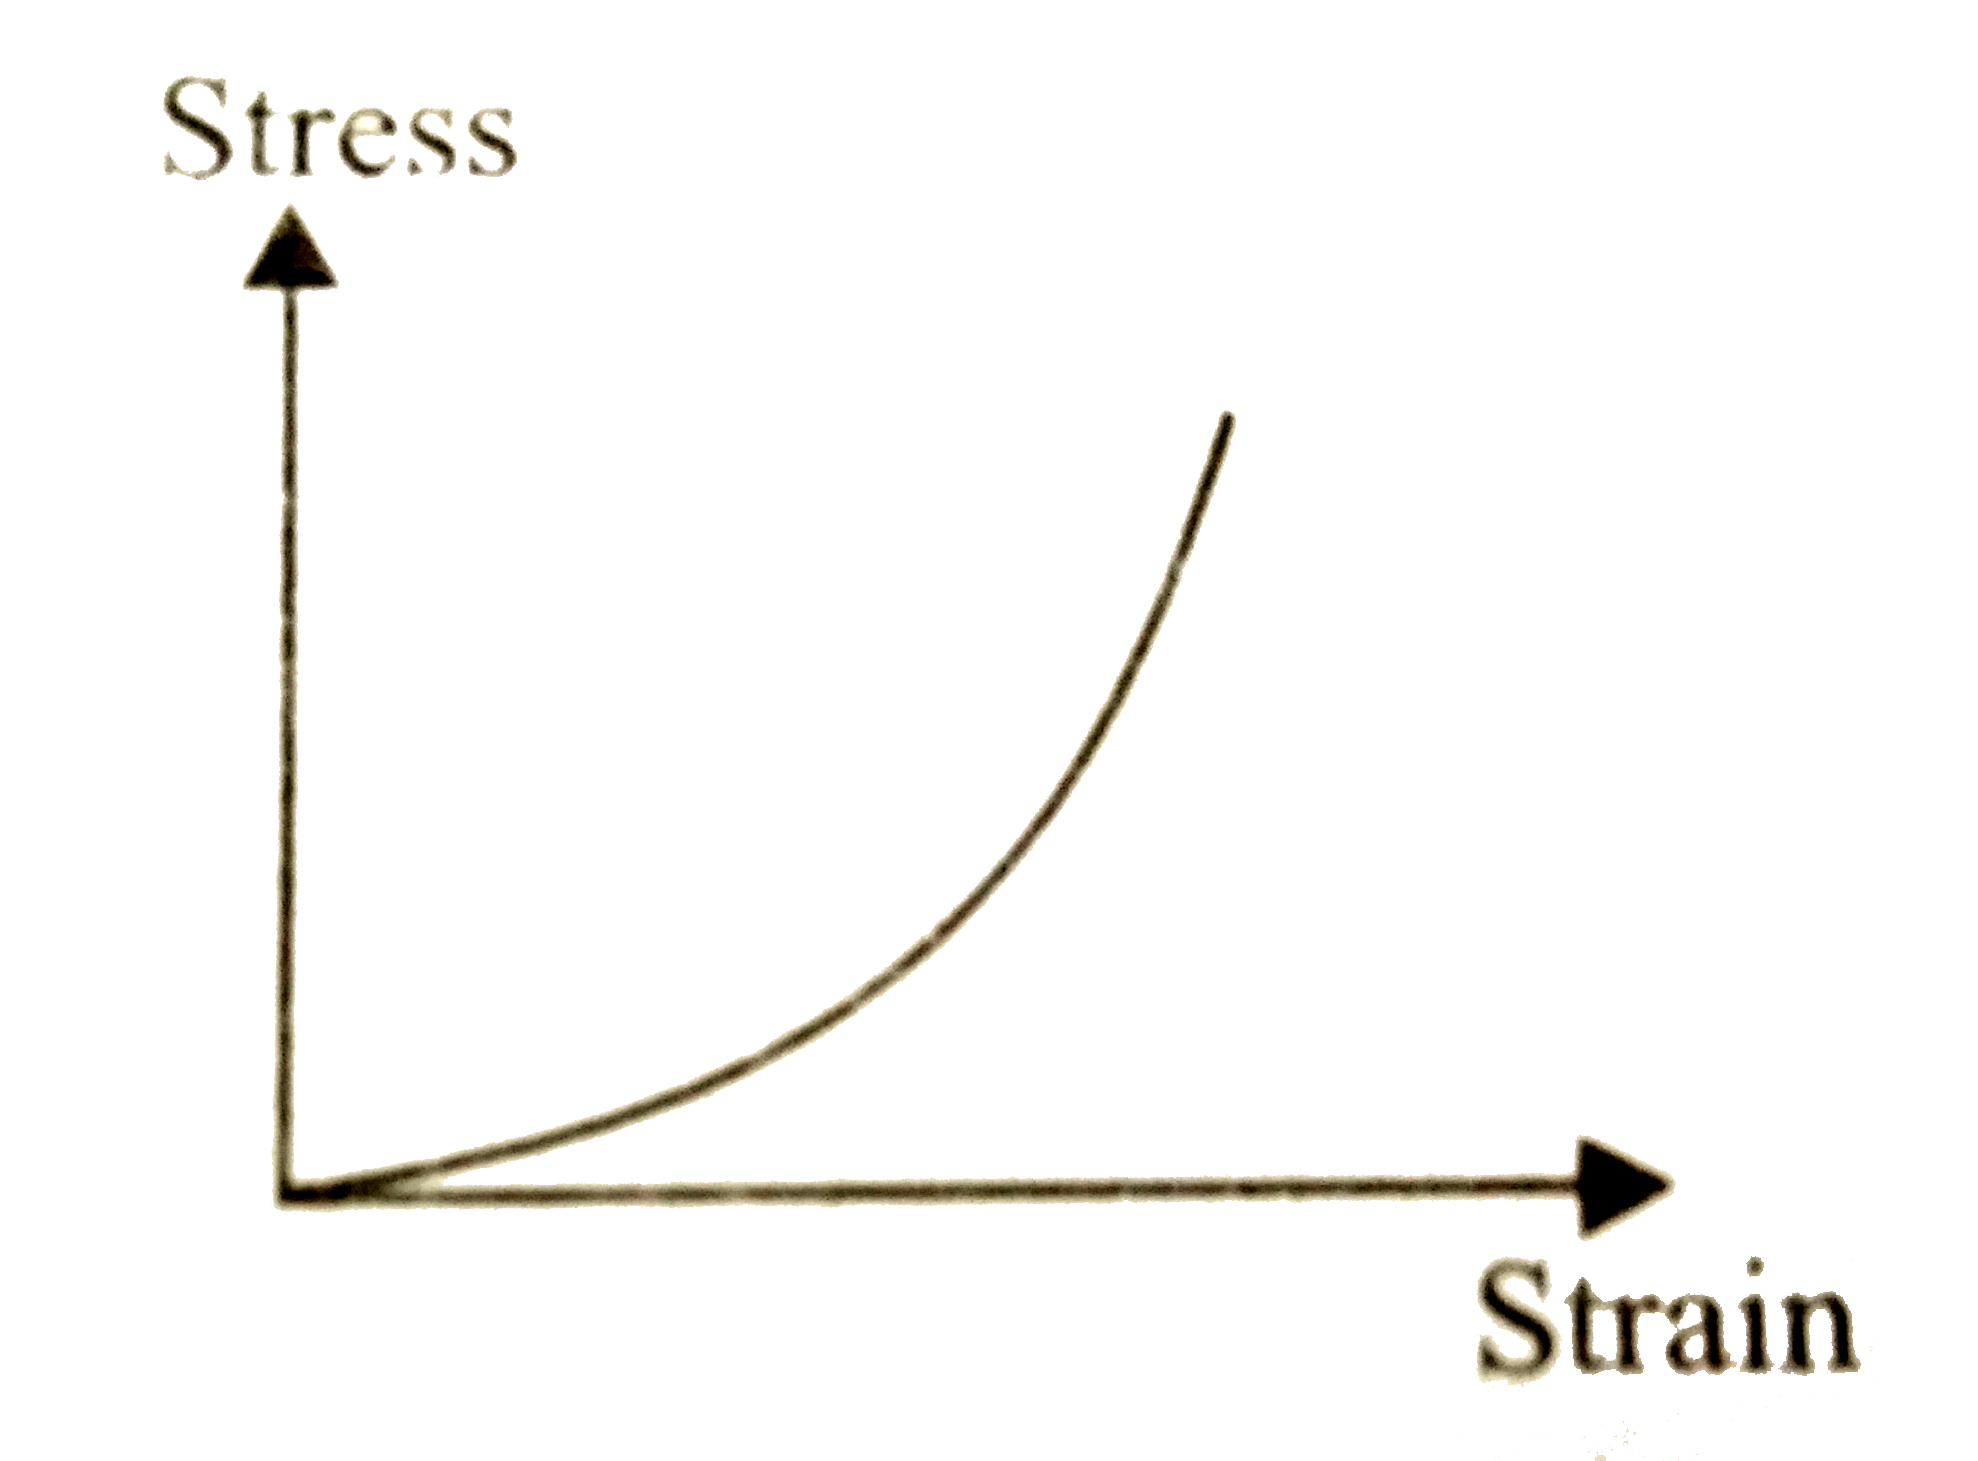 D
D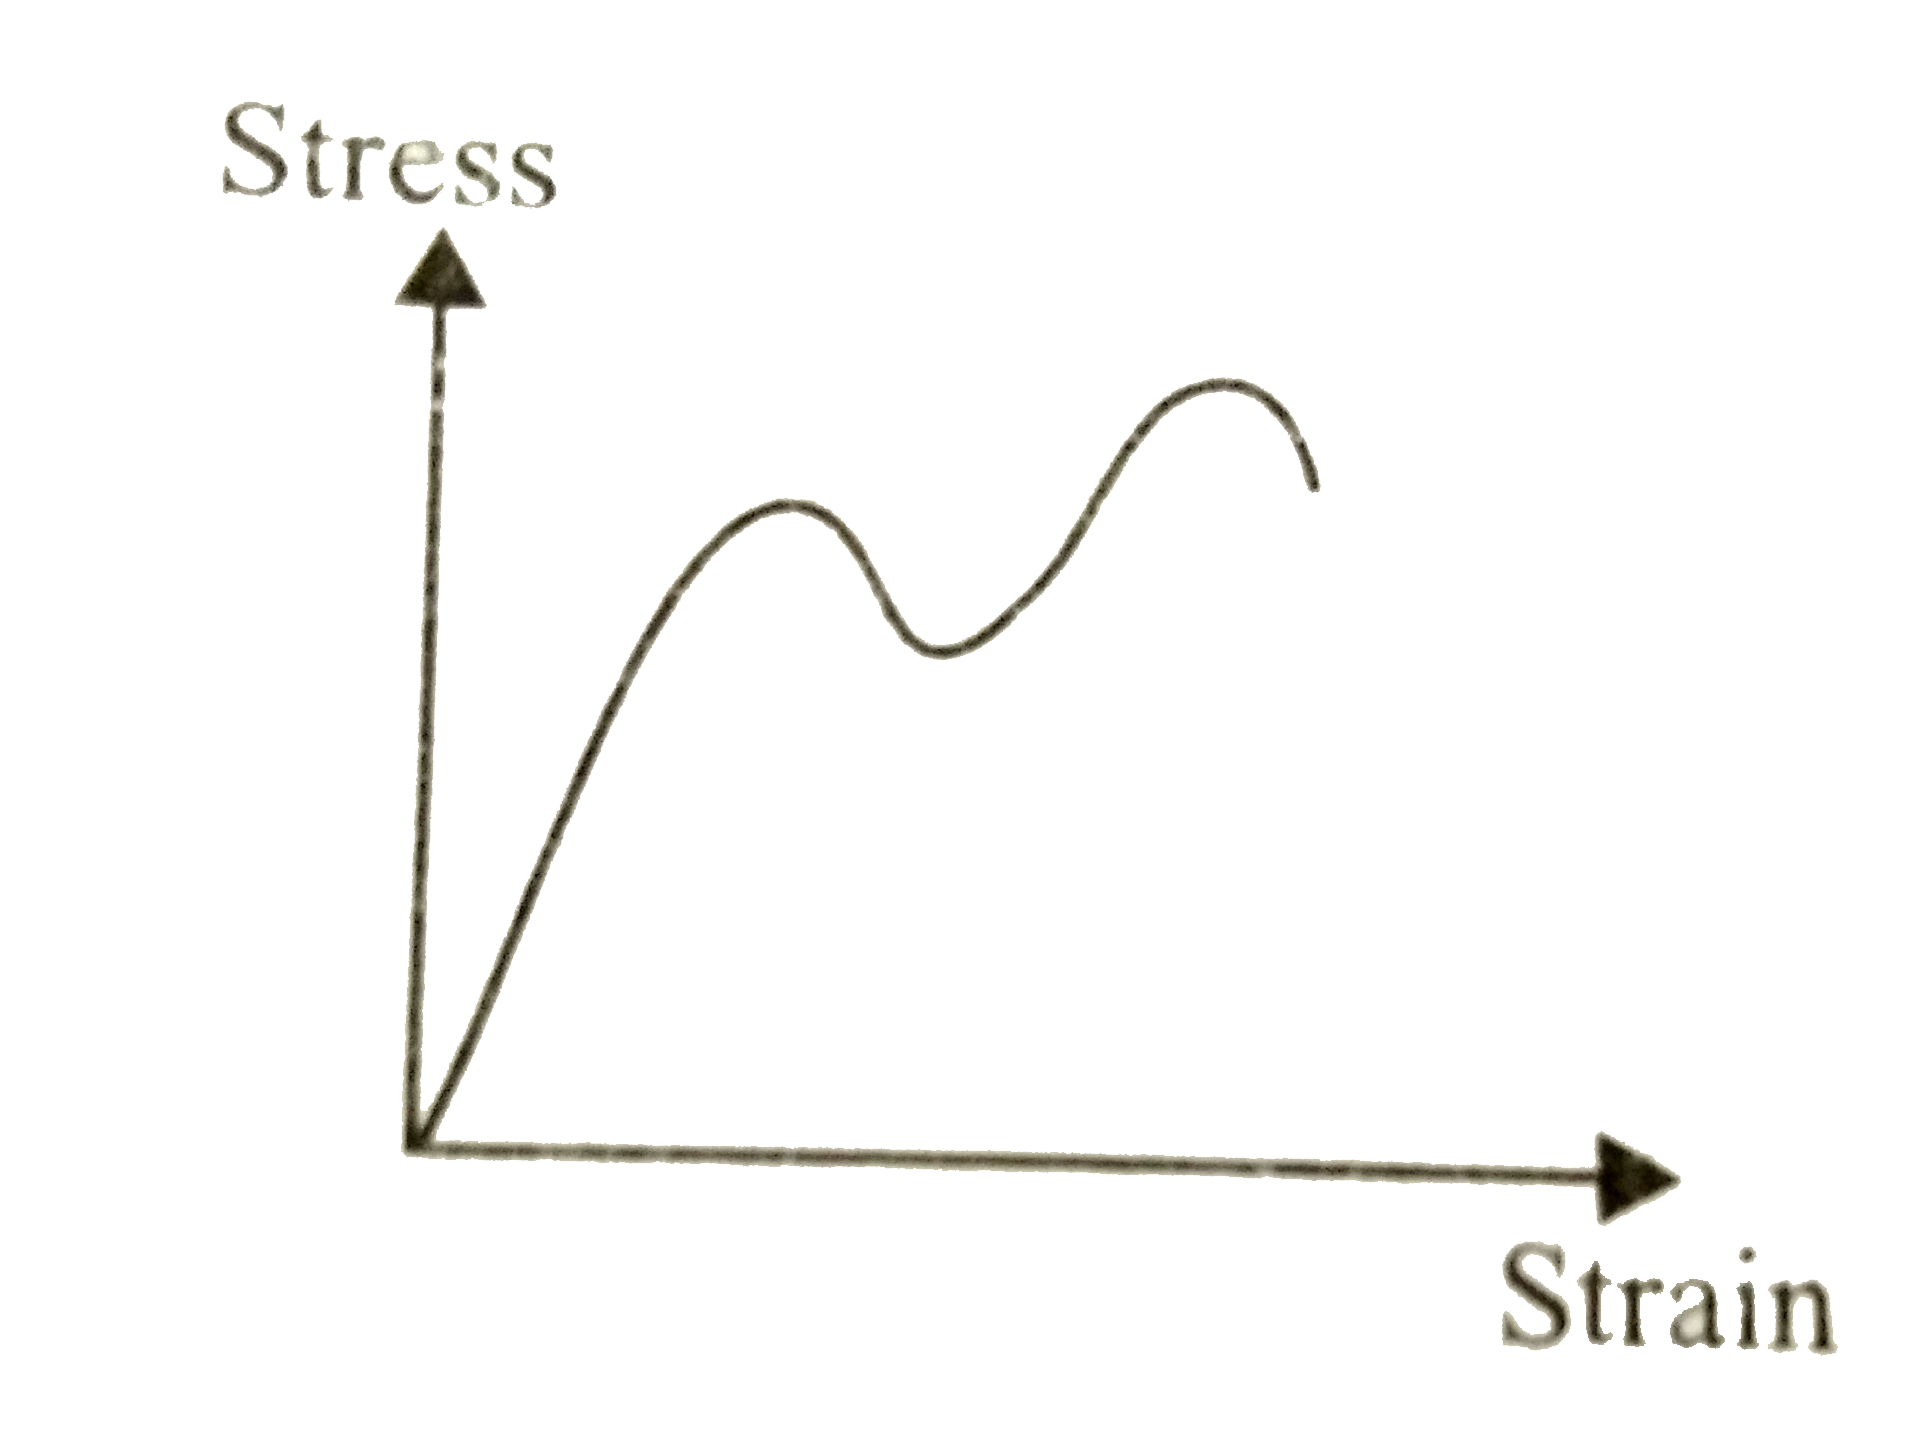
Which of the following graphs represents exothermic reaction ?
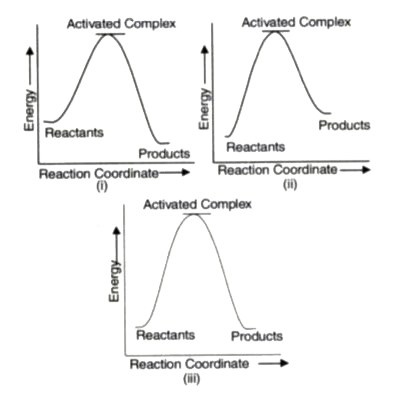 A(i) onlyB(ii) onlyC(iii) onlyD(i) and (ii)
Which of the following graphs represents exothermic reaction ?
 A(i) onlyB(ii) onlyC(iii) onlyD(i) and (ii)
Which of the following graph represents Boyle's law ?
View SolutionWhich of the following graphs represents exothoermic reaction?
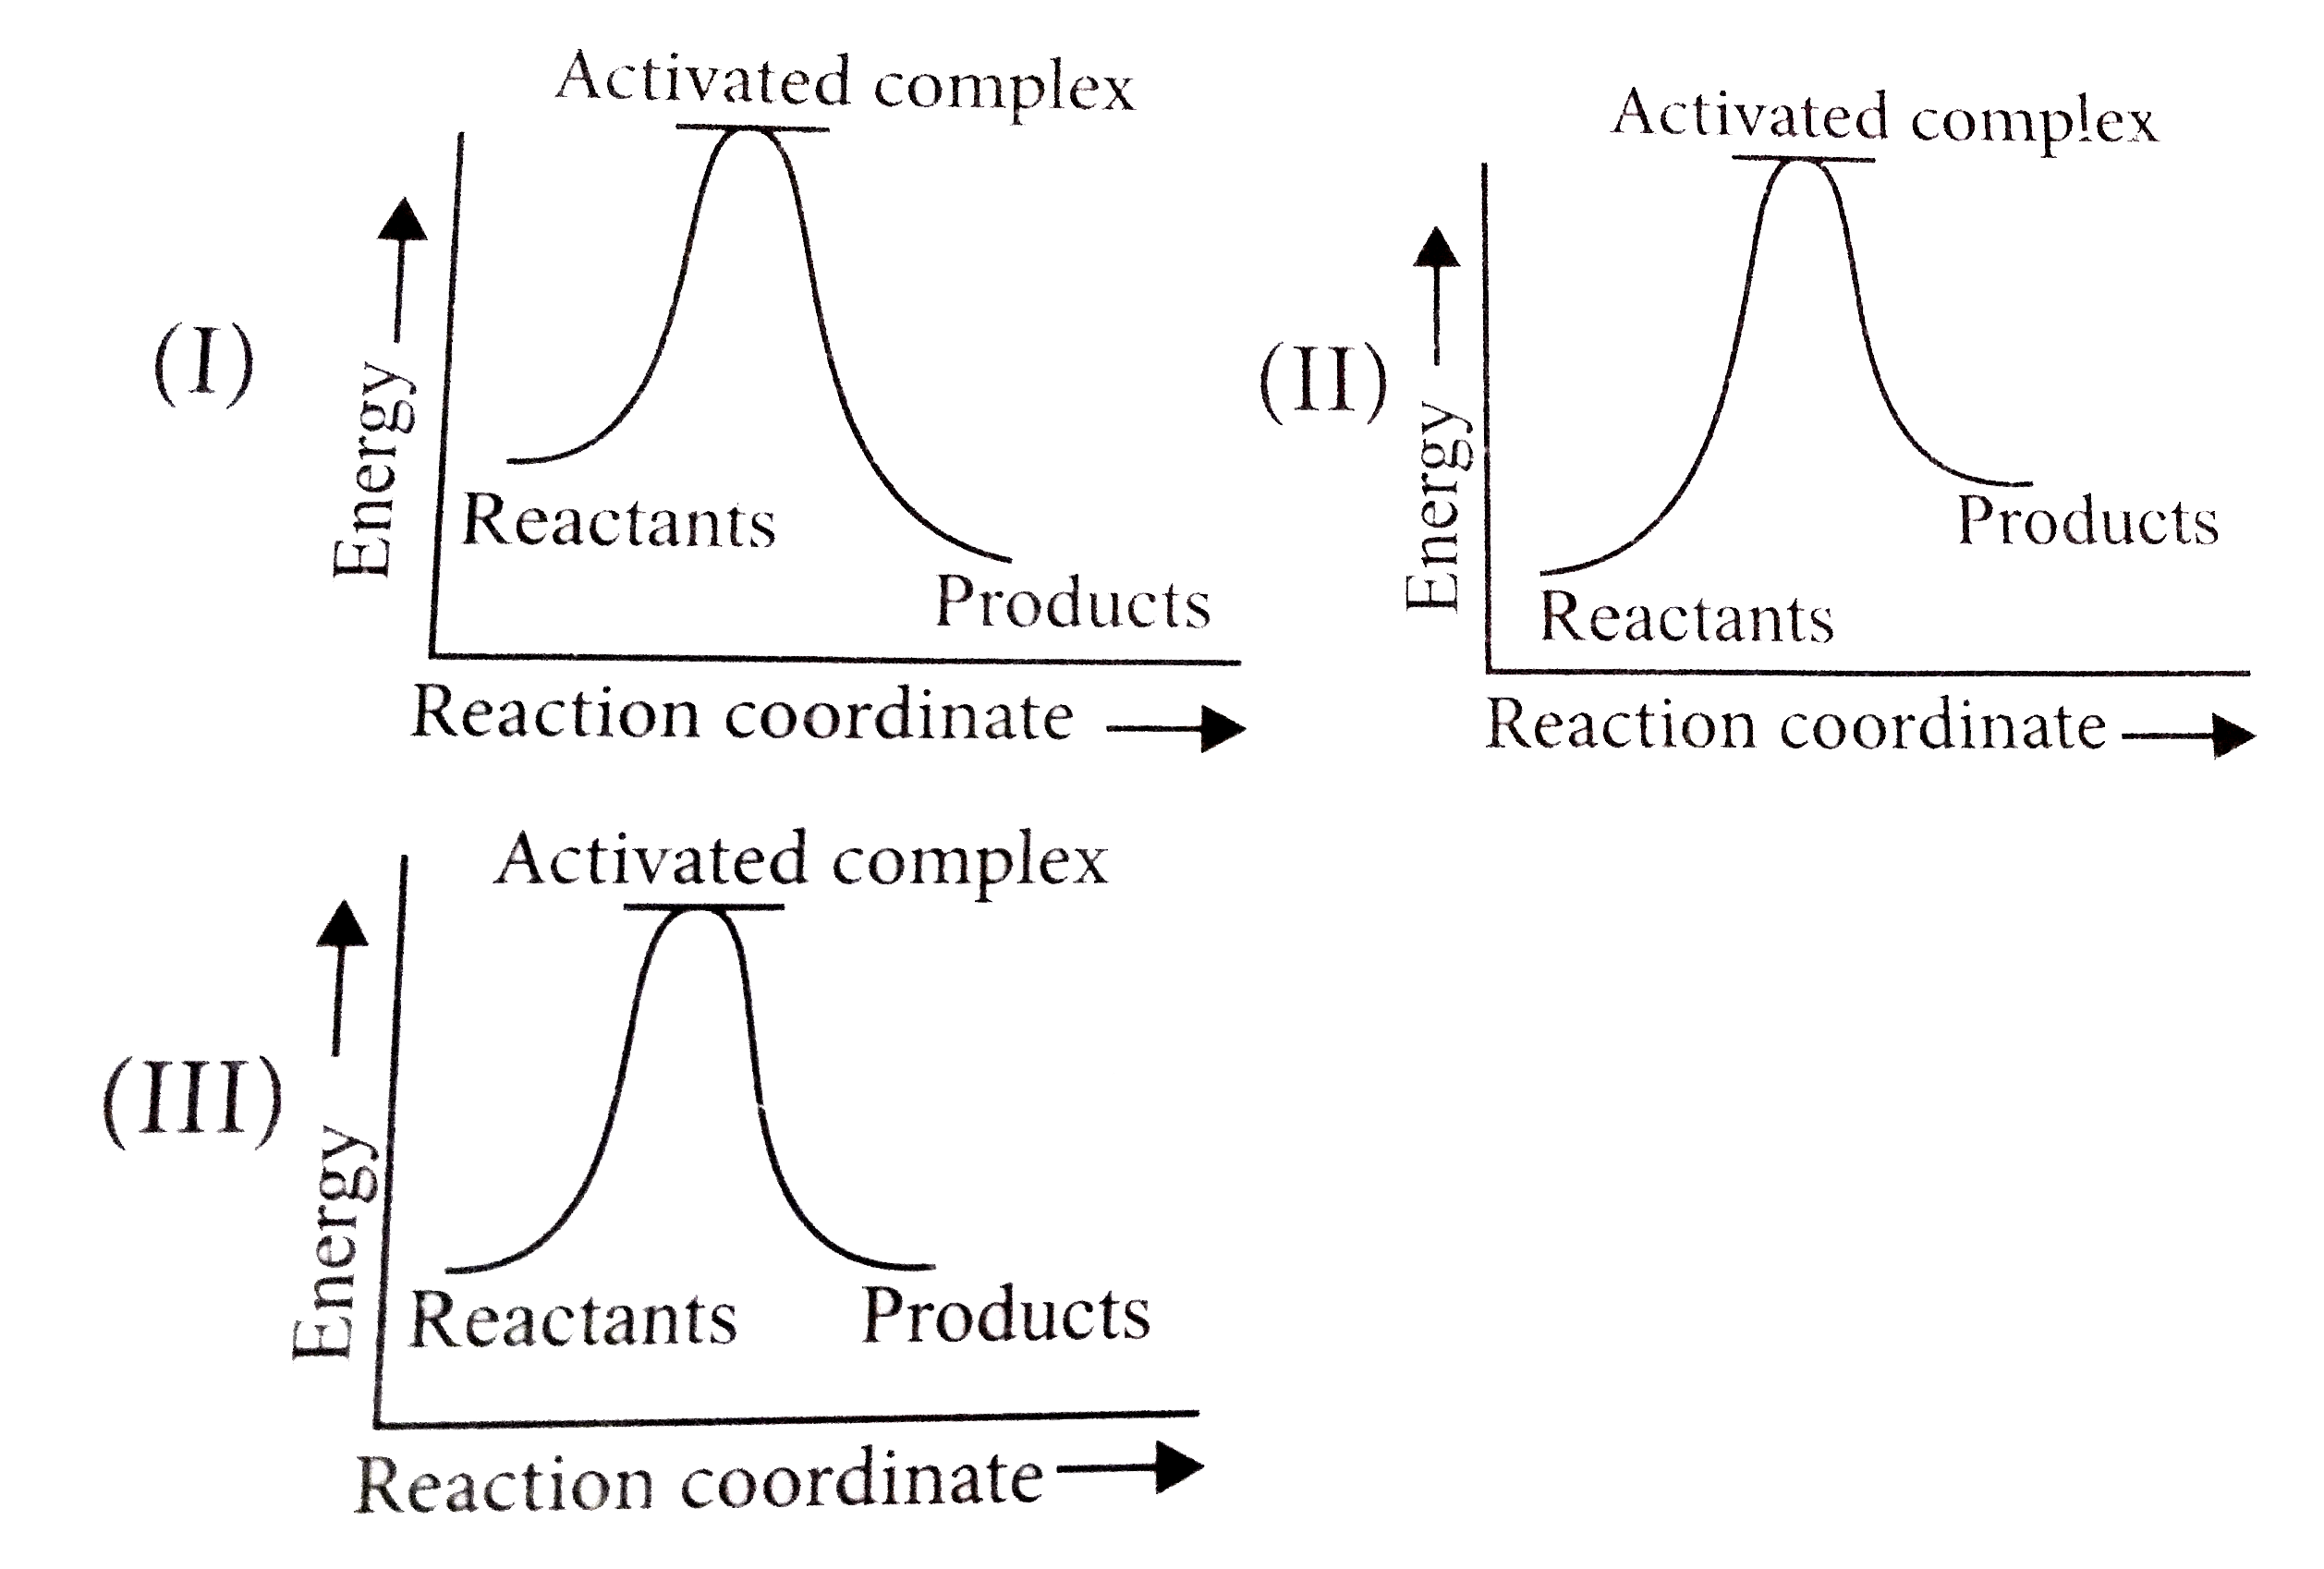
View SolutionWhich of the following graph represents exothermic reaction ?
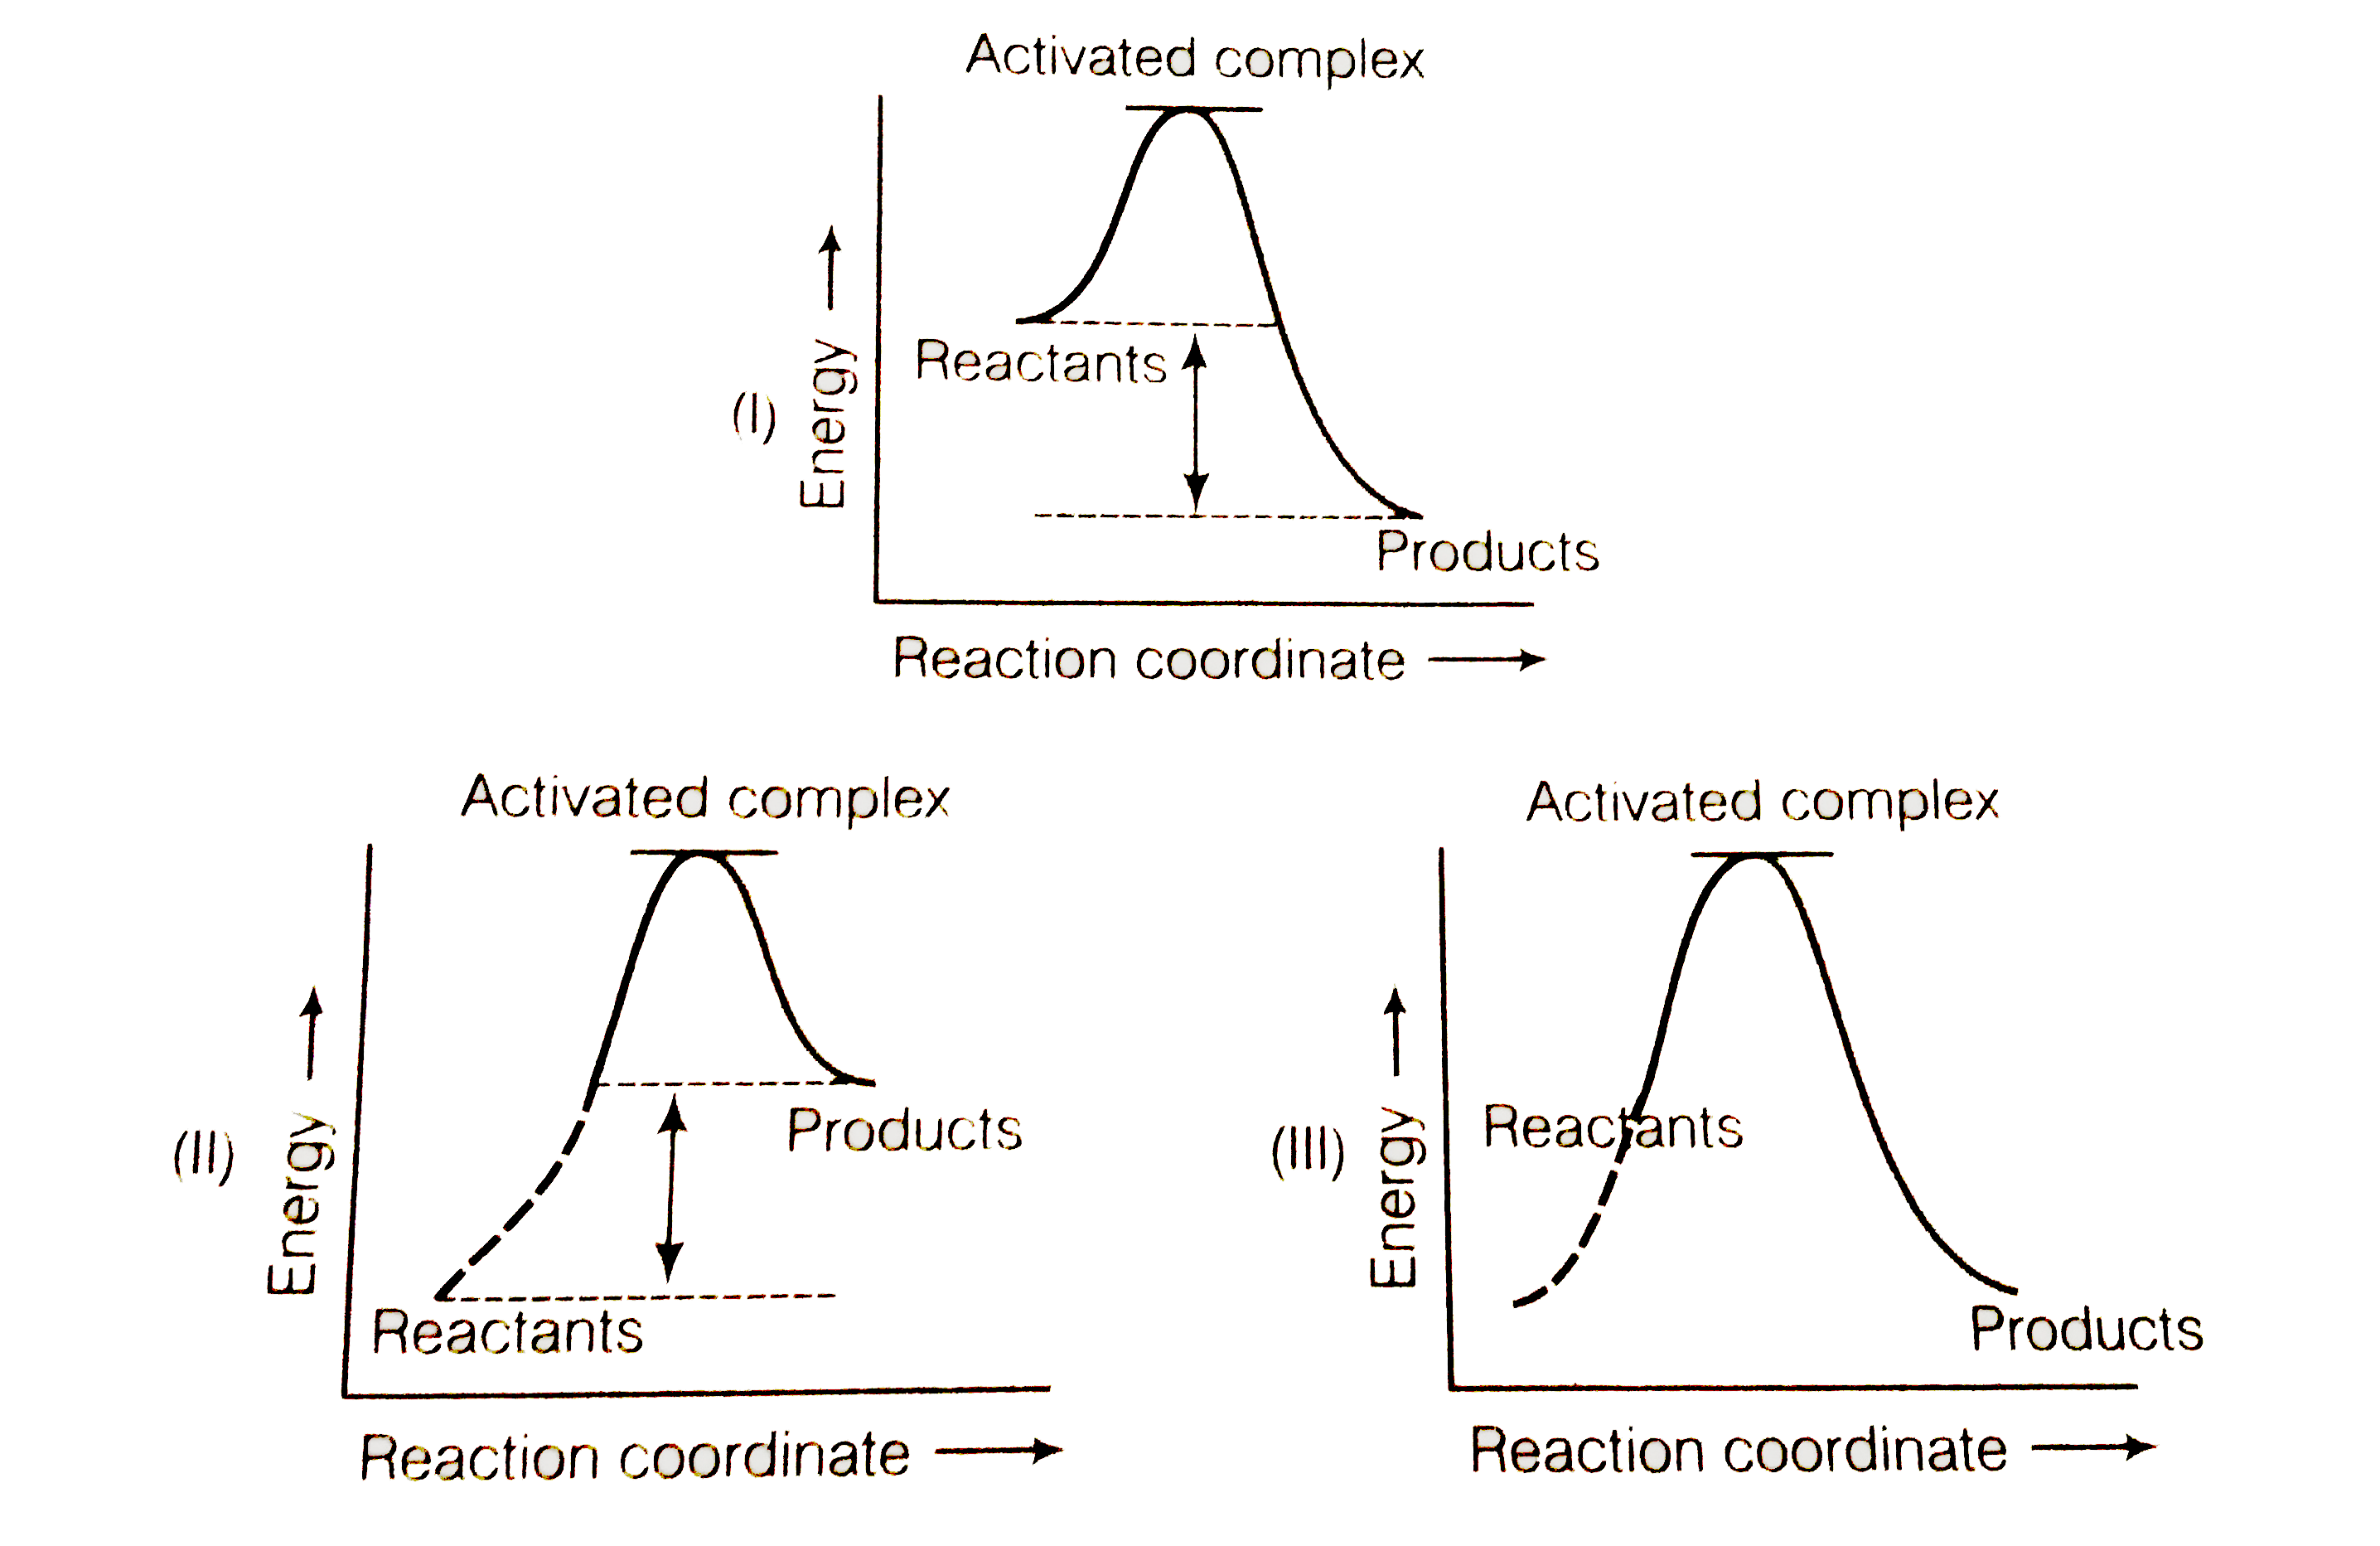
View SolutionWhich of the following x-t graphs represents the distance-time variation of a body released from the top of a buiding?
View SolutionWhich of the following graphs represents exothermic reaction ?

View Solution
