The portion of the curve representing the state of matter denotes

Change from gaseous state to liquid state
The liquid state of matter
Gaseous state of matter
all of these
The correct Answer is:B
Step by step video & image solution for The portion of the curve representing the state of matter denotes by Physics experts to help you in doubts & scoring excellent marks in Class 12 exams.
Updated on:21/07/2023Topper's Solved these Questions
- THERMAL PROPERTIES OF MATTERBOOK - AAKASH INSTITUTE ENGLISHCHAPTER - THERMAL PROPERTIES OF MATTEREXERCISE - Assignment (Section-B) Objective Type questions (one option is correct)
15 Videos
- THERMAL PROPERTIES OF MATTERBOOK - AAKASH INSTITUTE ENGLISHCHAPTER - THERMAL PROPERTIES OF MATTEREXERCISE - Assignment (Section-C) Objective Type questions (More than one option are correct)
12 Videos
- THERMAL PROPERTIES OF MATTERBOOK - AAKASH INSTITUTE ENGLISHCHAPTER - THERMAL PROPERTIES OF MATTEREXERCISE - Try Youself
16 Videos
- TEST2BOOK - AAKASH INSTITUTE ENGLISHCHAPTER - TEST2EXERCISE - EXERCISE
2 Videos
- THERMODYNAMICSBOOK - AAKASH INSTITUTE ENGLISHCHAPTER - THERMODYNAMICSEXERCISE - ASSIGNMENT (SECTION -D) (Assertion - Reason Type Questions)
10 Videos
Similar Questions
Knowledge Check
The graph of the curve represented by {x=secθ,y=cosθ} is
Aa lineBA hyperbolaCan ellipseDa portion of hyperbola
The fourth state of matter ………..
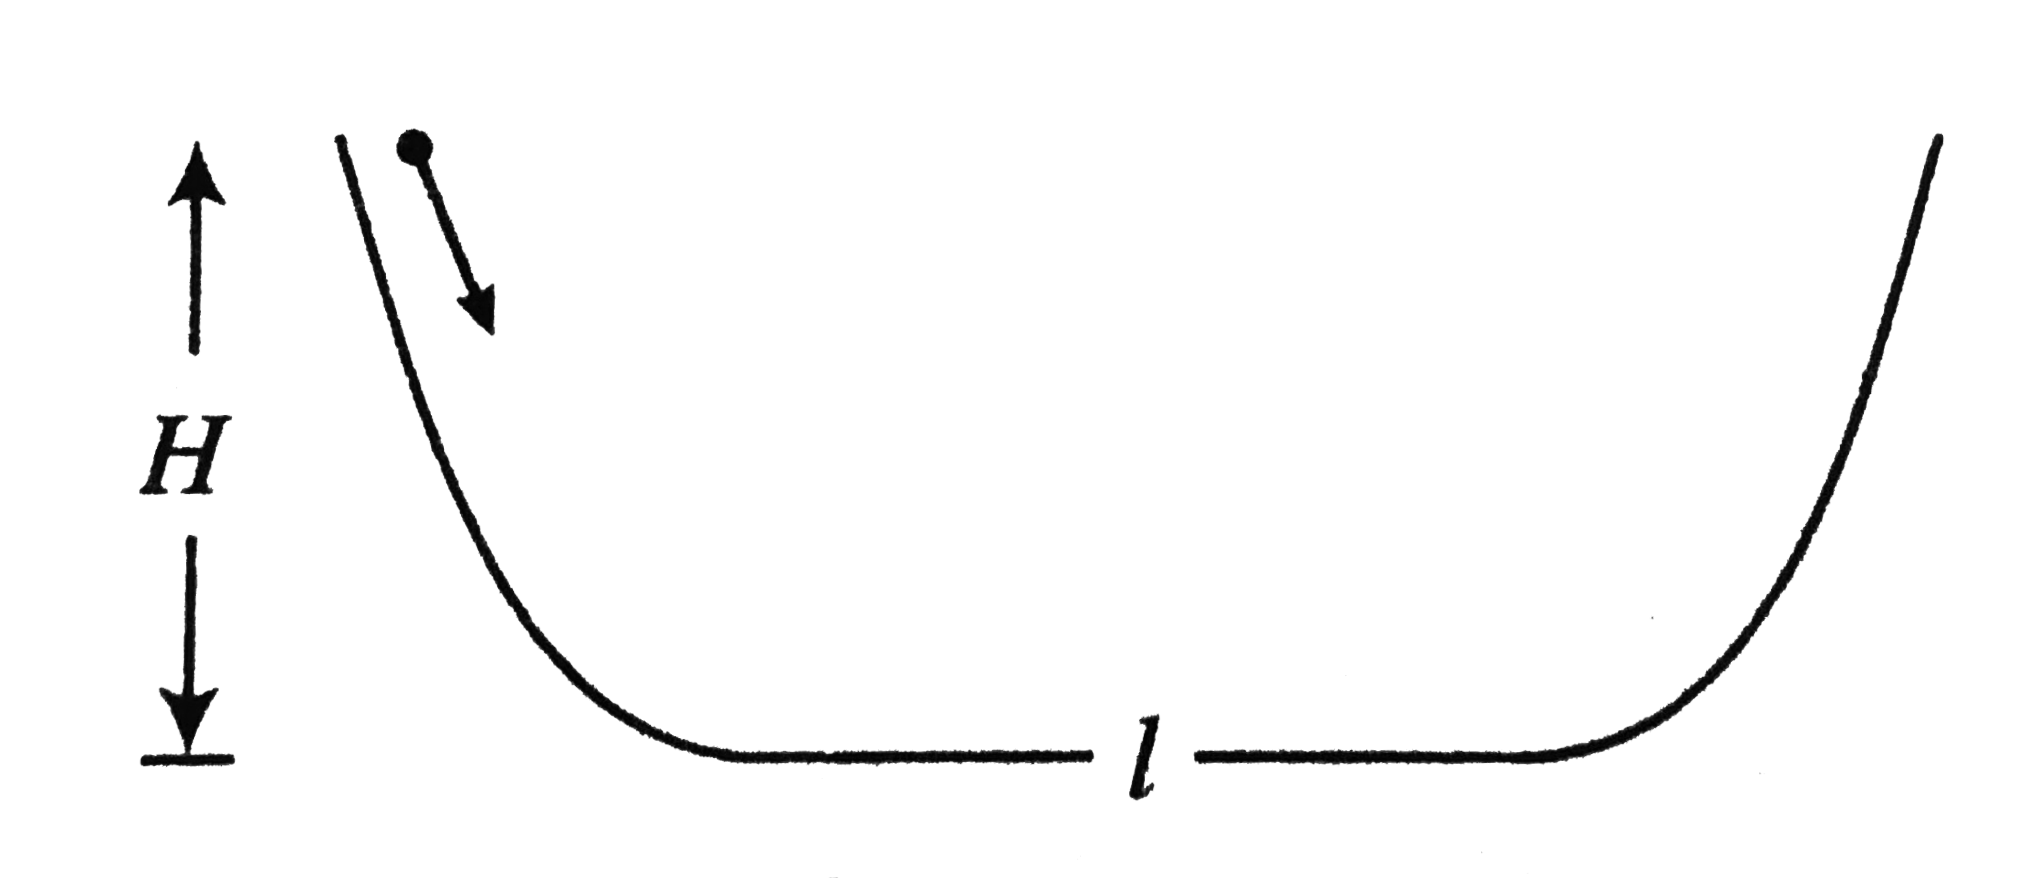
View SolutionA particle of mass m slides along a curved-flat-curved track. The curved portions of the track are smooth. If the particle is released at the top of one of the curved portions, the particle comes to rest at flat portion of length l and of μ=μkinetic after covering a distance of

View SolutionState two properties of 4th state of matter?
View SolutionDuring development, which portion of the brain-the grey or the white matter-enlarges more rapidly?
View SolutionWrite the fraction representing the shaded portion.
View Solution(a) Name the two growth models that represent population growth and draw the respective growth curves they represent.
(b) State the basis for the difference in the shape of these curves.
(c) Which one of the curves represent the human population growth at present? Do you think such a curve is sustainable ? Give reason in support of your answer.
View Solution
