The current I through a conductor varies with time t as shown in figure. The average electric current during t=0 to t=10 s will be
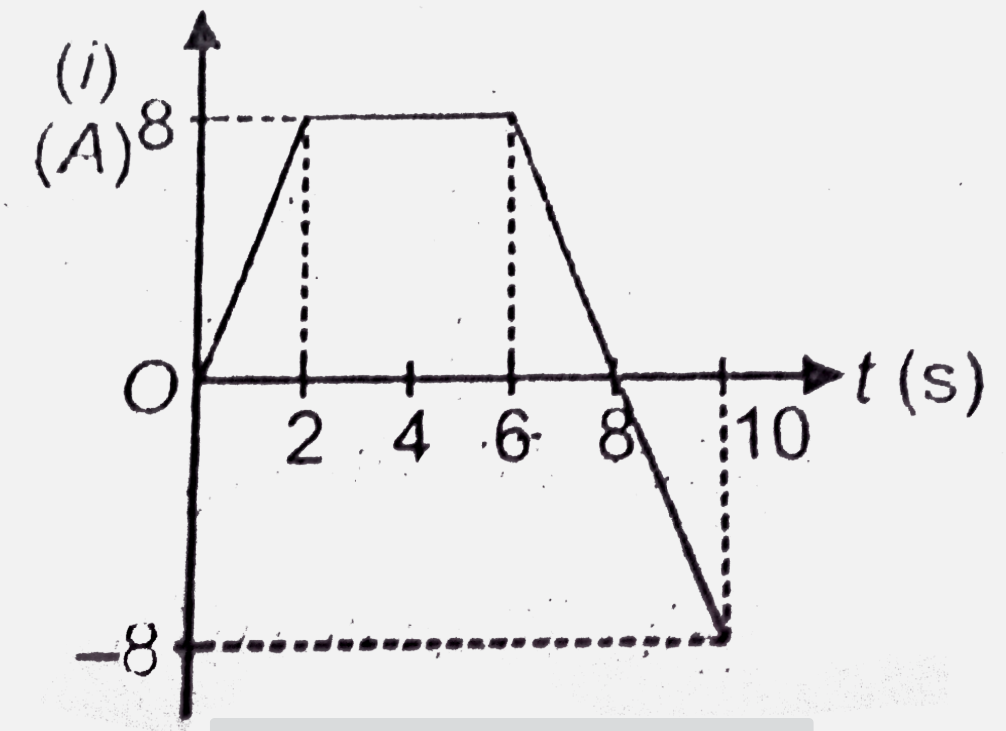
5.6 A
4A
4.8 A
8A
The correct Answer is:2
Step by step video & image solution for The current I through a conductor varies with time t as shown in figure. The average electric current during t=0 to t=10 s will be by Physics experts to help you in doubts & scoring excellent marks in Class 12 exams.
Updated on:21/07/2023Topper's Solved these Questions
- CURRENT ELECTRICITYBOOK - AAKASH INSTITUTE ENGLISHCHAPTER - CURRENT ELECTRICITYEXERCISE - ASSIGNMENT SECTION-C(OBJECTIVE TYPE QUESTION ))
13 Videos
- CURRENT ELECTRICITYBOOK - AAKASH INSTITUTE ENGLISHCHAPTER - CURRENT ELECTRICITYEXERCISE - ASSIGNMENT SECTION-D( LINKED COMPREHENSION TYPE QUESTIONS)
3 Videos
- CURRENT ELECTRICITYBOOK - AAKASH INSTITUTE ENGLISHCHAPTER - CURRENT ELECTRICITYEXERCISE - ASSIGNMENT(SECTION-A(OBJECTIVE TYPE QUESTIONS))
69 Videos
- COMMUNICATION SYSTEMS BOOK - AAKASH INSTITUTE ENGLISHCHAPTER - COMMUNICATION SYSTEMS EXERCISE - ASSIGNMENT SECTION D (Assertion-Reason)
10 Videos
- DUAL NATURE OF RADIATION AND MATTER BOOK - AAKASH INSTITUTE ENGLISHCHAPTER - DUAL NATURE OF RADIATION AND MATTER EXERCISE - ASSIGNMENT (SECTION-D)
10 Videos
Similar Questions
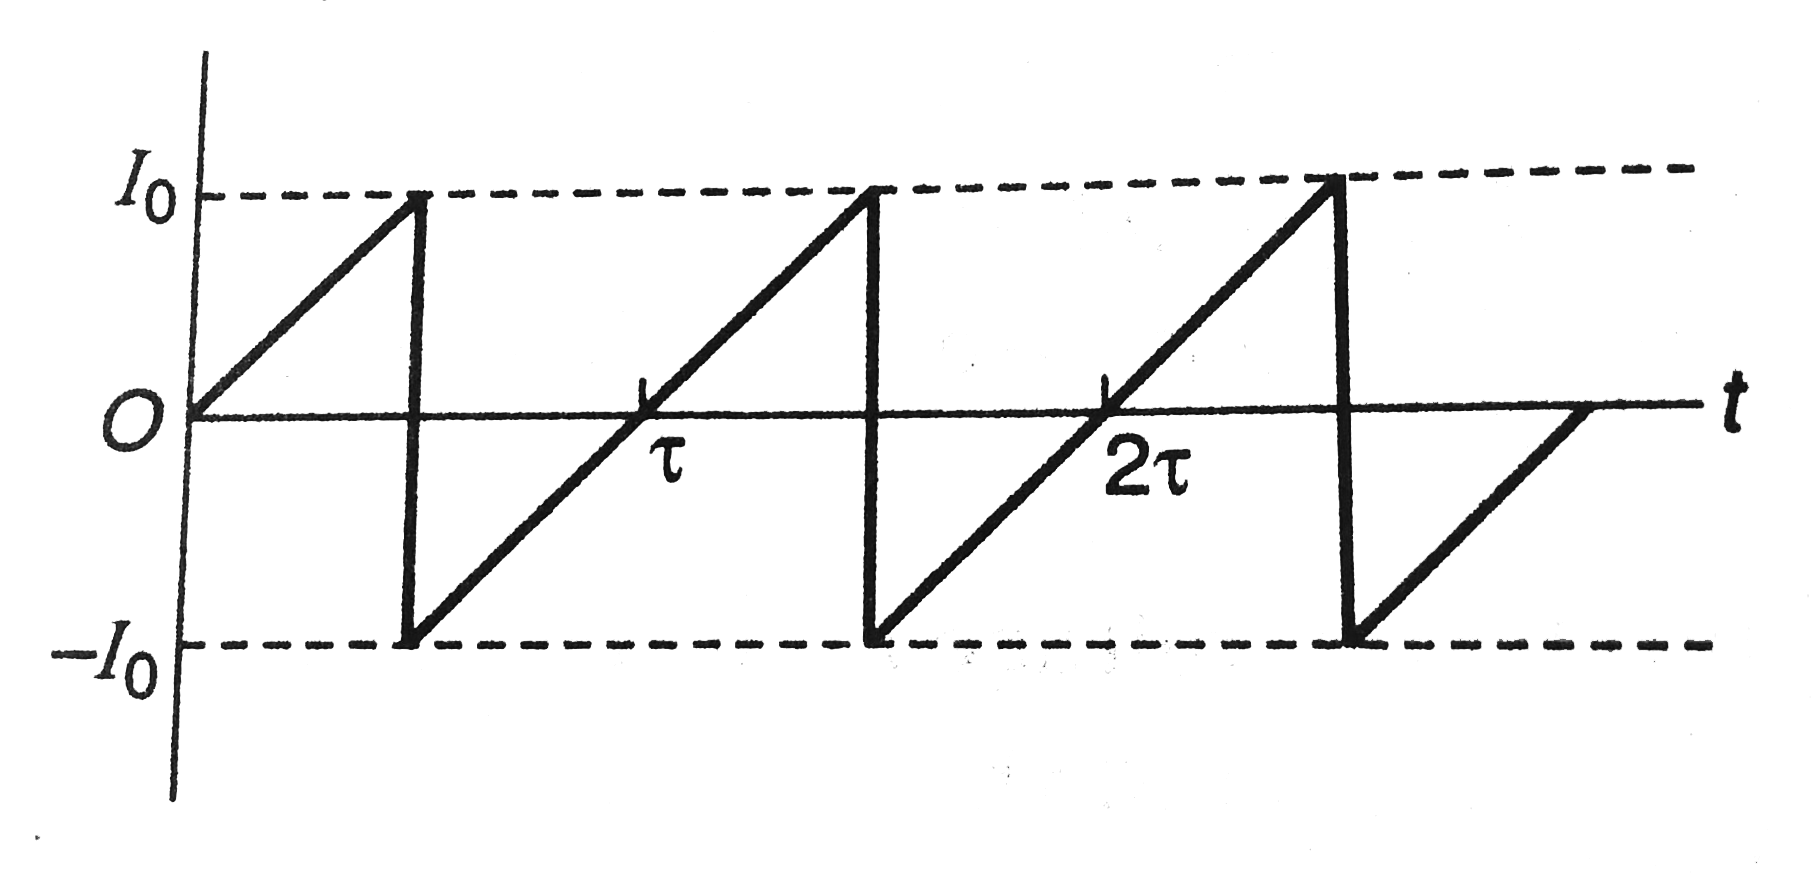
The current in a certain circuit varies with time as shown in figure. Find the average current and the rms current in terms of I0
 .
.
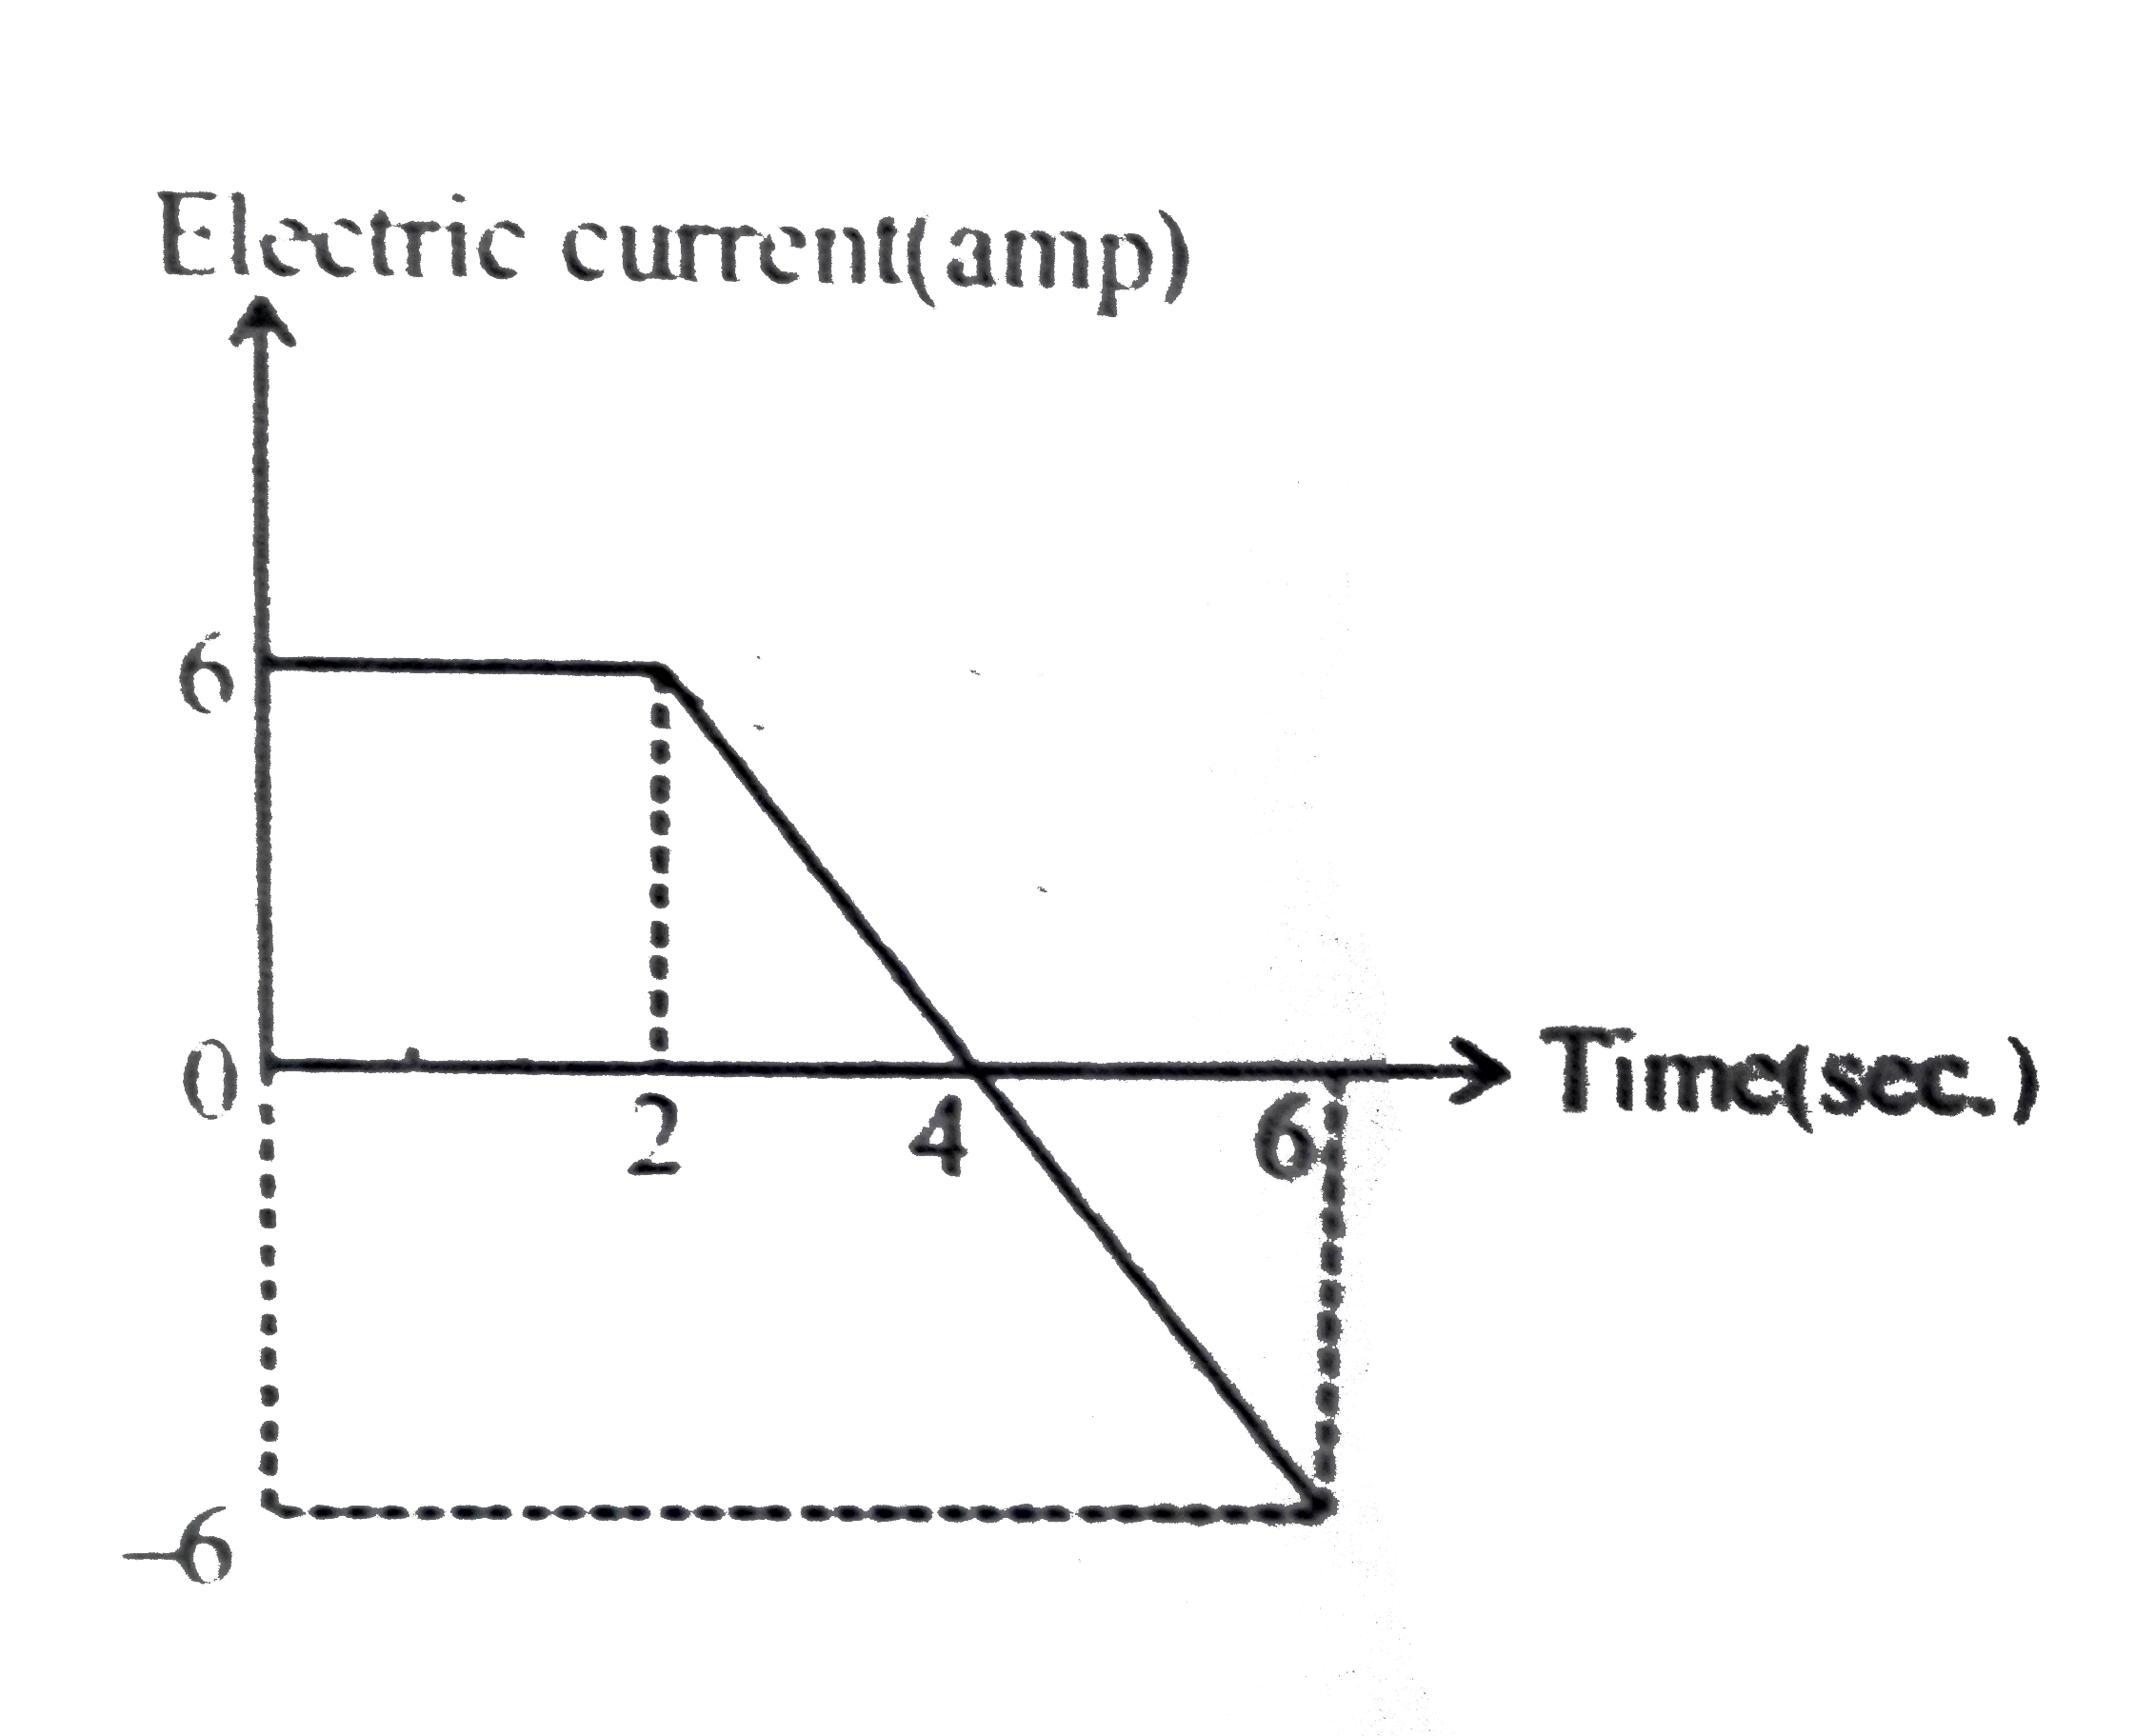
View SolutionIf Electric-current 'i' time (t) graph shown in figure. The average current in first 6 sec. is :-
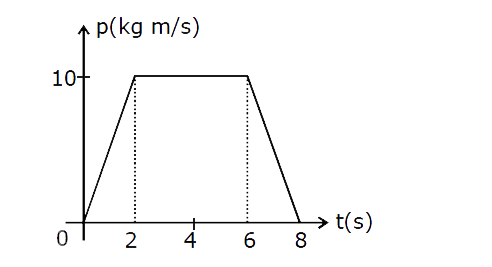
View SolutionThe momentum p of an object varies with time (t) as shown in figure. The corresponding force (F)- time (t) graph is -
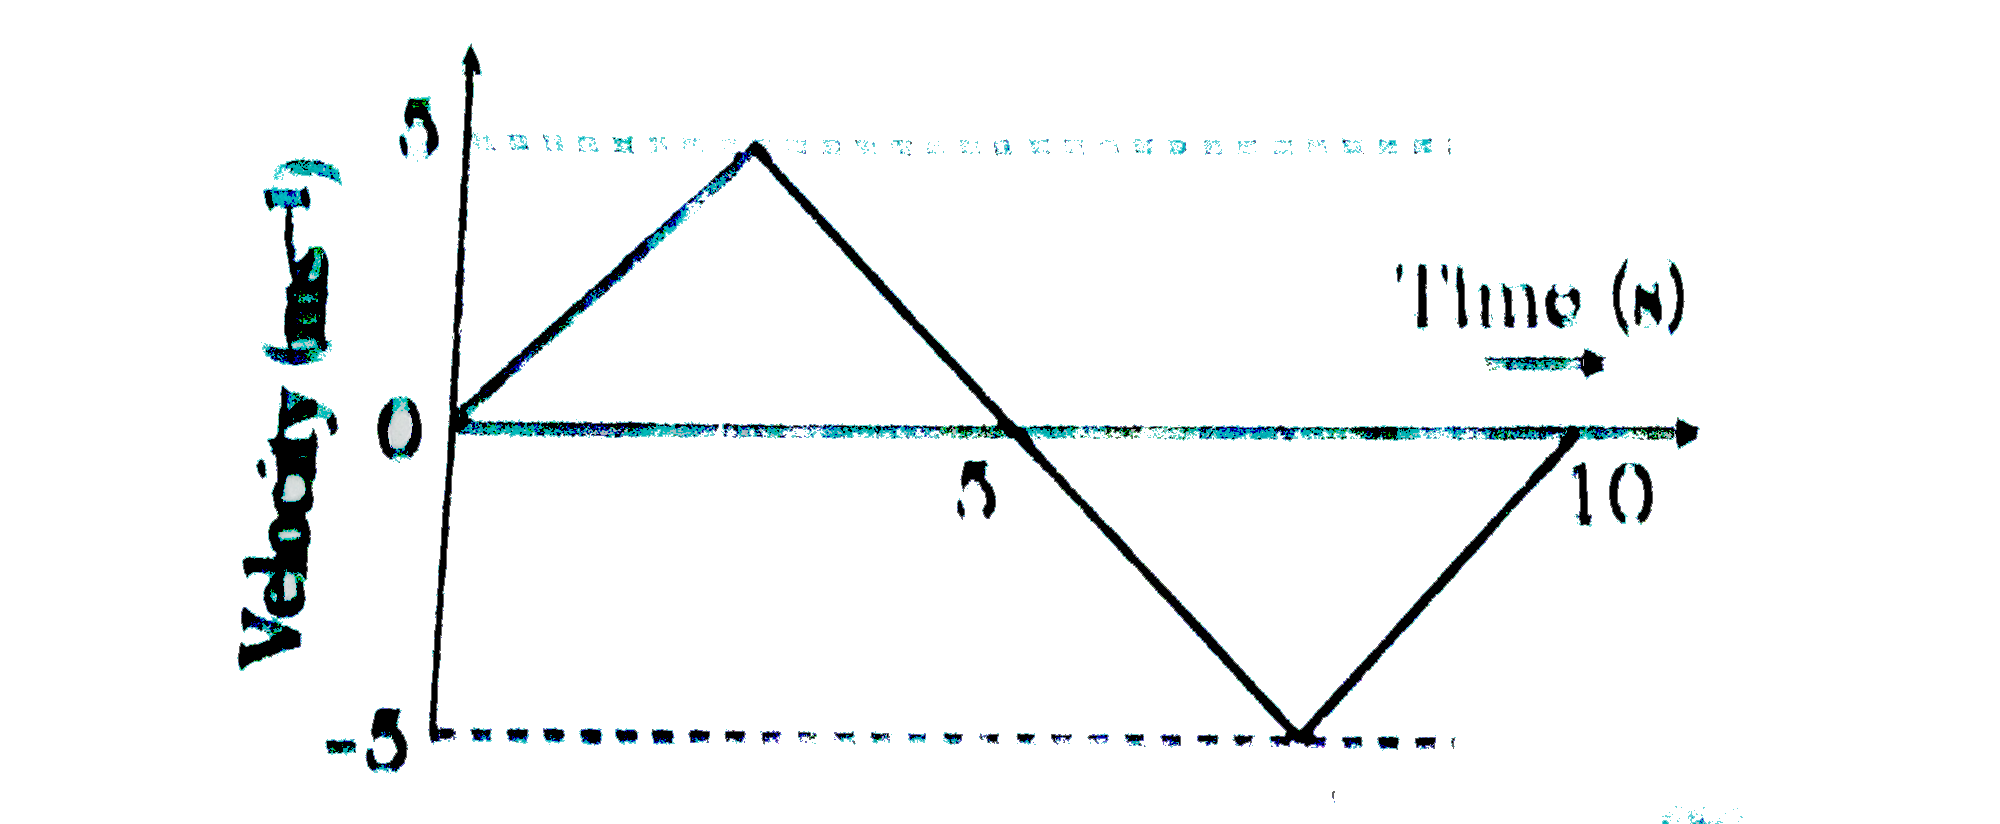
View SolutionThe v-t plot of a moving object ios shown in the figure. The average velocity of the object during the first 10 s is
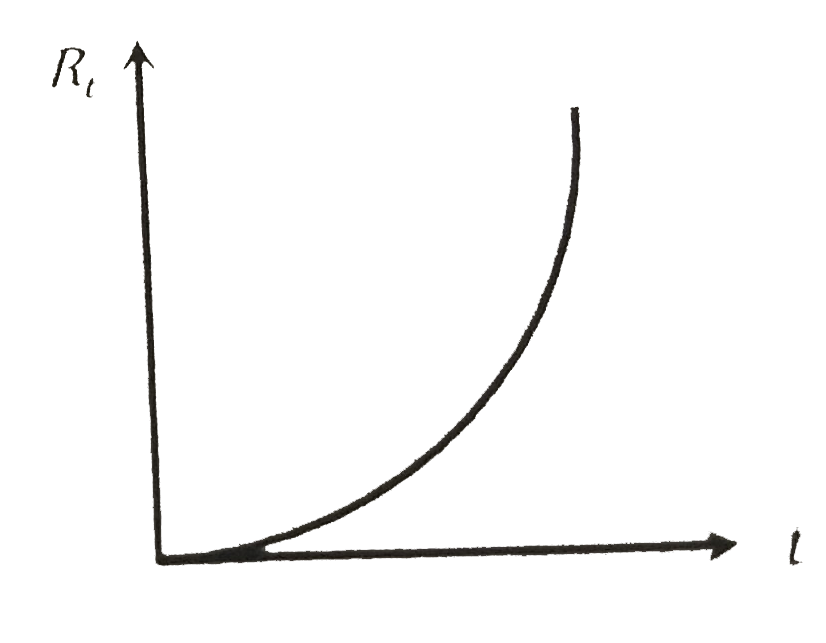
View SolutionThe resistance R of a conductor varies with temperature t as shown in the figure. If the variation is represented by Rt=R0[1+αt+βt2], then
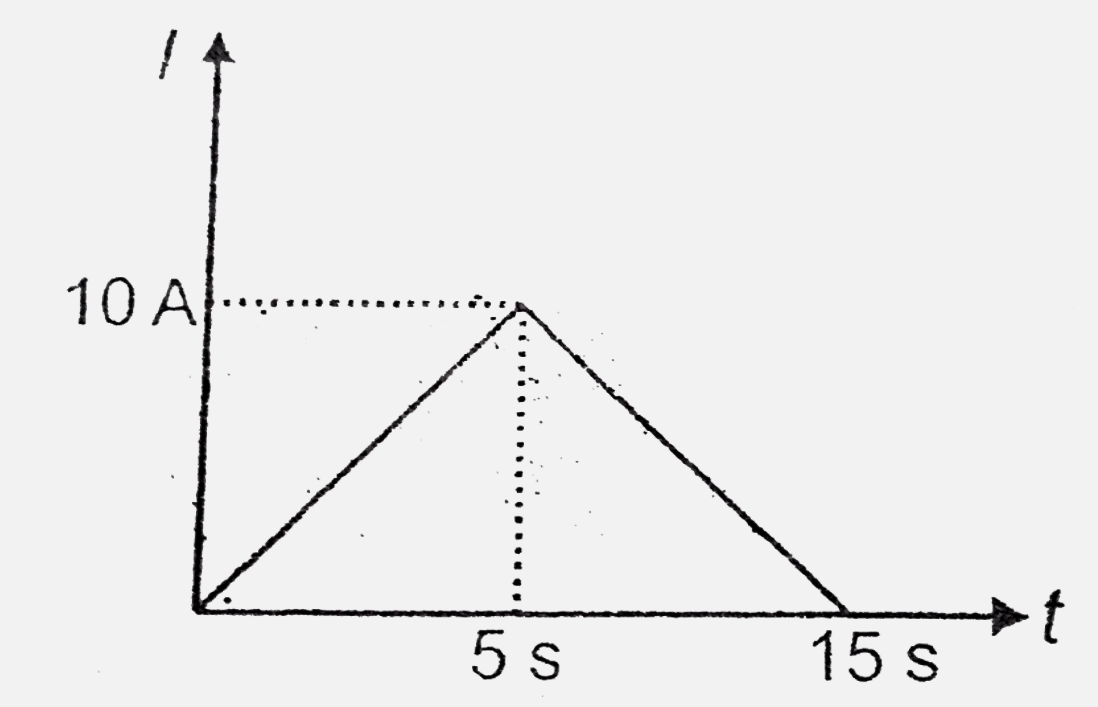
View SolutionCurrent l versus time t graph through a conductor is shown in the figure. Average current through the conductor in the interval 0 to 15 s is
View SolutionThe current in a conductor varies with time .t. as I=3t+4t2. Where I in amp and t in sec. The electric charge flows through the section of the conductor between t = 1s and t = 3s
View SolutionForce-time graph of a particle of mass 6 kg is shown in figure, then change in linear momentum during t = 0 to t = 10 s is
View SolutionElectric current through a conductor varies with time as I(t)=50sin(100πt). Here I is in amperes and t in seconds. Total charge that passes any point from t=0 to t=1200s is
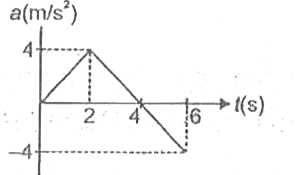
View SolutionFor the acceleration - time (a - t) graph shown in figure, the change in velocity of particle from t = 0 to t = 6 s is
View Solution
