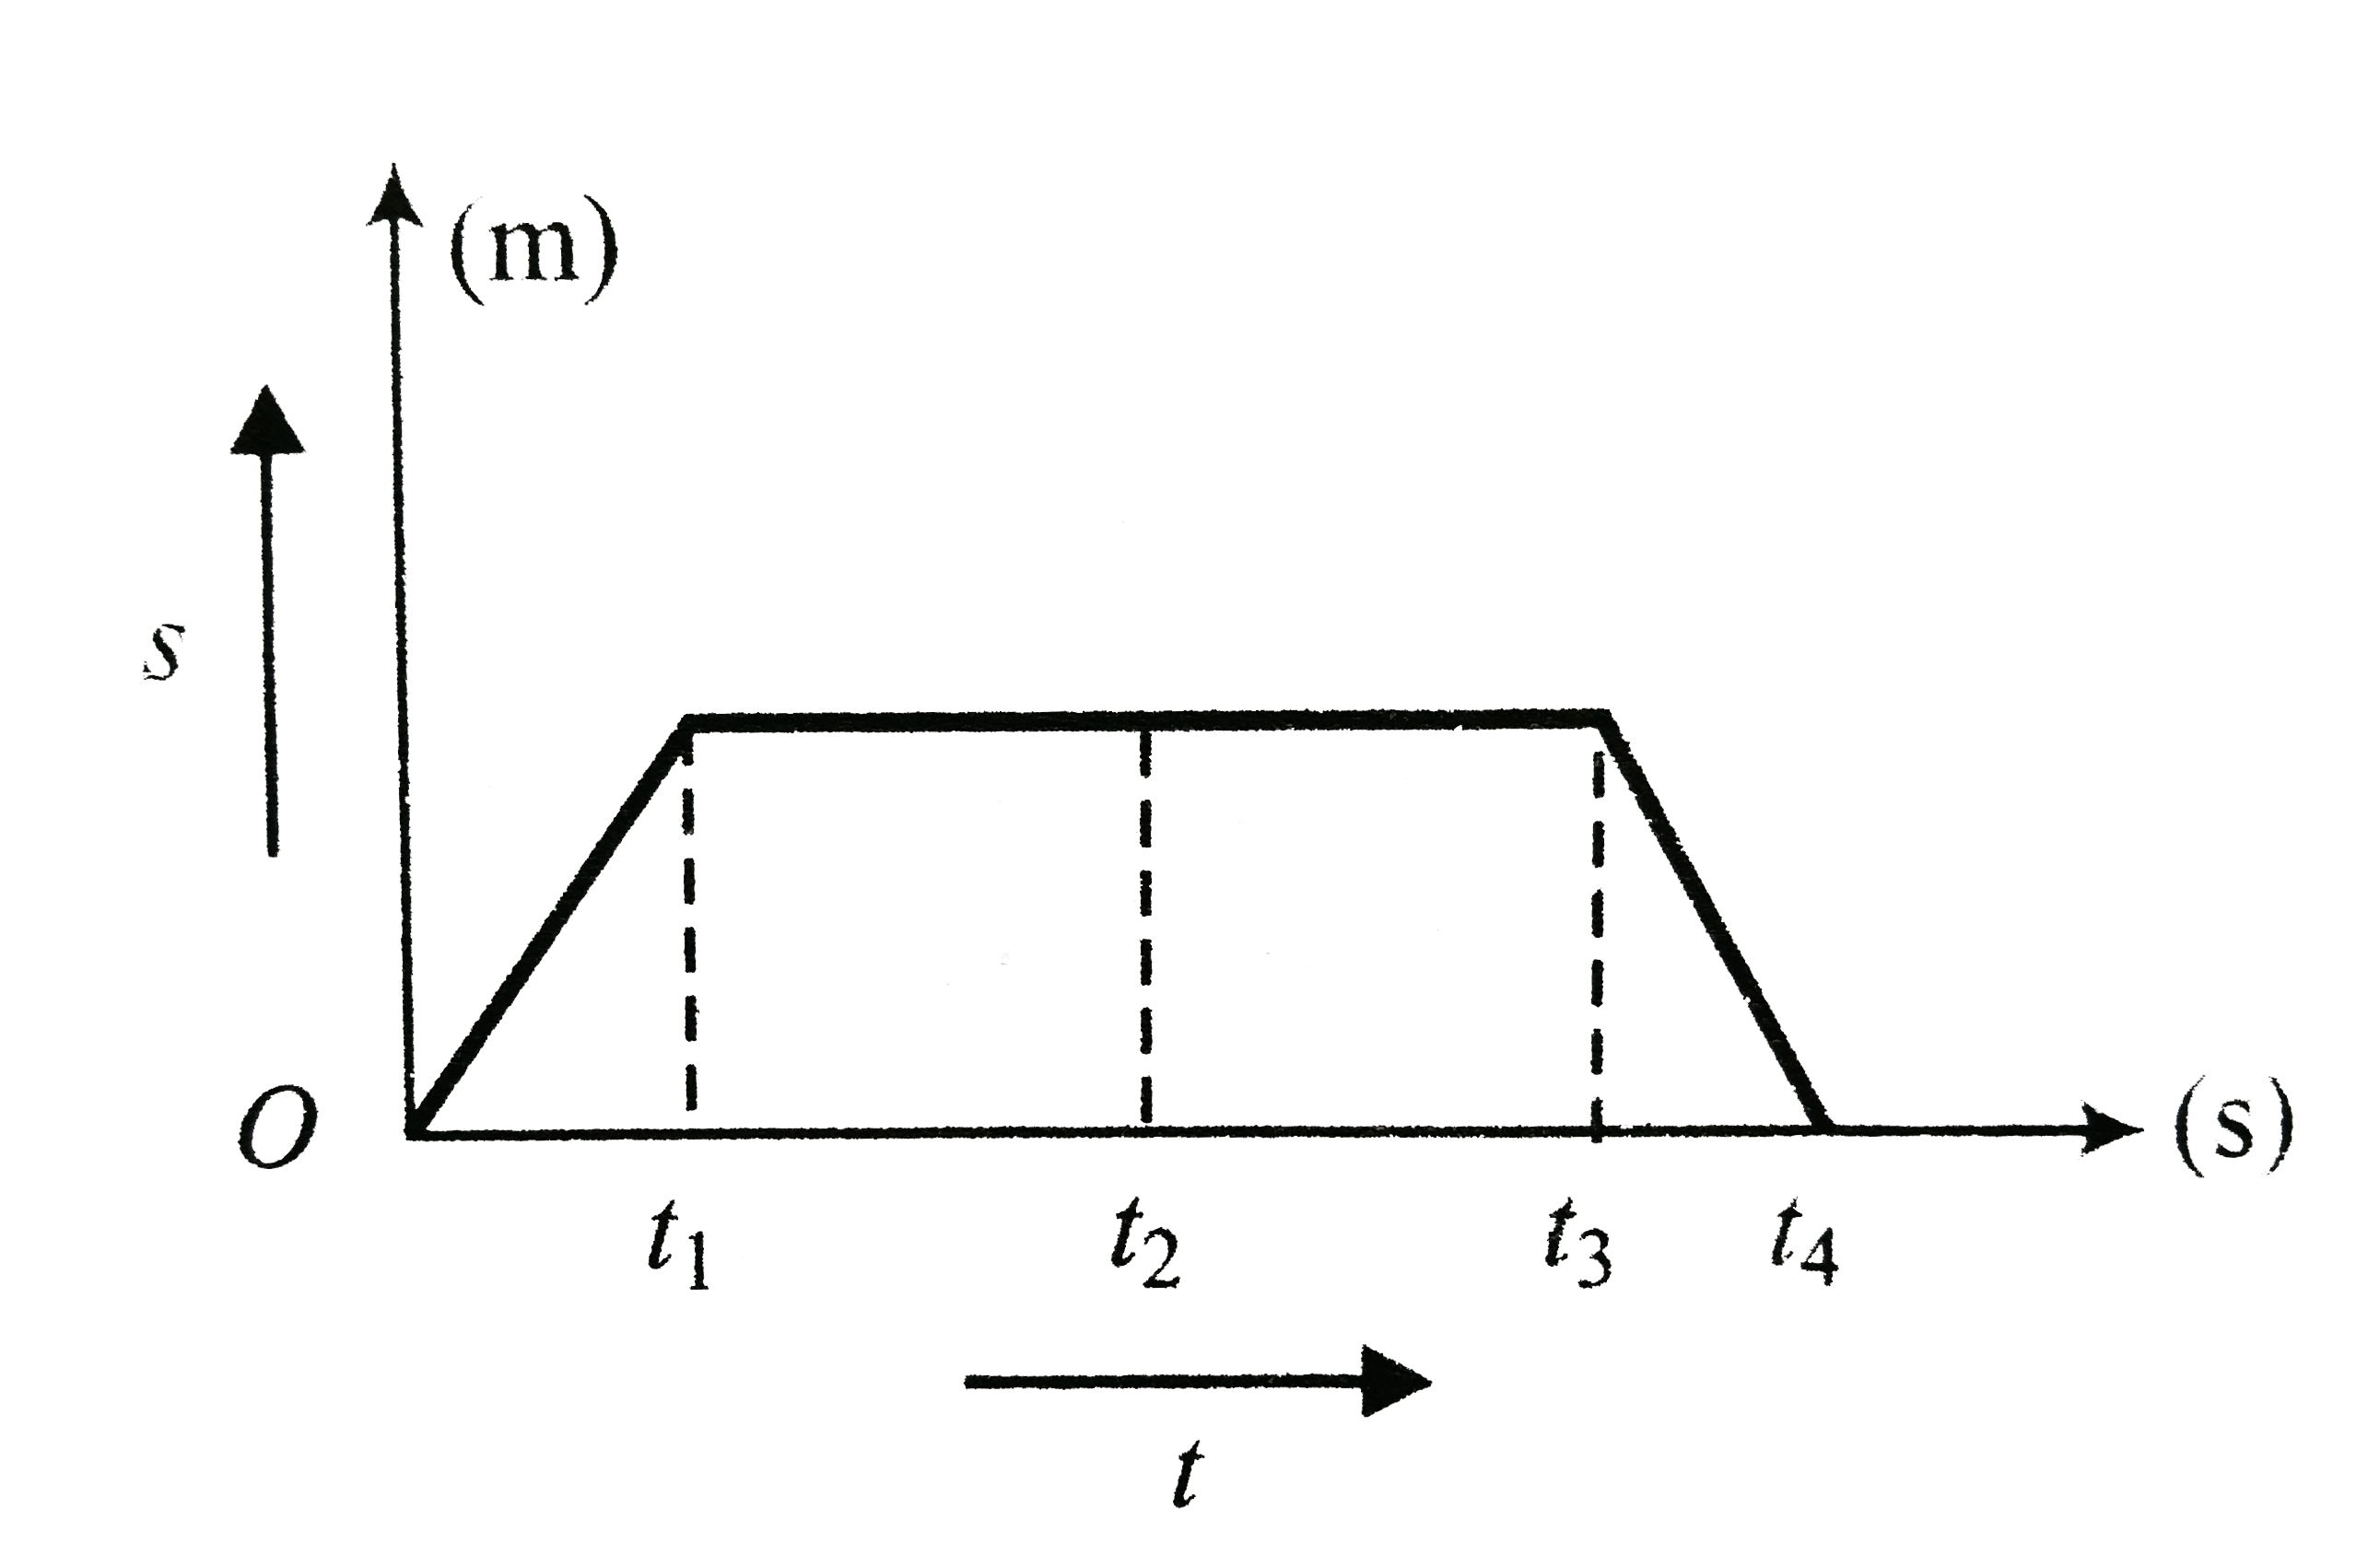
A : The displacement (s) time graph shown in the figure represents an accelerated motion.
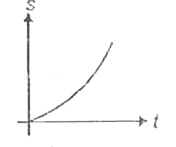
R : Slope of graph increases with time.
If both Assertion & Reason are true and the reason is the correct explanation of the assertion, then mark (1).
If both Assertion & Reason are true but the reason is not the correct explanation of the assertion, then mark (2).
If Assertion is true statement but Reason is false, then mark (3).
If both Assertion and Reason are false statement, then mark (4).
The correct Answer is:1
Step by step video & image solution for A : The displacement (s) time graph shown in the figure represents an accelerated motion. R : Slope of graph increases with time. by Physics experts to help you in doubts & scoring excellent marks in Class 12 exams.
Updated on:21/07/2023Topper's Solved these Questions
- MOTION IN A STRAIGHT LINEBOOK - AAKASH INSTITUTE ENGLISHCHAPTER - MOTION IN A STRAIGHT LINEEXERCISE - ASSIGNMENT (SECTION - C)
36 Videos
- MOTION IN A PLANEBOOK - AAKASH INSTITUTE ENGLISHCHAPTER - MOTION IN A PLANEEXERCISE - Assignement section -J (Aakash Challengers Questions)
7 Videos
- MOTION IN STRAIGHT LINEBOOK - AAKASH INSTITUTE ENGLISHCHAPTER - MOTION IN STRAIGHT LINEEXERCISE - Assignment (SECTION - J)
2 Videos
Similar Questions
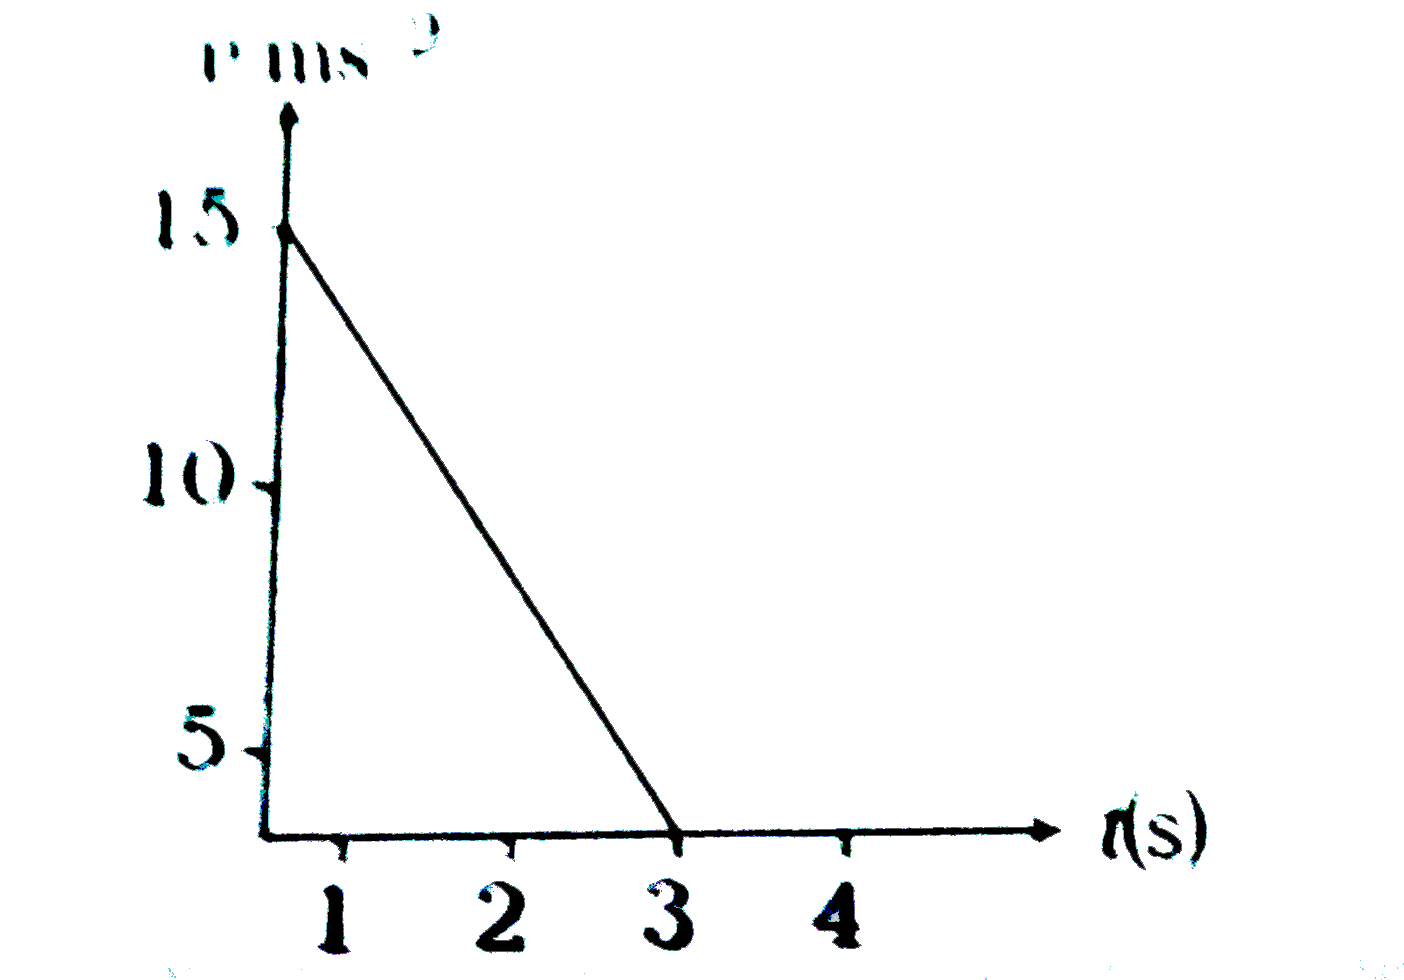
The velocity - time graph is shown in the figure, for a particle. The acceleration of particle is
View SolutionAssertion : In the s-t graph as shown in figure, velocity of particle is negative and acceleration is positive.
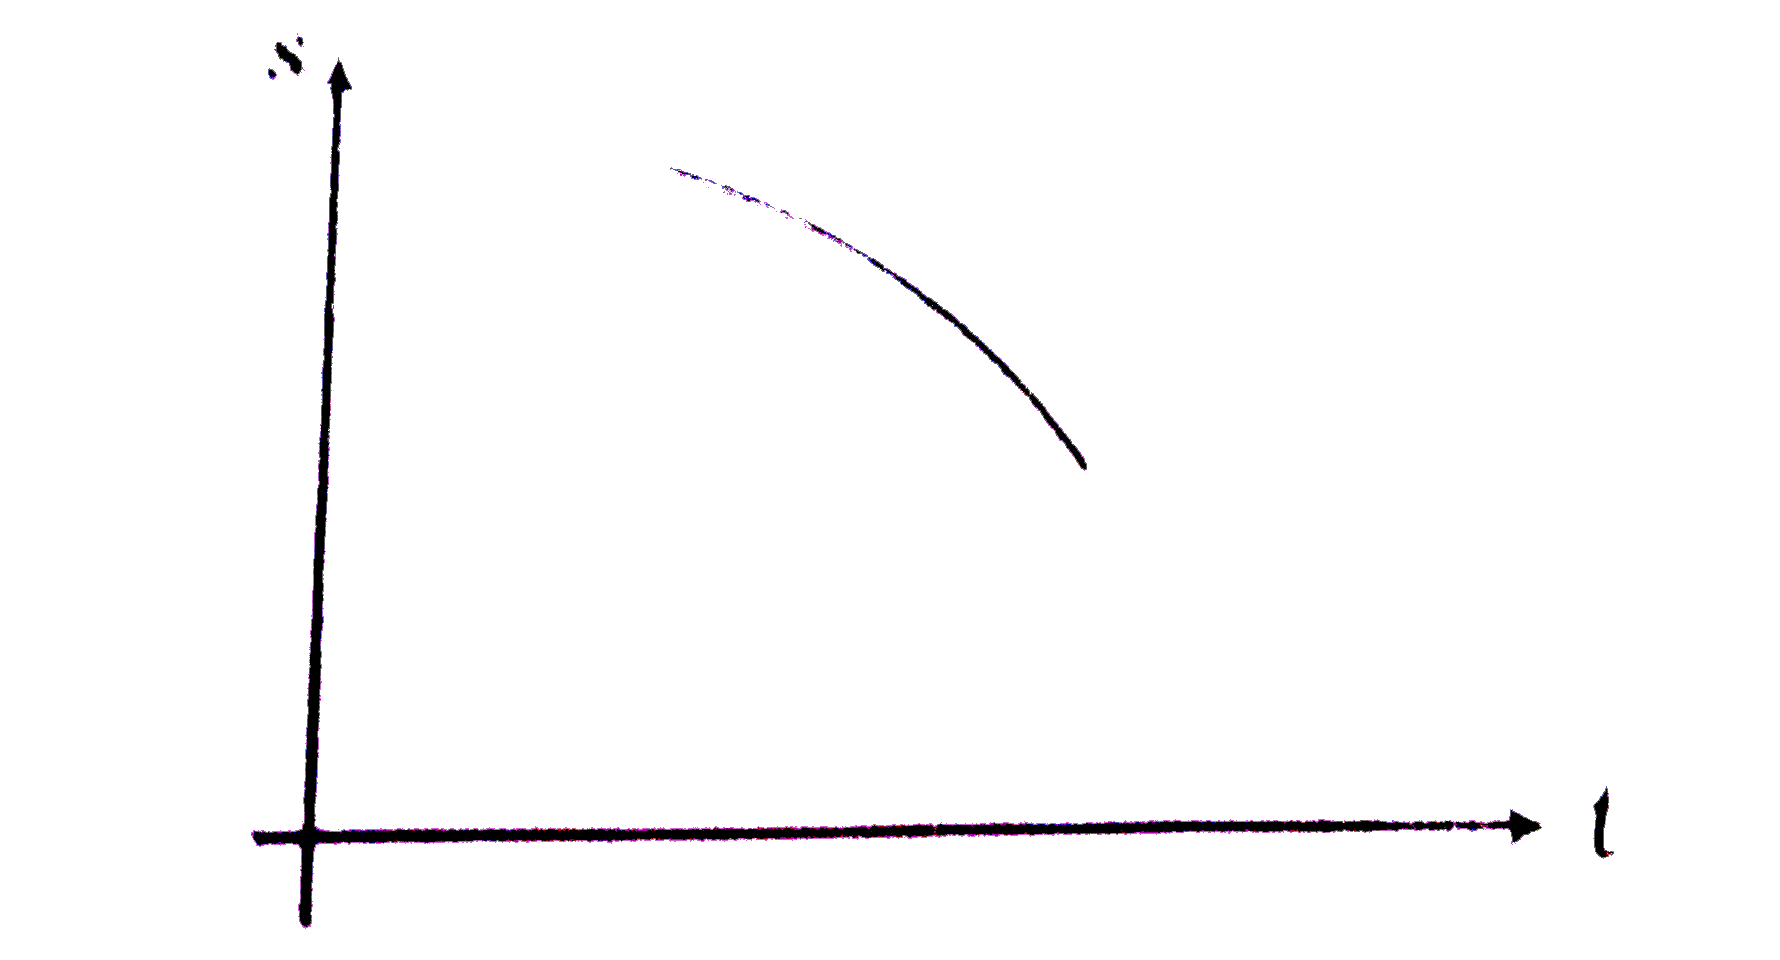
Reason : Slope of s-t graph is negative and increasing in magnitude.
View Solution
Knowledge Check
Which of the following displacement-time graphs represent damped harmonic oscillation?
A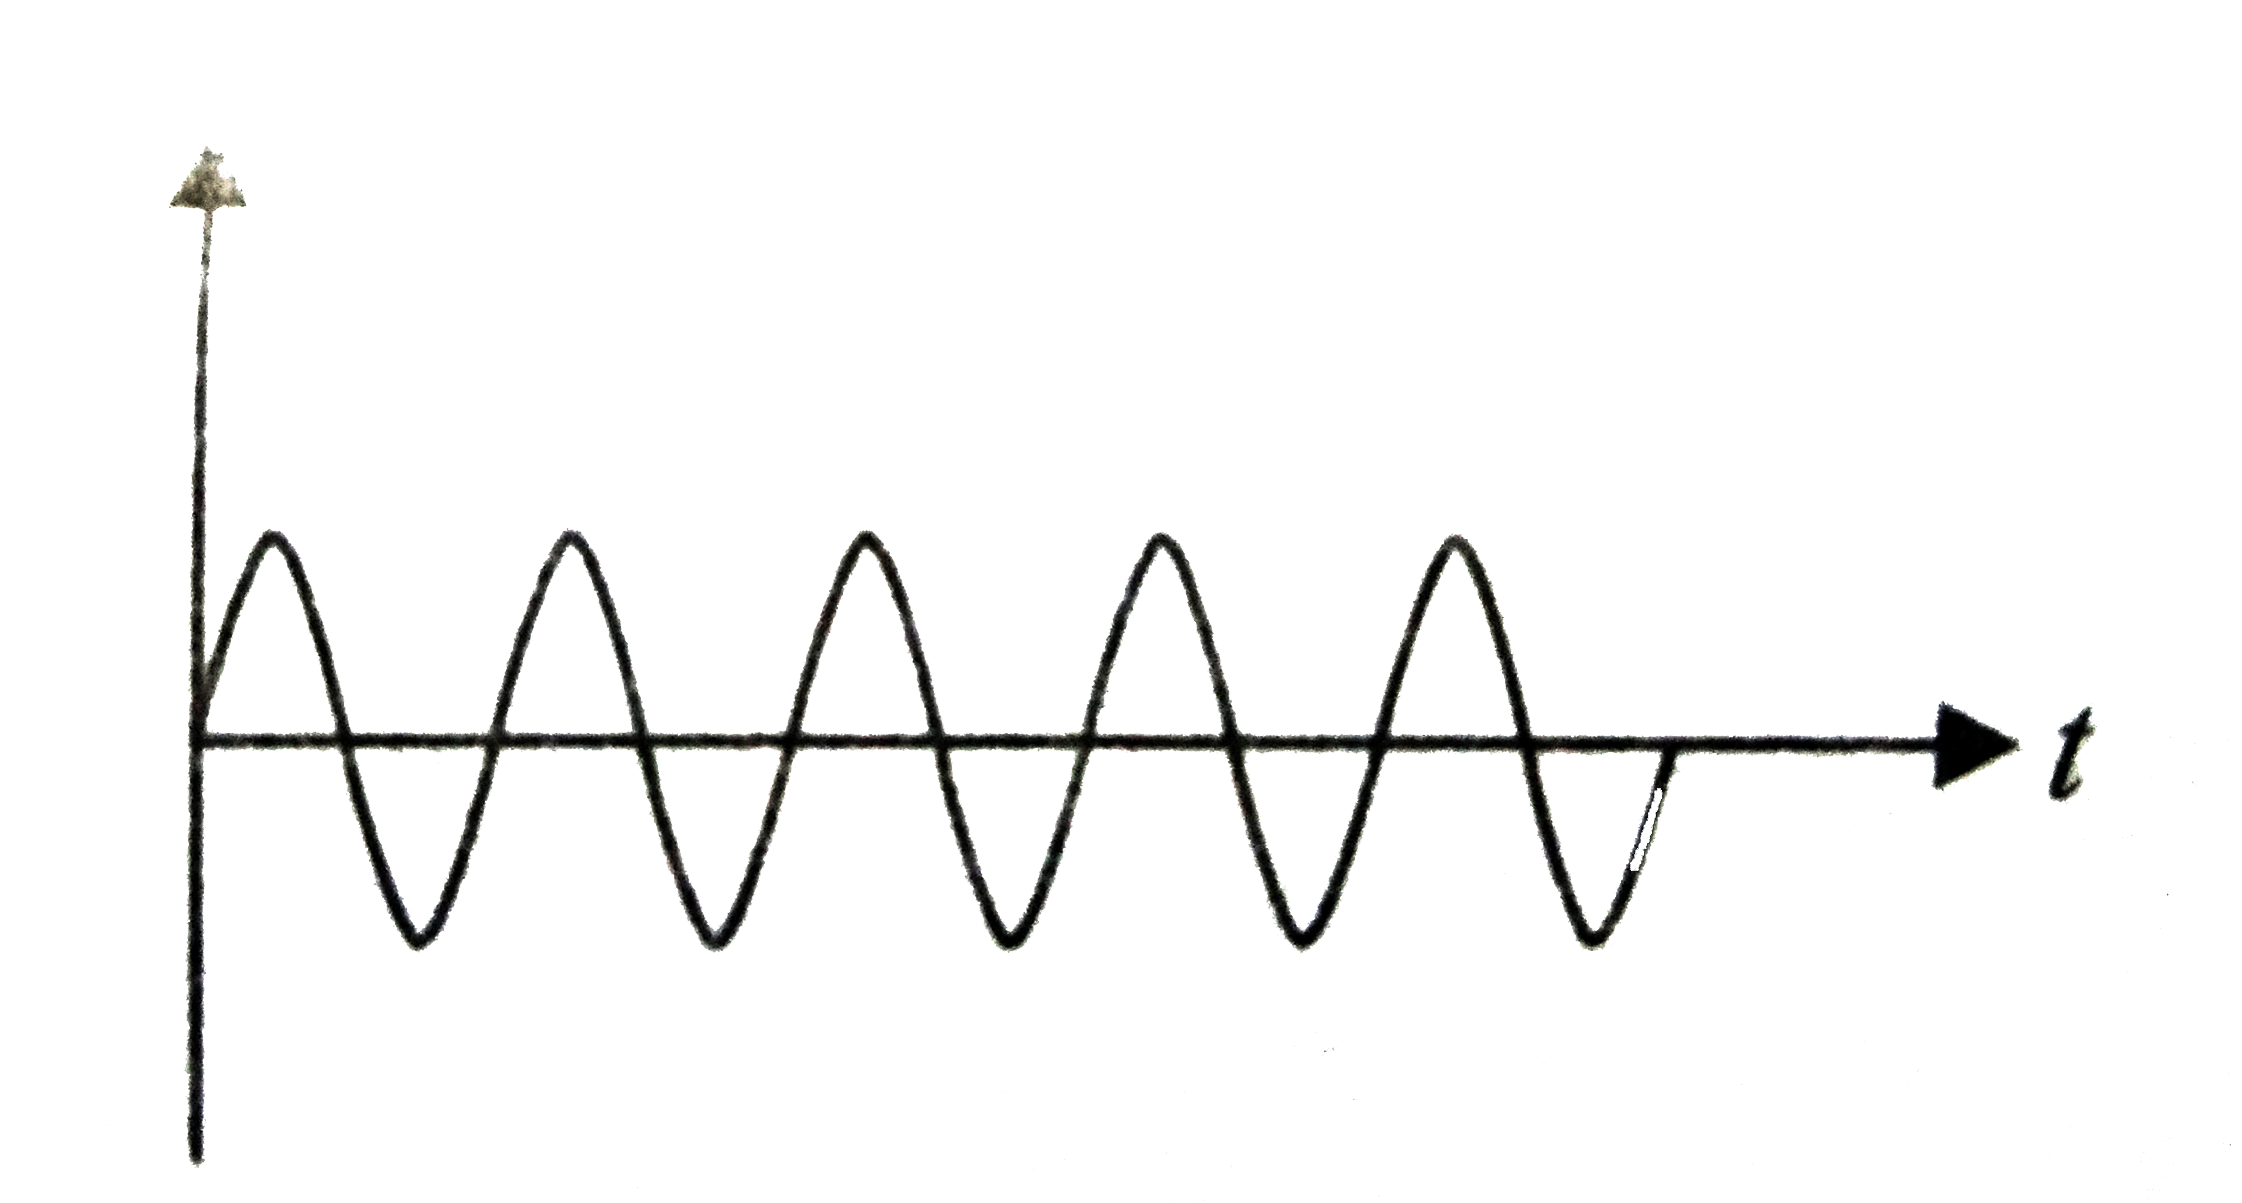 B
B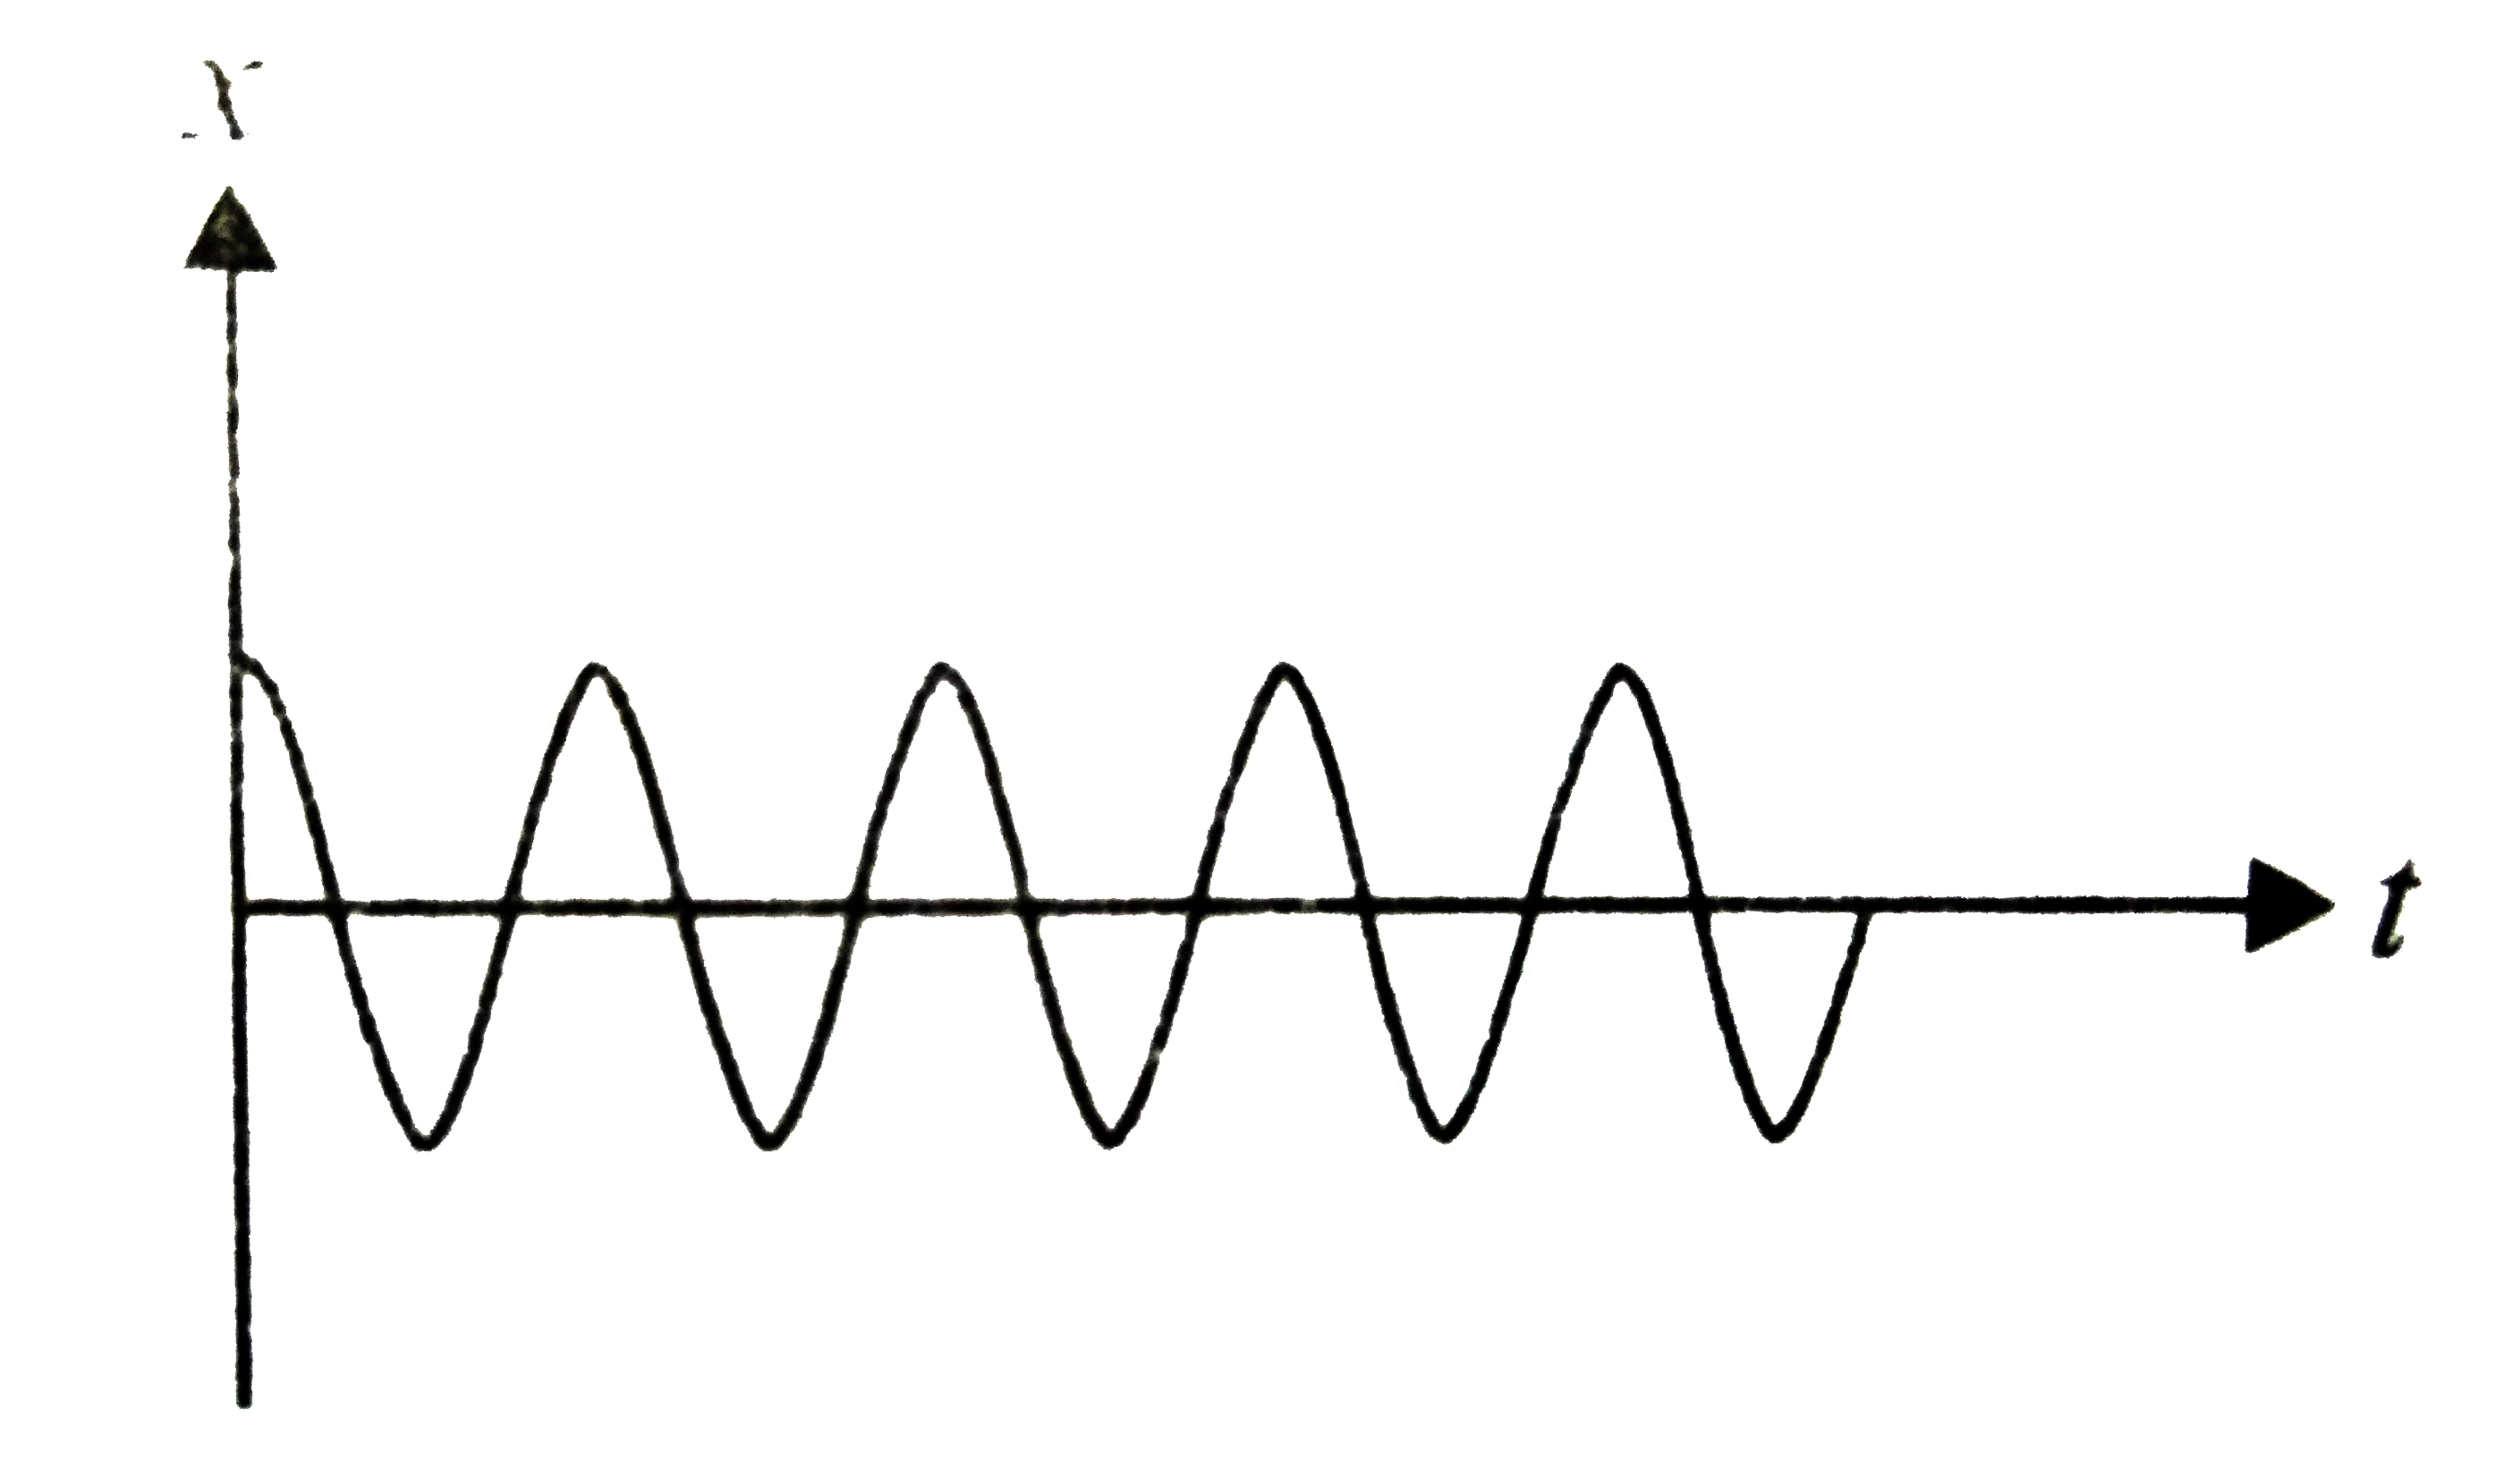 C
C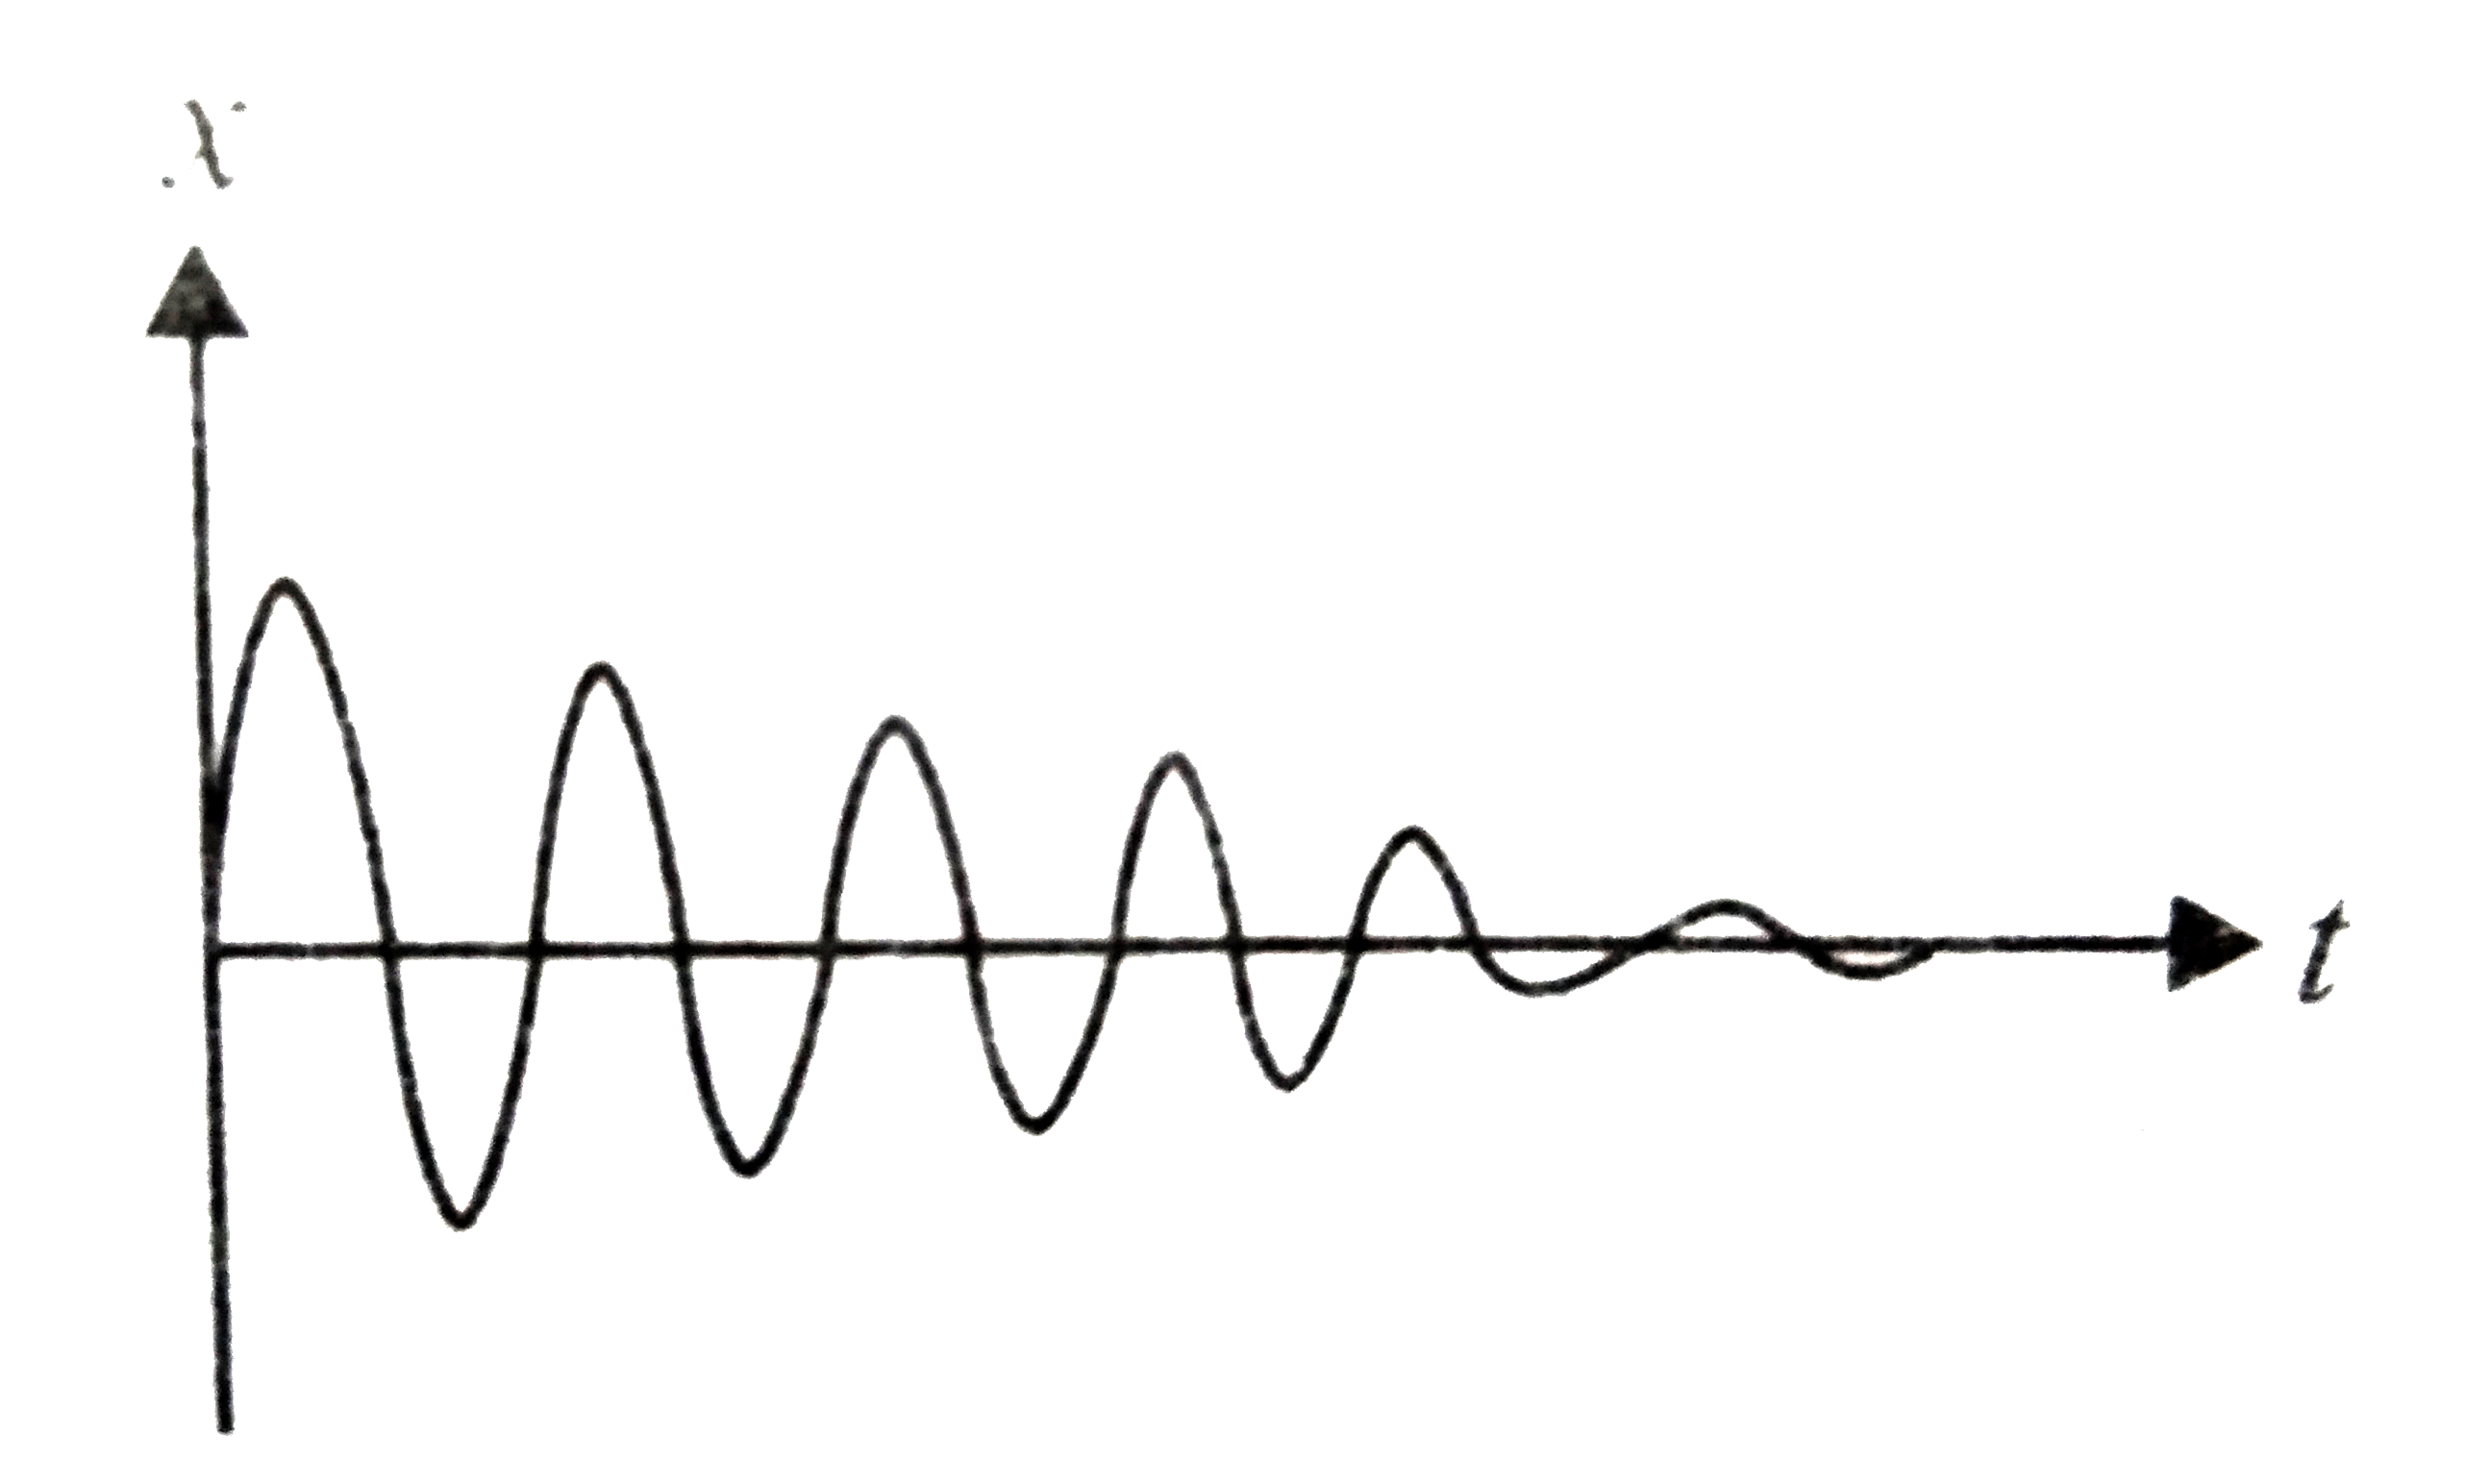 D
D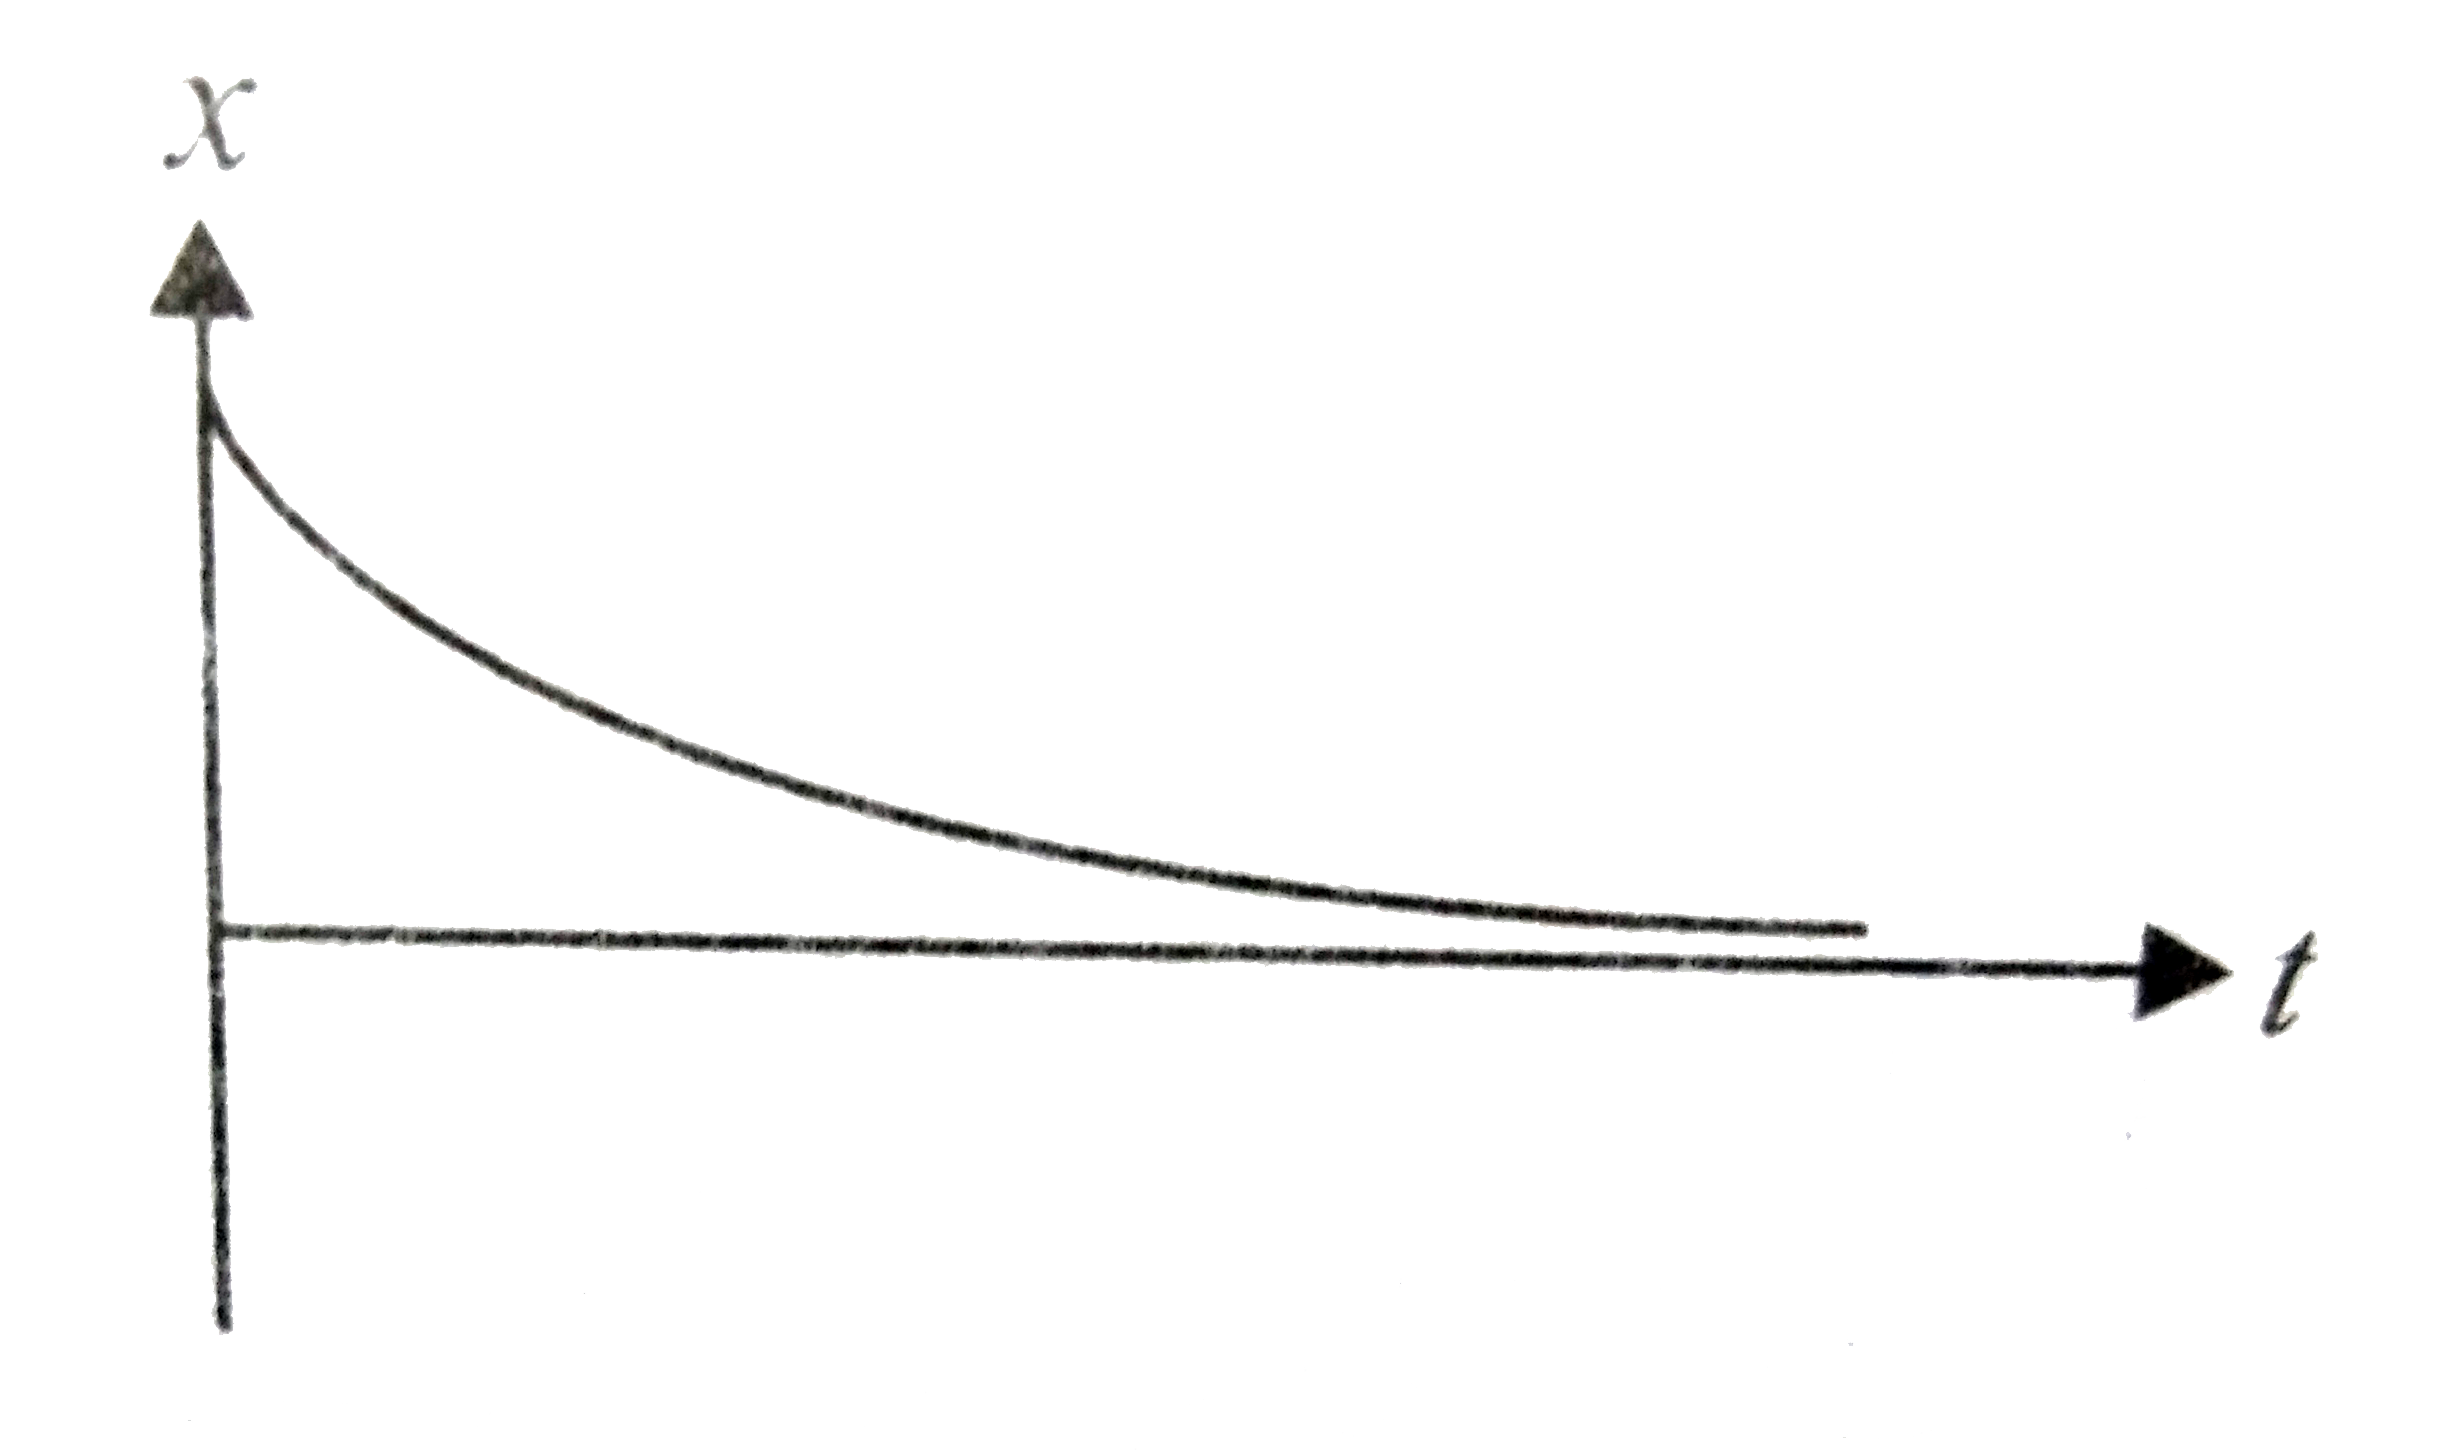
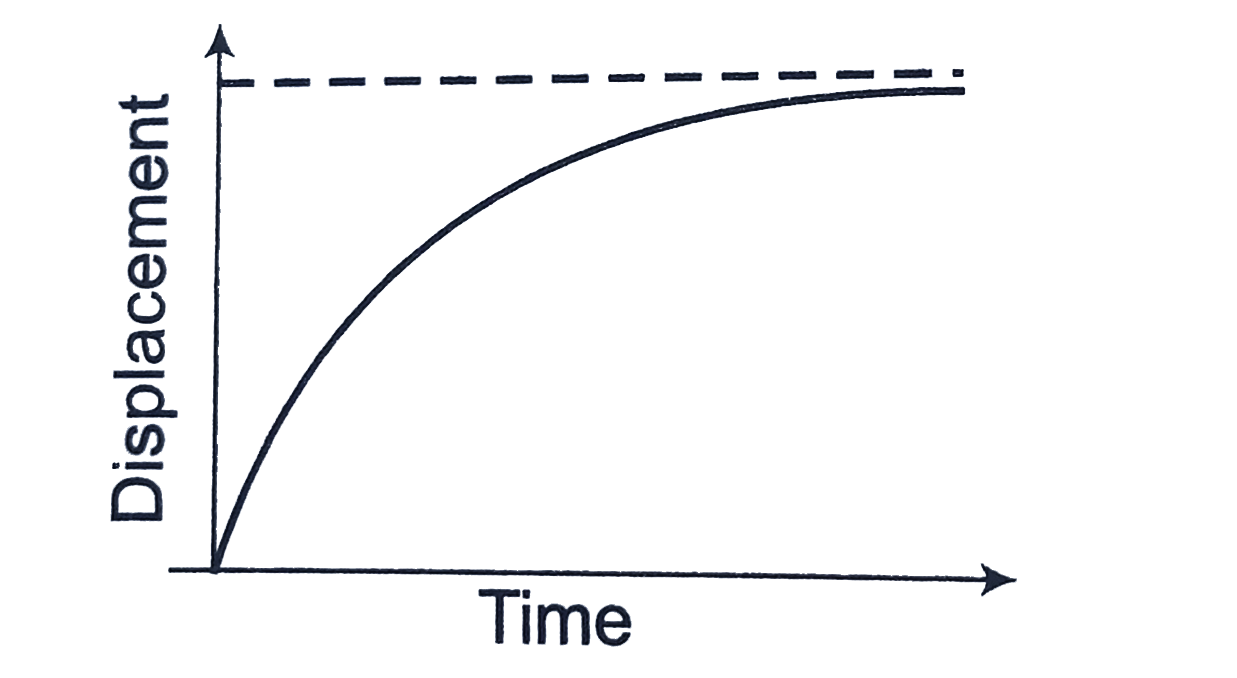
The displacement-time graph of a particle is as shown below. It indicates that
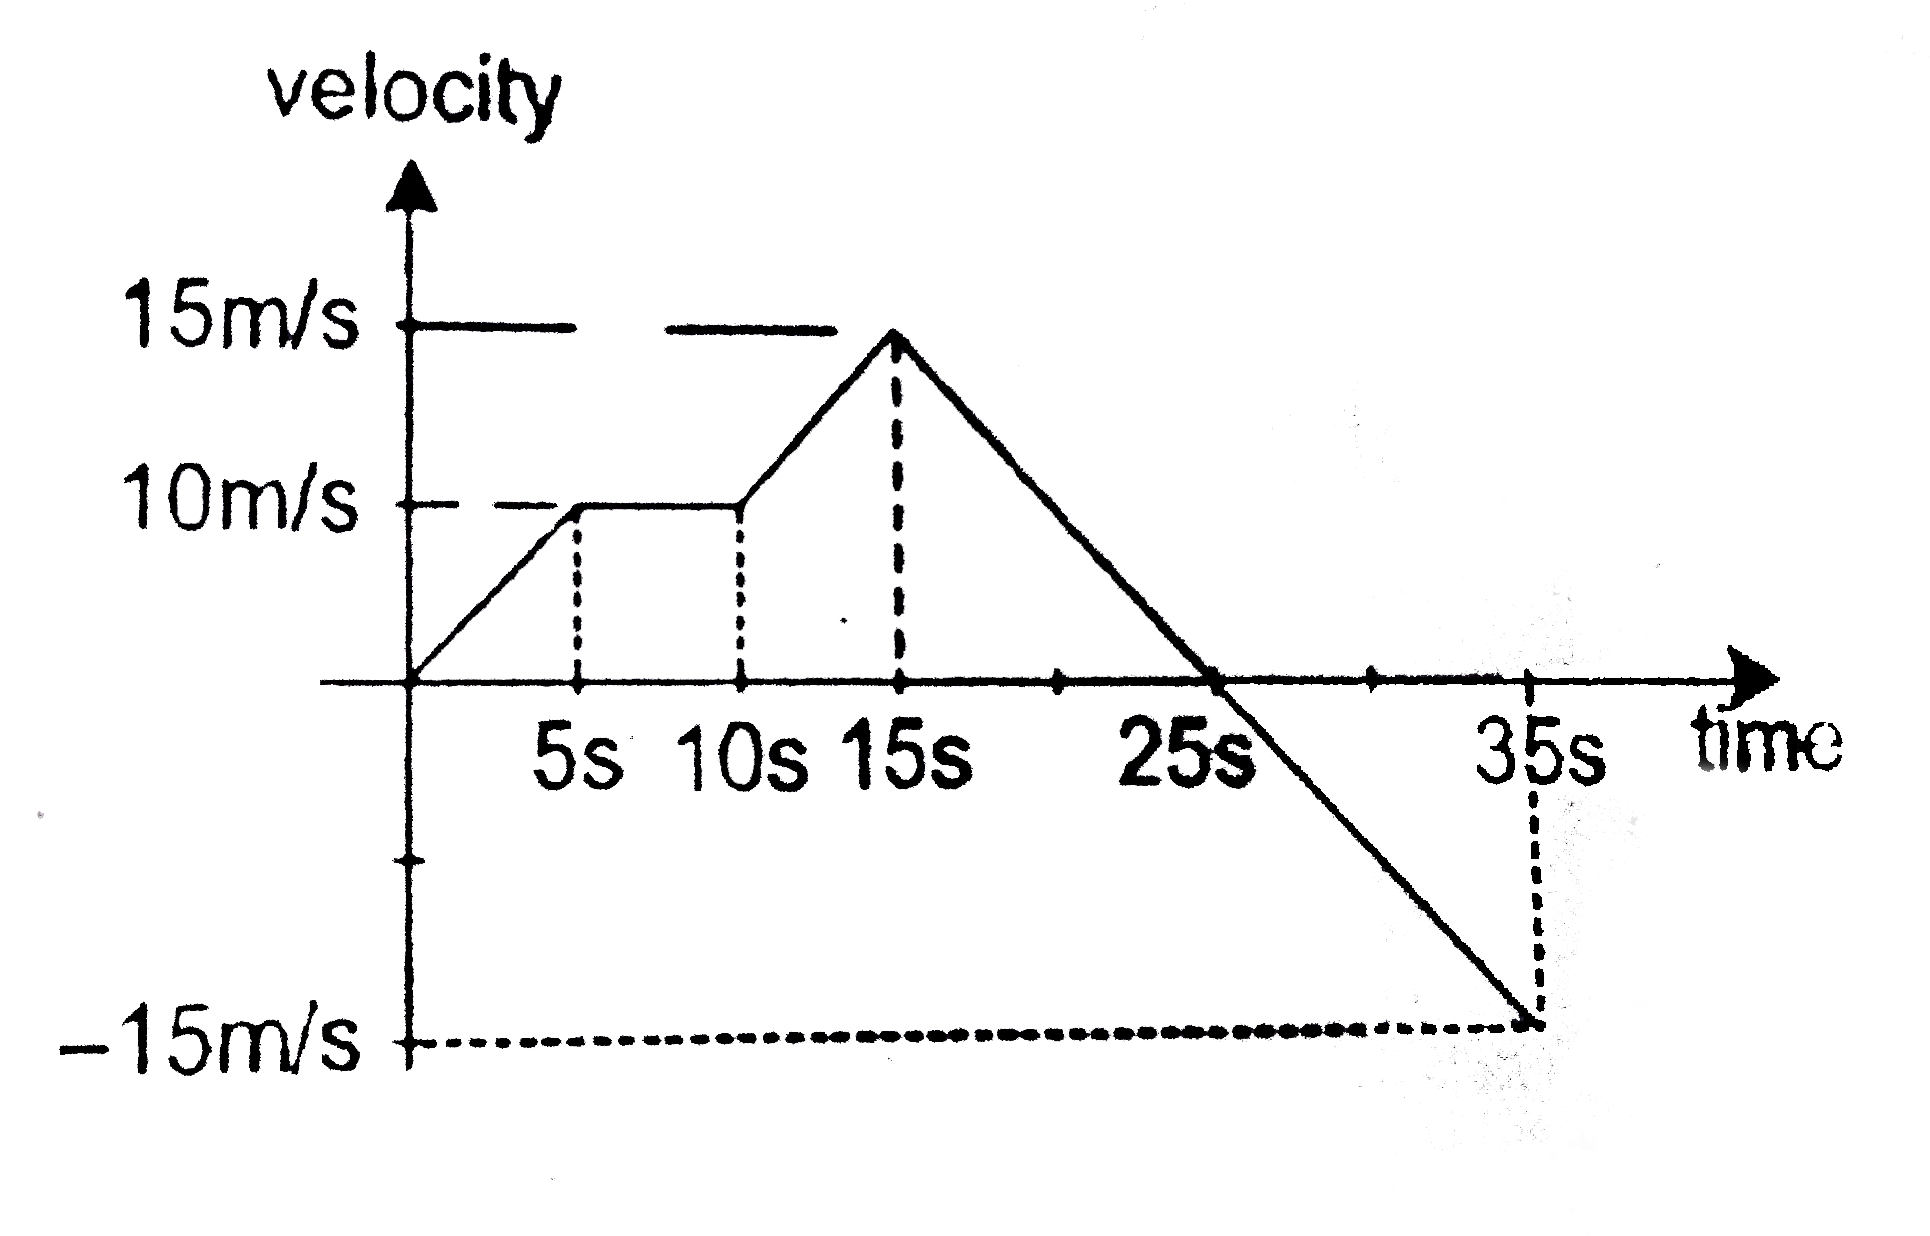
View SolutionA person starts from origin and for his linear motion velocity is given as shown in figure. Draw displacement and acceleration graph with respect to time. Also find maximum displacement of the person.
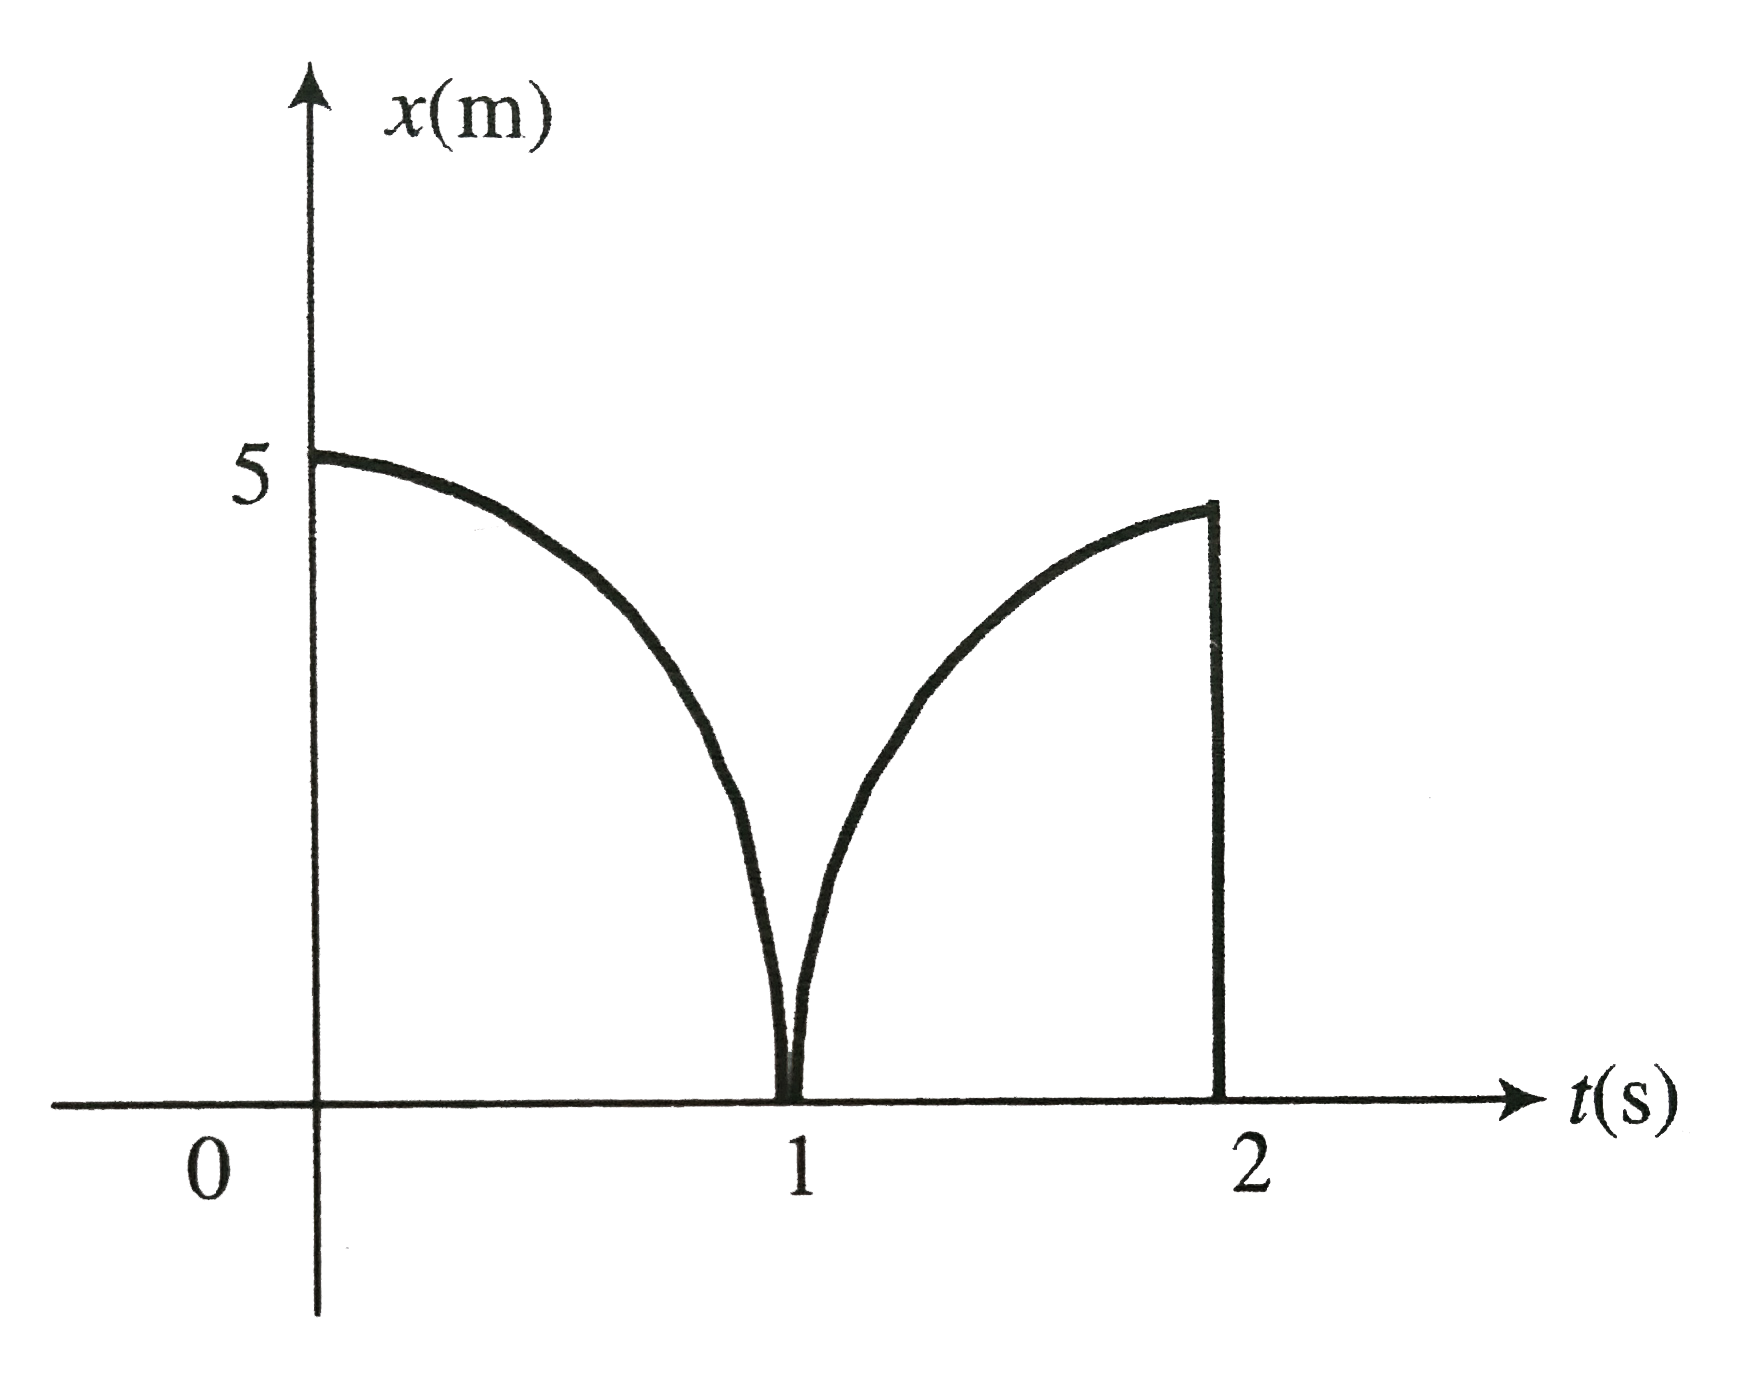
View SolutionThe displacement-time graph of a moving particle with constant acceleration is shown in. The velocit-time is given by
 .
.
View SolutionThe velocity − time graph of a particle is as shown in figure

View SolutionWhat does the slope of a displacement-time graph represent?
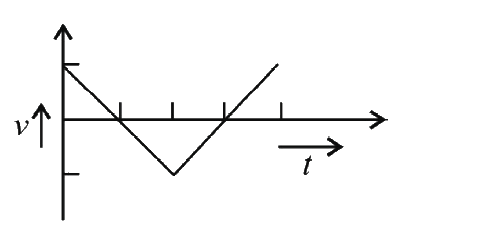
View SolutionThe graph in figure shows the velocity v versus time t for a body. Which of the graphs shown in figure represents the correesponding acceleration versus time graphs ?
View SolutionThe displacement-time graph of a body is shown in.
 .
.
The velocity-time graph of the motion of the body will be .
View Solution
