A ball is thrown downward with some velocity into a.viscous liquid. Which of the following curves represents correct variation for velocity versus time?
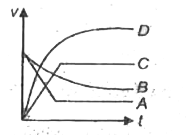
A
B
C
D
Step by step video & image solution for A ball is thrown downward with some velocity into a.viscous liquid. Which of the following curves represents correct variation for velocity versus time? by Physics experts to help you in doubts & scoring excellent marks in Class 12 exams.
Updated on:21/07/2023Similar Questions
Which of the following curve represent variation of density of water with temperature best-
View SolutionA spherical ball is dropped in a long column of viscous liquid. Which of the following graphs represent the variation of
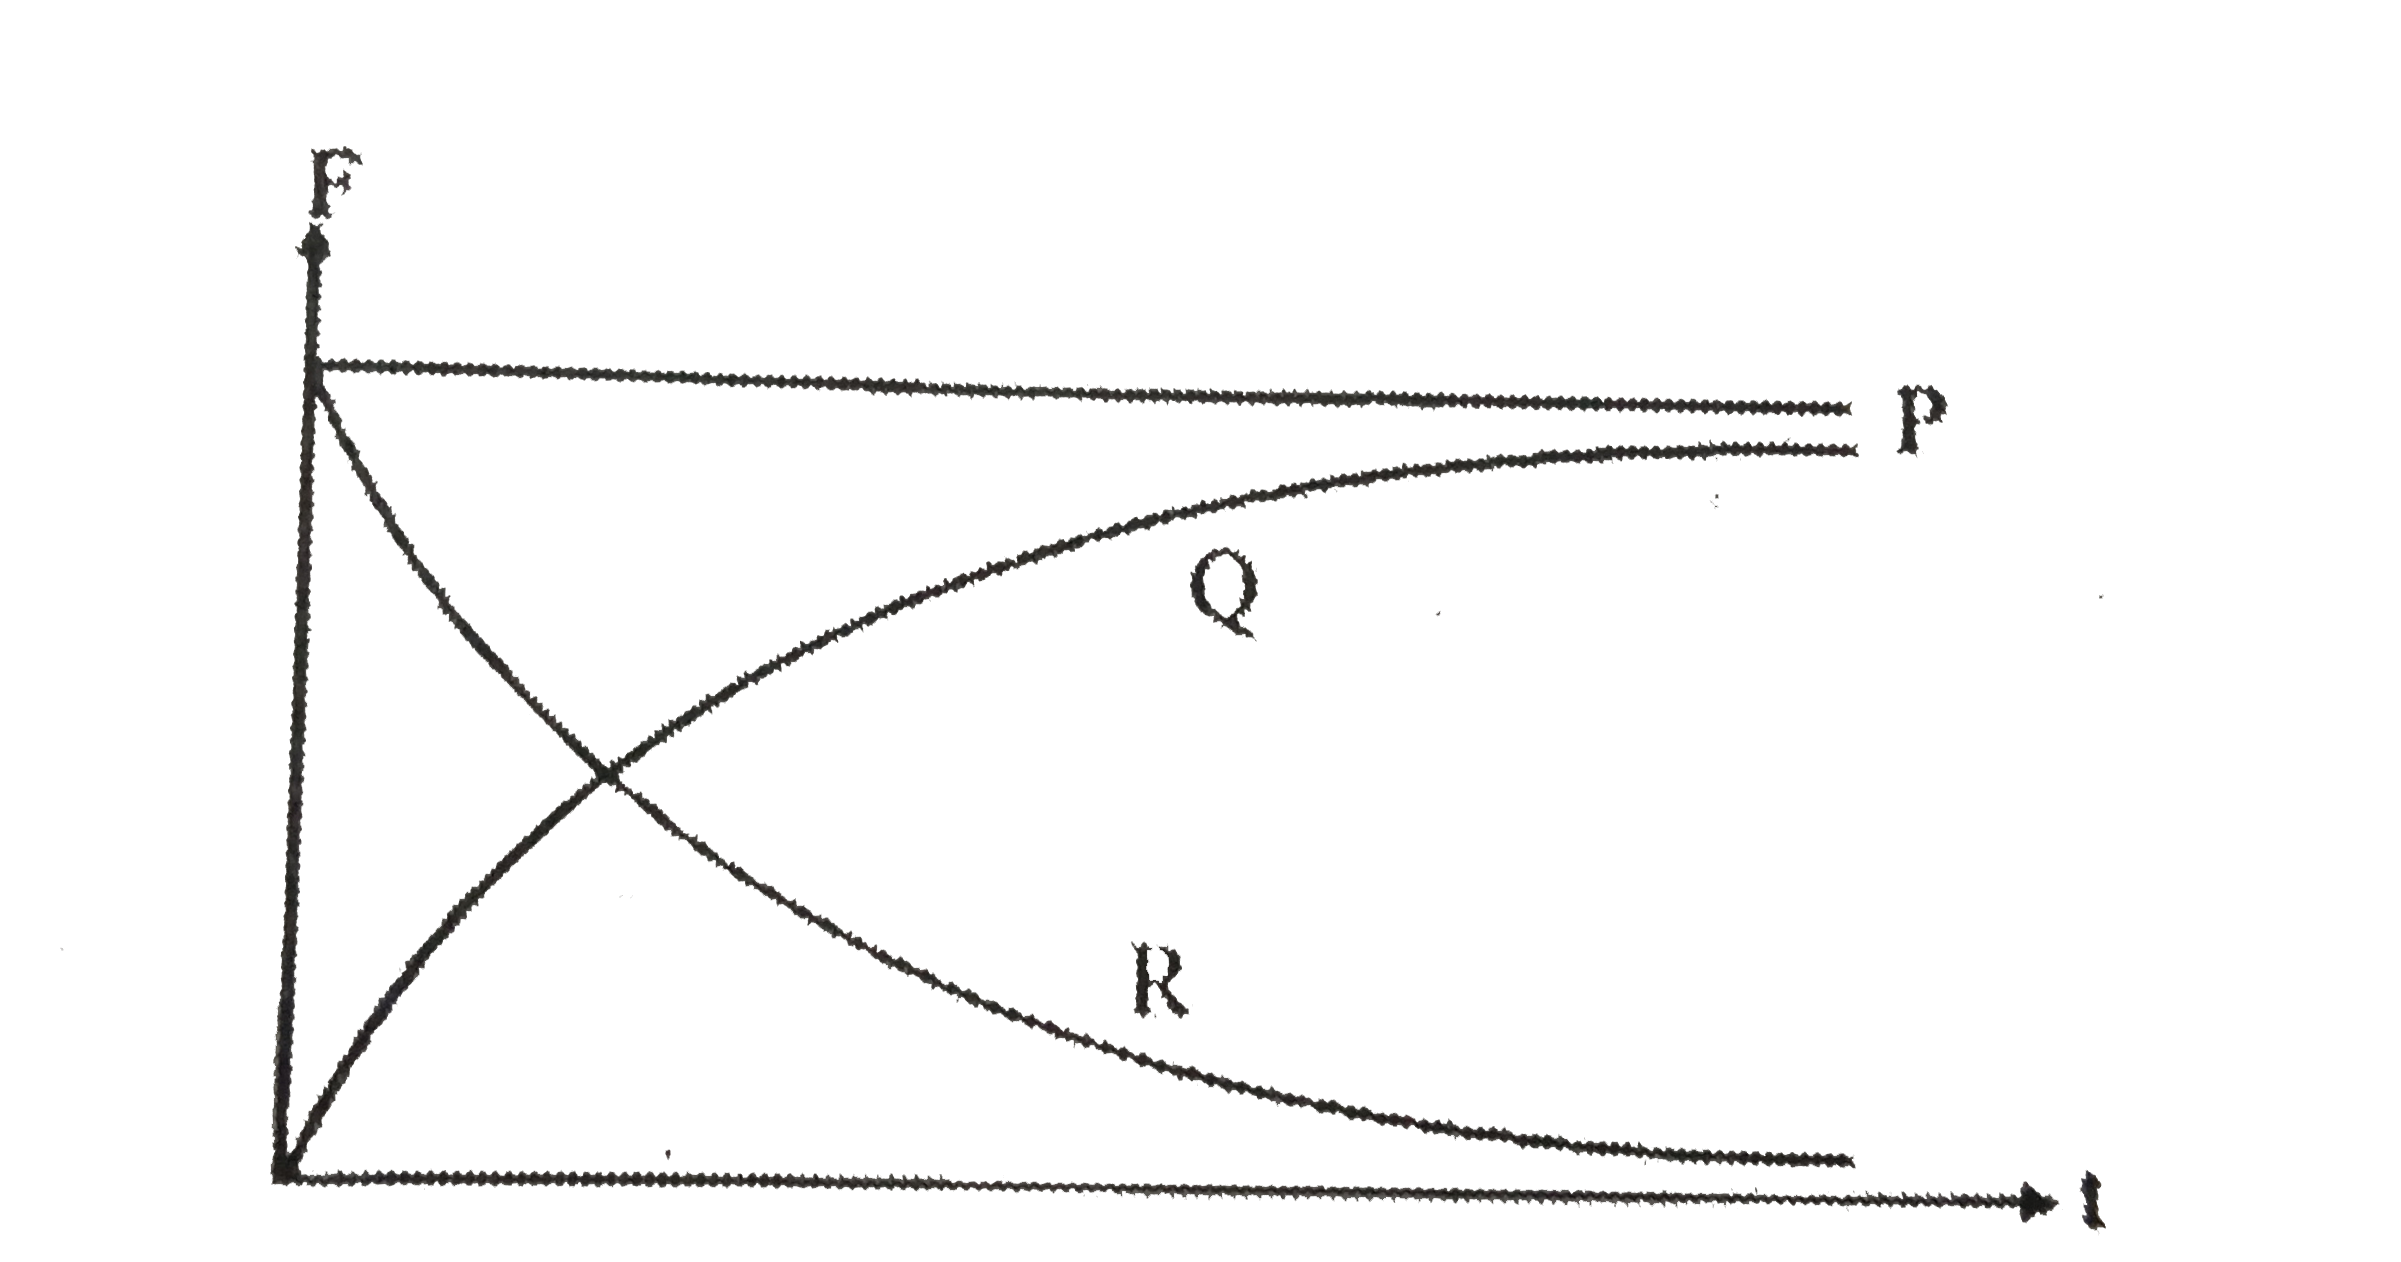
(l) gravitational force with time
(ii) viscous force with time
(iii) net force acting on the ball with time
View Solution_E01_122_Q01.png)
A spherical ball is dropped in a long column of viscous liquid. Which of the following graphs represents the variation of-
(i). Gravitaional force with time
(ii). Viscous force with time
(iii). Net force acting on the ball with time
View SolutionA ball thrown vertically upward with initial velocity u. Which of the following graphs represent the velocity of ball correctly as function of time?
(Take upward direction as positive)
View SolutionThe graph shown the variation with times t of the velocity v of an object . Which one of the following graphs best represents the variation of acceleration a of the object with time t?

View SolutionA body is thrown vertically upwards. Which one of the following graphs correctly represent the velocity vs time?
View SolutionWhich of the following velocity-time graphs represent uniform motion
View SolutionThe graph in figure shows the velocity v versus time t for a body. Which of the graphs shown in figure represents the correesponding acceleration versus time graphs ?
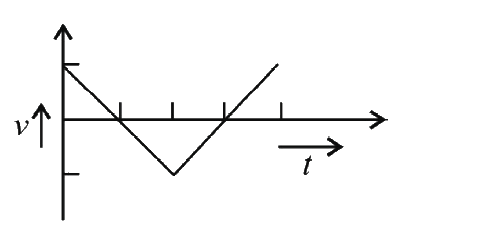
View SolutionThe graph below shws the velocity versus time graph for a body
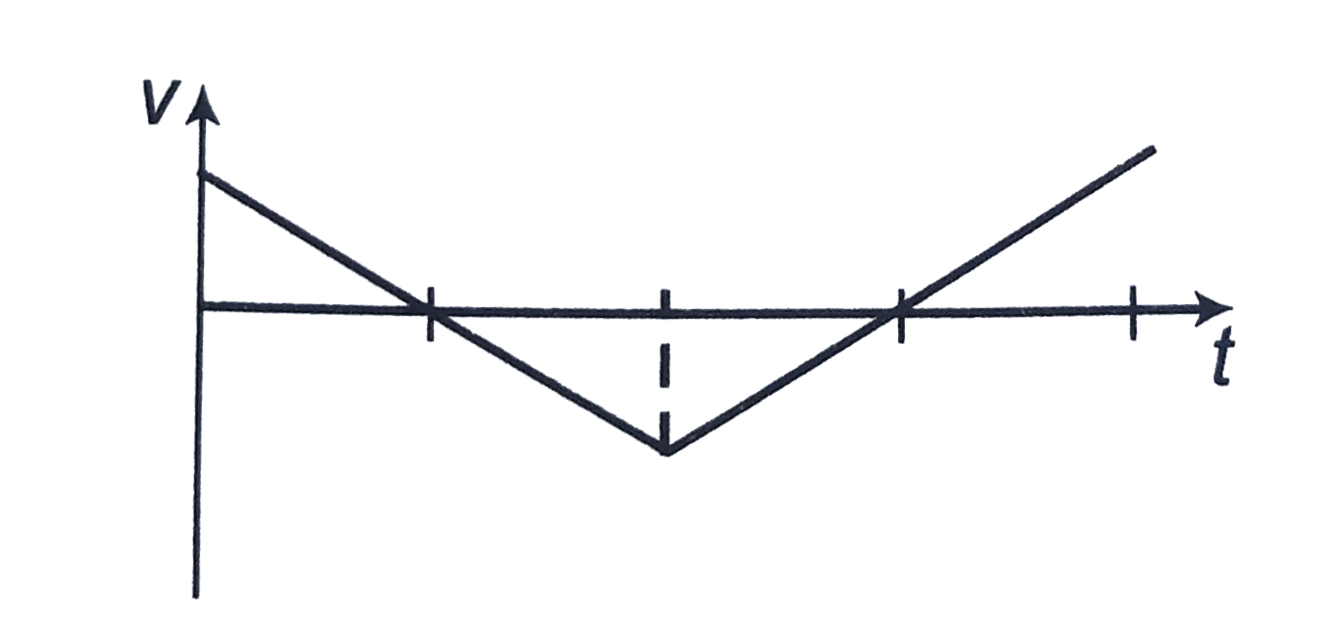
Which of the following graph represents the corresponding acceleration v//s time graph?
View SolutionThe given curve represents the variation of temperatue as a function of volume for one mole of an ideal gas. Which of the following curves best represents the variation of pressure as a function of volume ?
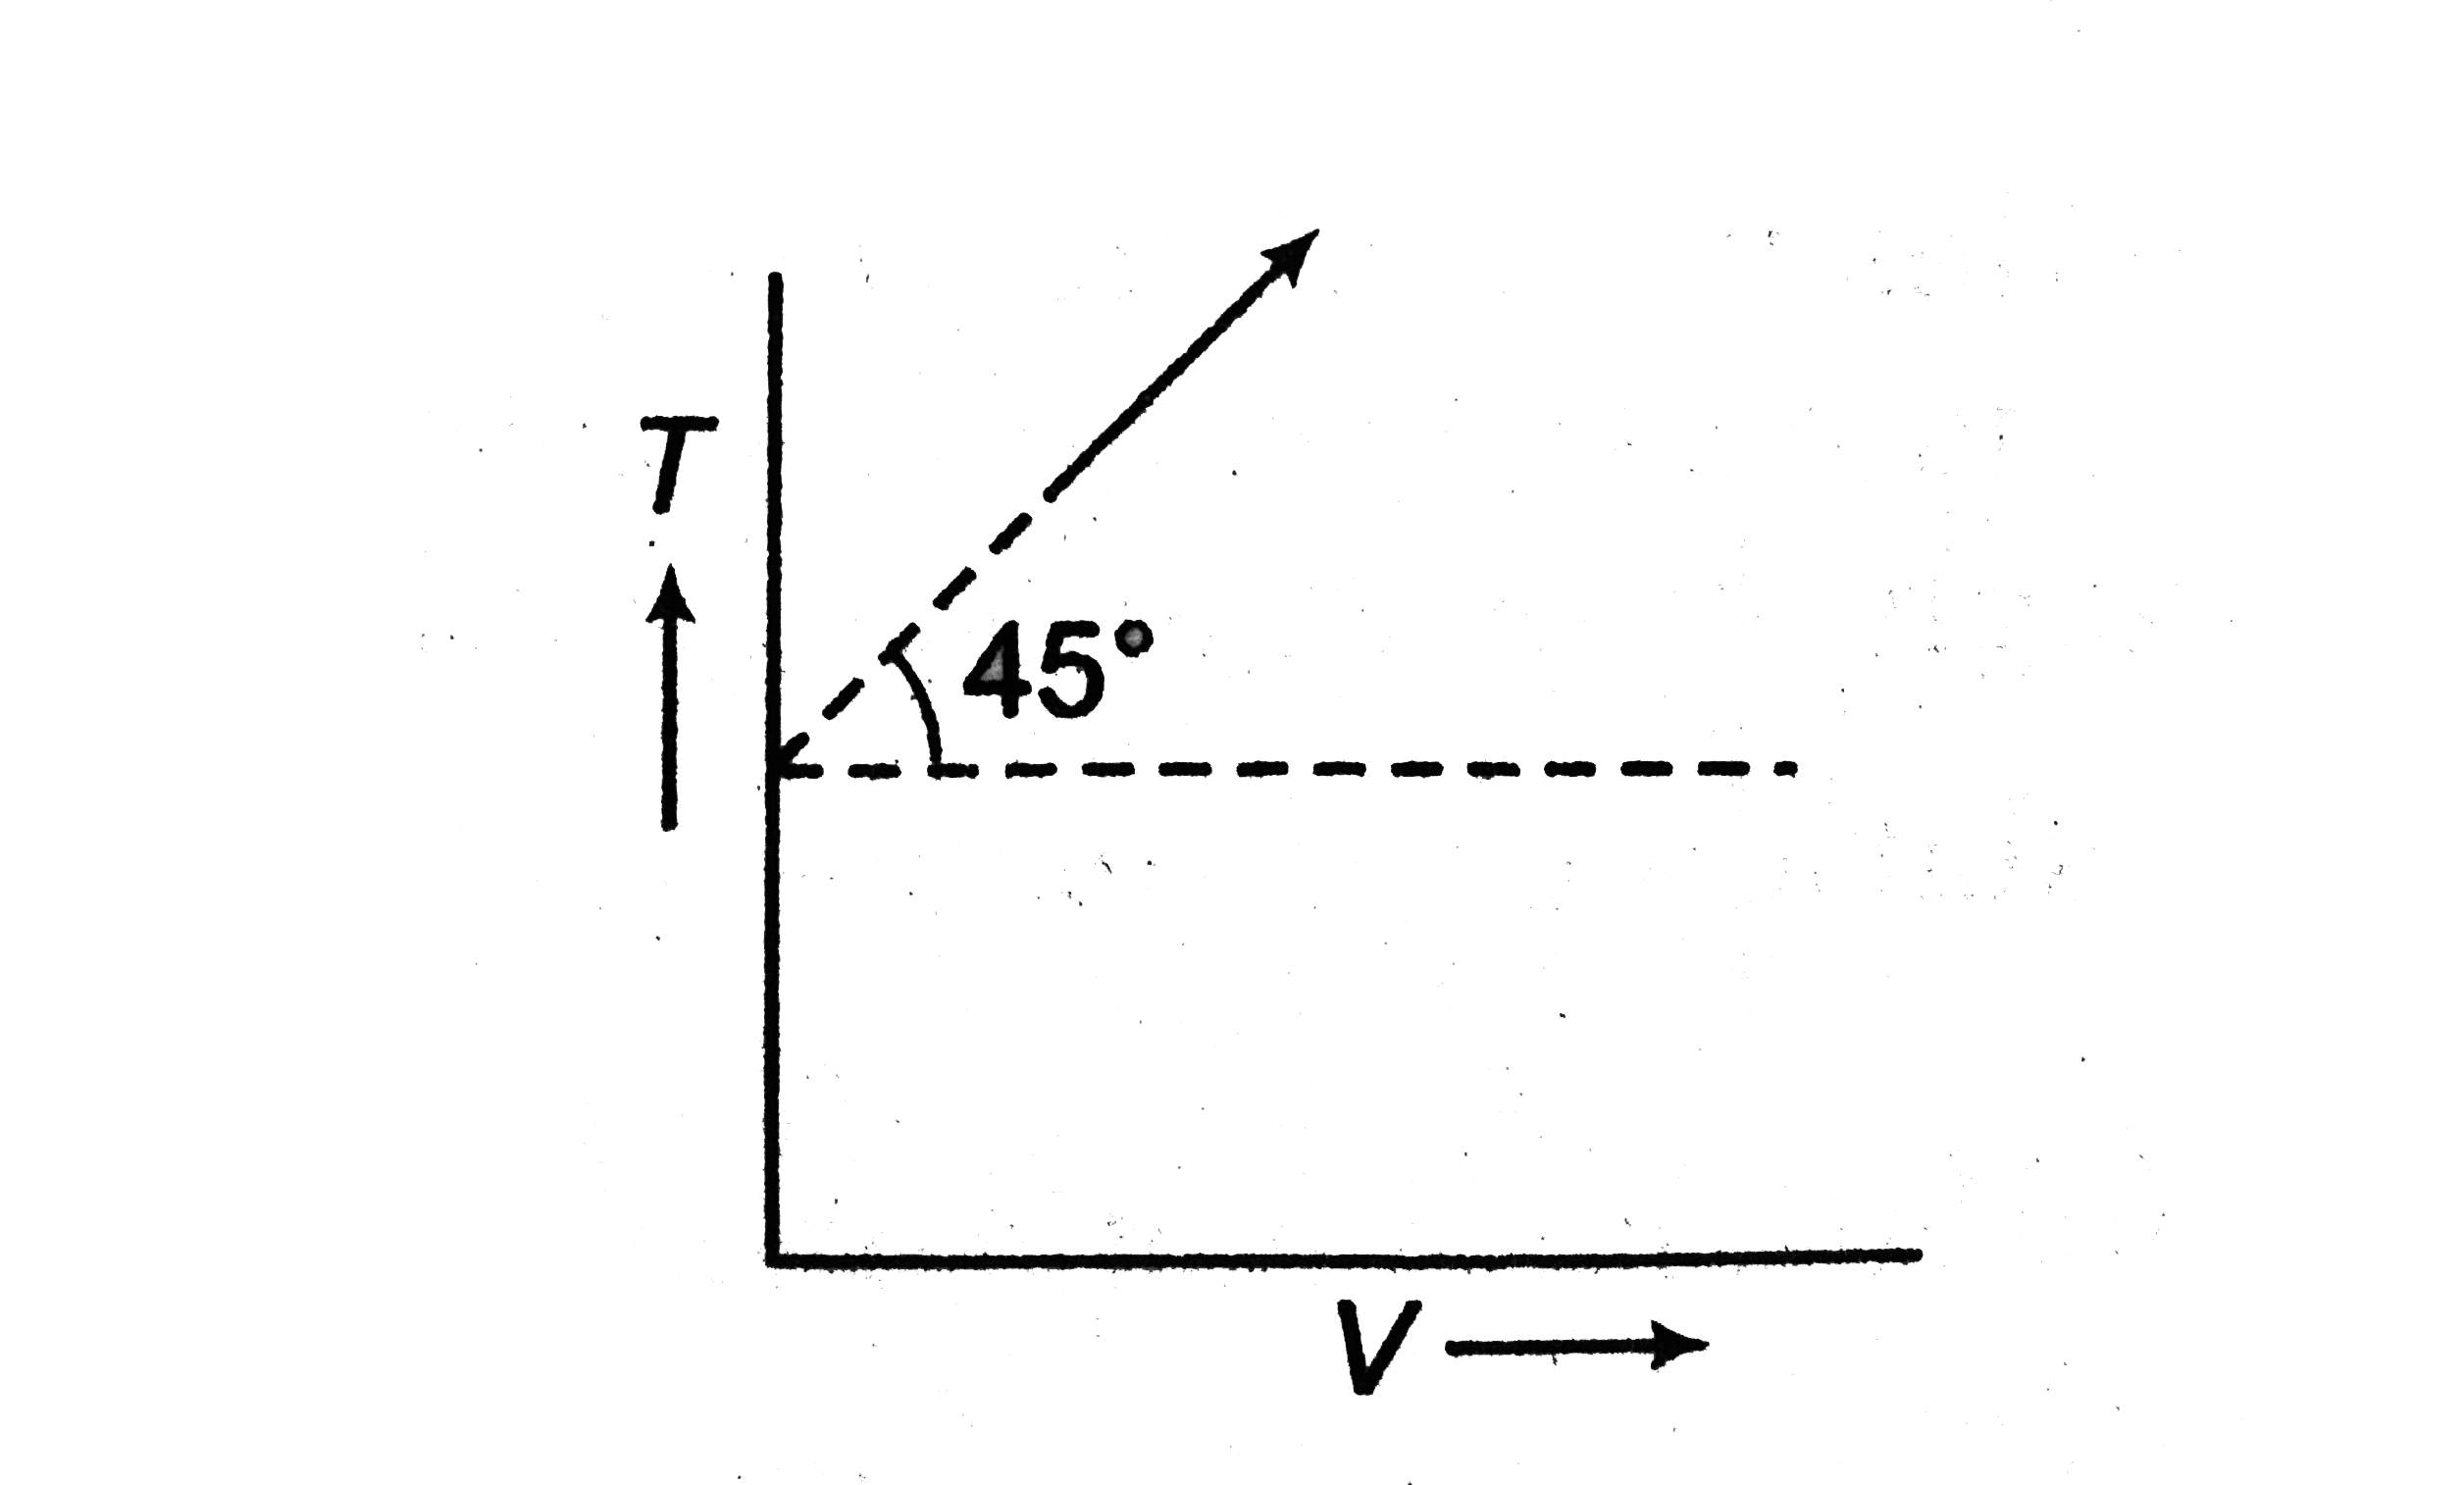 .
.
View Solution
