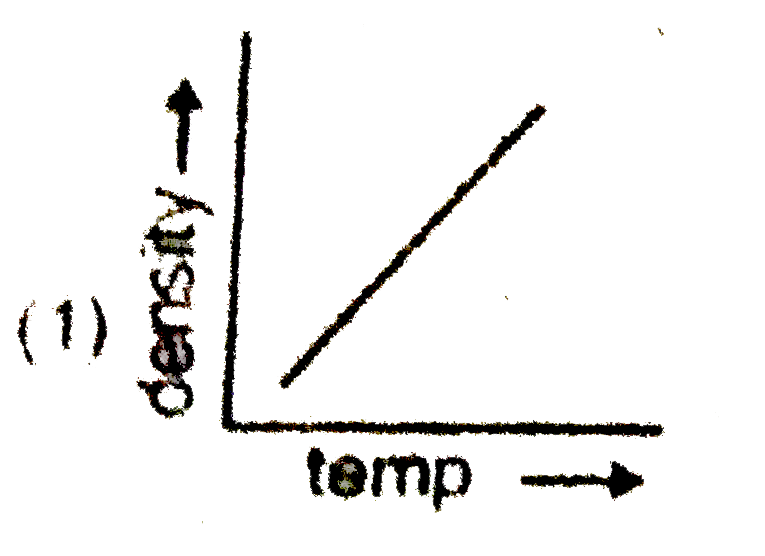
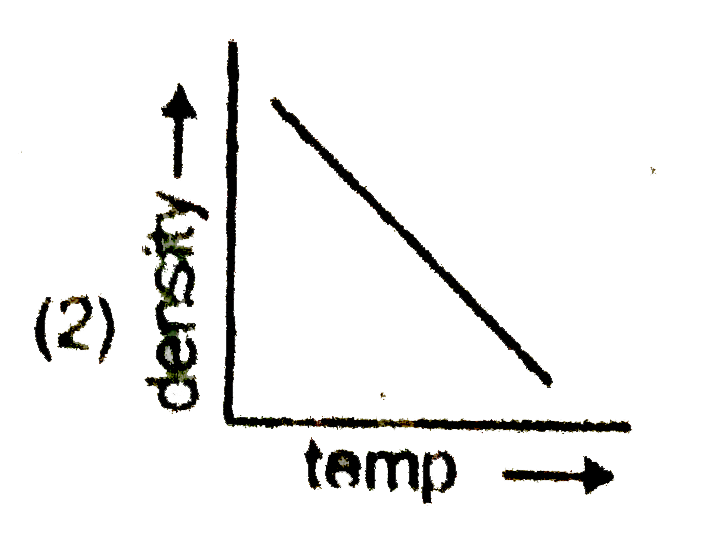
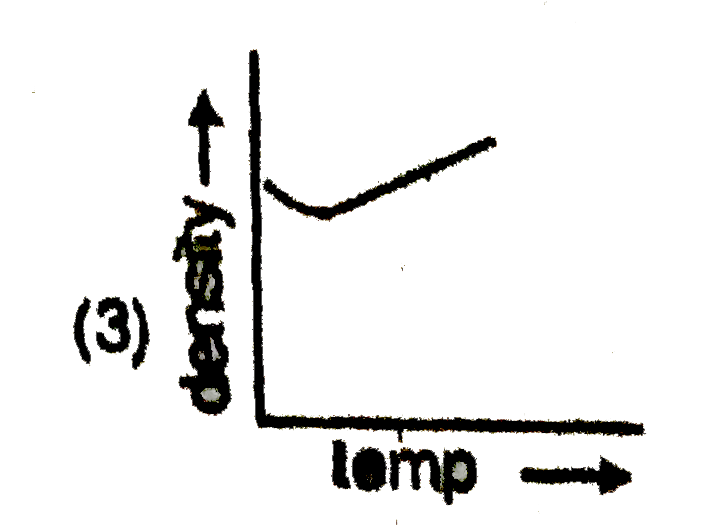
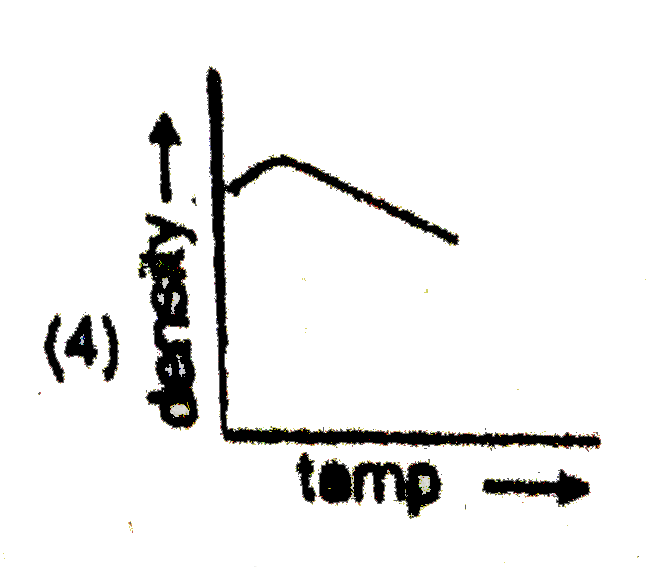
Which of the following curve represent variation of density of water with temperature best-
The correct Answer is:D
To determine the variation of density of water with temperature, we need to analyze the behavior of water as its temperature changes, particularly around the critical temperature of 4 degrees Celsius.
1. Understanding Density:
Density (ρ) is defined as mass (m) per unit volume (V):
ρ=mV
2. Behavior of Water at Different Temperatures:
- At 0 degrees Celsius and below, water exists in a solid state (ice). In this state, the molecules are closely packed, leading to a relatively high density.
- As the temperature increases from 0 degrees Celsius to 4 degrees Celsius, the density of water increases. This is because the structure of ice breaks down, and the water molecules become more compact.
3. Maximum Density at 4 Degrees Celsius:
- At 4 degrees Celsius, water reaches its maximum density. This is a unique property of water, where it is denser than at both lower and higher temperatures.
4. Behavior Above 4 Degrees Celsius:
- When the temperature exceeds 4 degrees Celsius, the density of water begins to decrease. This is because the water molecules gain energy, move apart, and occupy a larger volume, thus reducing the density.
5. Graphical Representation:
- The graph representing the density of water versus temperature will show an increase in density as the temperature rises from 0 to 4 degrees Celsius, reaching a peak at 4 degrees Celsius, and then a decrease in density as the temperature continues to rise beyond 4 degrees Celsius.
6. Conclusion:
- The curve that best represents the variation of density of water with temperature will show a peak at 4 degrees Celsius, indicating maximum density, followed by a decline in density as the temperature increases further.
Final Answer:
The correct option is the one that represents a curve with a maximum point at 4 degrees Celsius, indicating that the density of water is highest at this temperature and decreases on either side of it.
---
Density (ρ) is defined as mass (m) per unit volume (V):
ρ=mV
- At 0 degrees Celsius and below, water exists in a solid state (ice). In this state, the molecules are closely packed, leading to a relatively high density.
- As the temperature increases from 0 degrees Celsius to 4 degrees Celsius, the density of water increases. This is because the structure of ice breaks down, and the water molecules become more compact.
- At 4 degrees Celsius, water reaches its maximum density. This is a unique property of water, where it is denser than at both lower and higher temperatures.
- When the temperature exceeds 4 degrees Celsius, the density of water begins to decrease. This is because the water molecules gain energy, move apart, and occupy a larger volume, thus reducing the density.
- The graph representing the density of water versus temperature will show an increase in density as the temperature rises from 0 to 4 degrees Celsius, reaching a peak at 4 degrees Celsius, and then a decrease in density as the temperature continues to rise beyond 4 degrees Celsius.
- The curve that best represents the variation of density of water with temperature will show a peak at 4 degrees Celsius, indicating maximum density, followed by a decline in density as the temperature increases further.
The correct option is the one that represents a curve with a maximum point at 4 degrees Celsius, indicating that the density of water is highest at this temperature and decreases on either side of it.
Topper's Solved these Questions
Similar Questions
Knowledge Check
Which of the following graph shows the variationi of density of water increase in temperature ?
A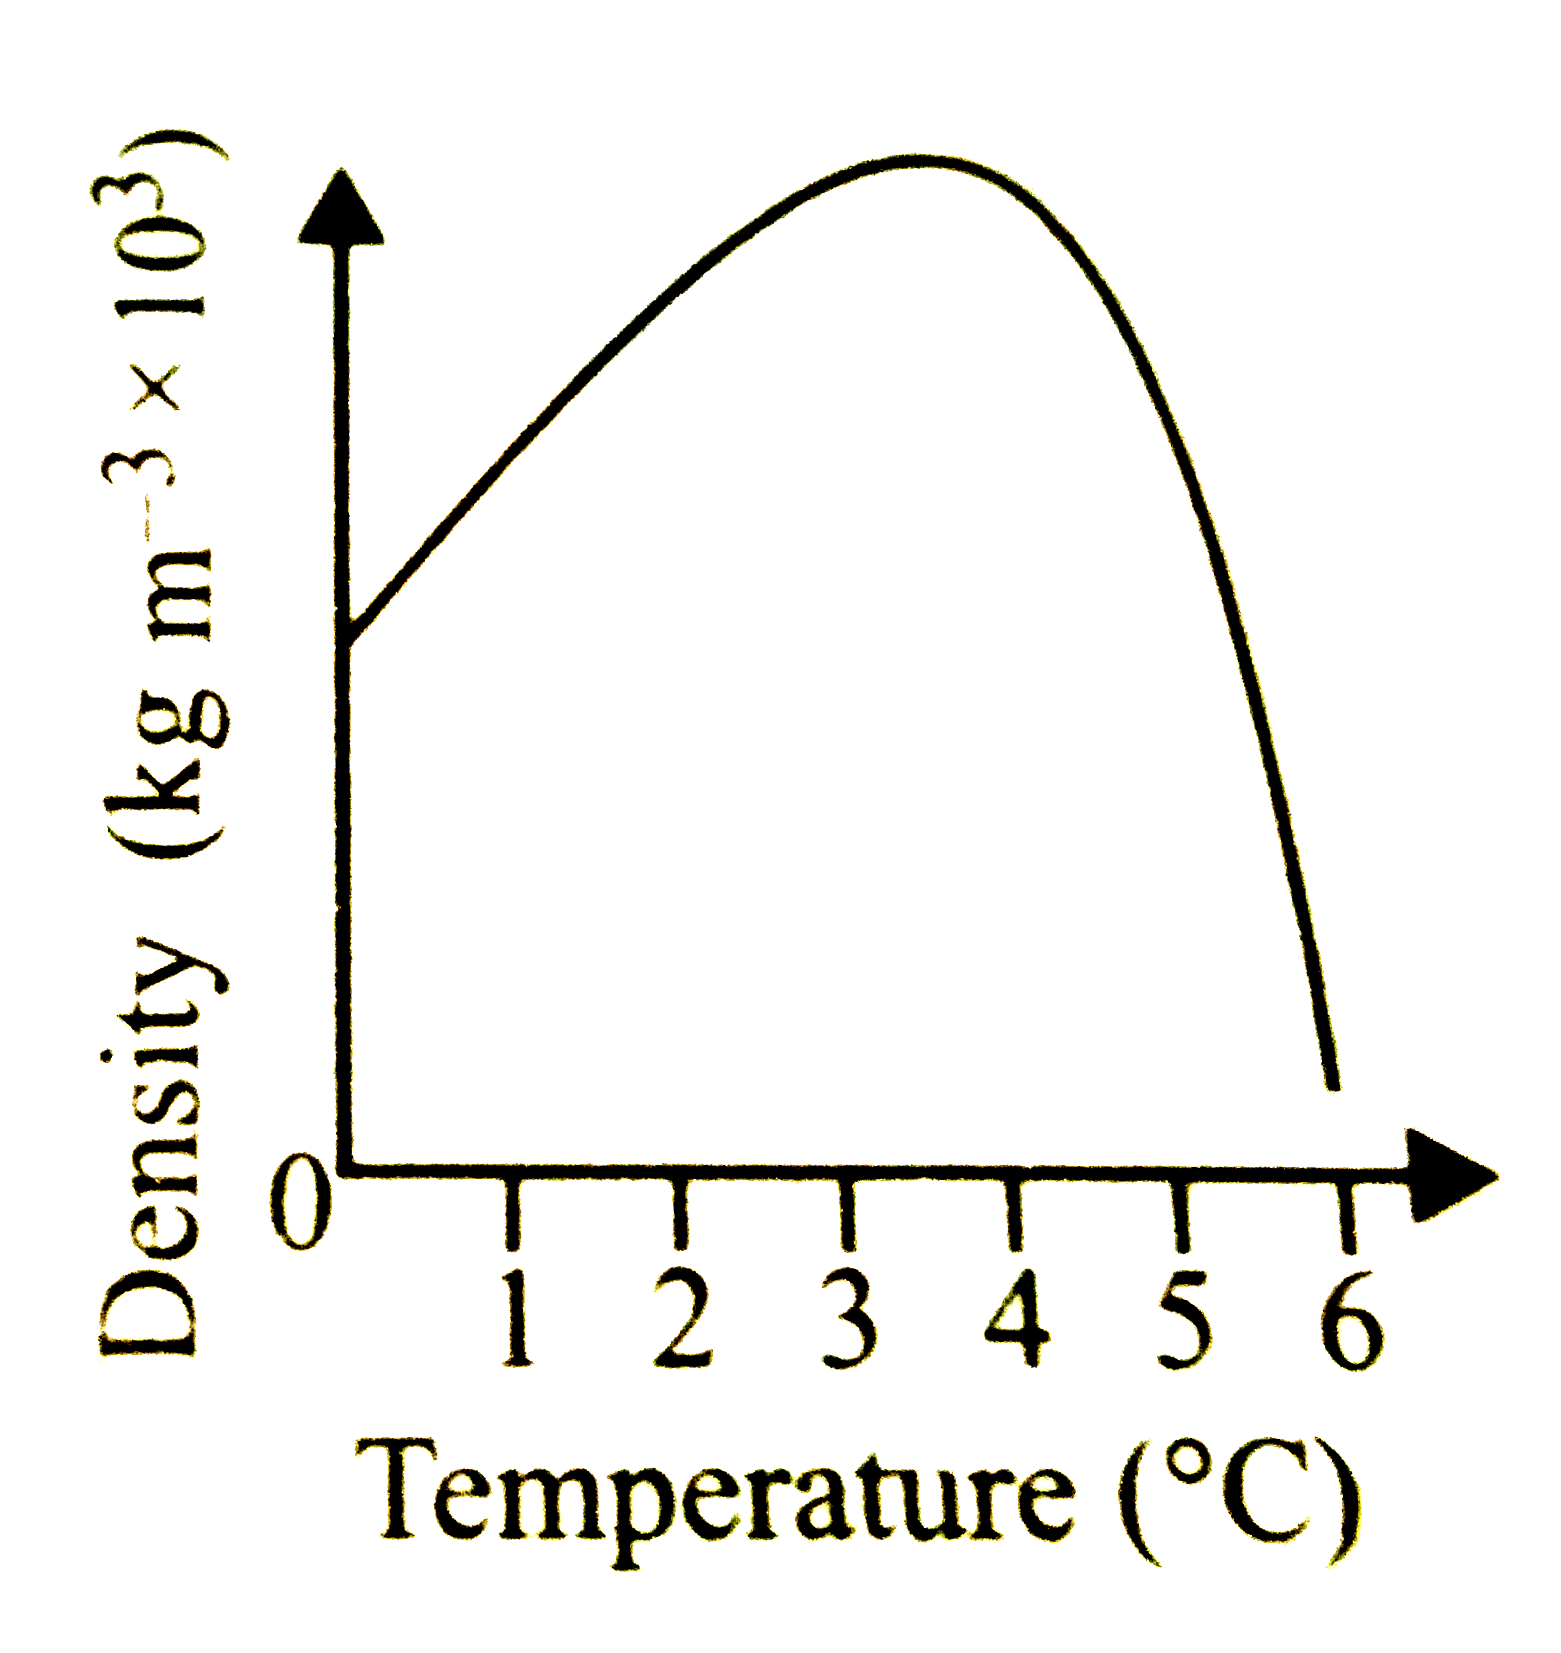 B
B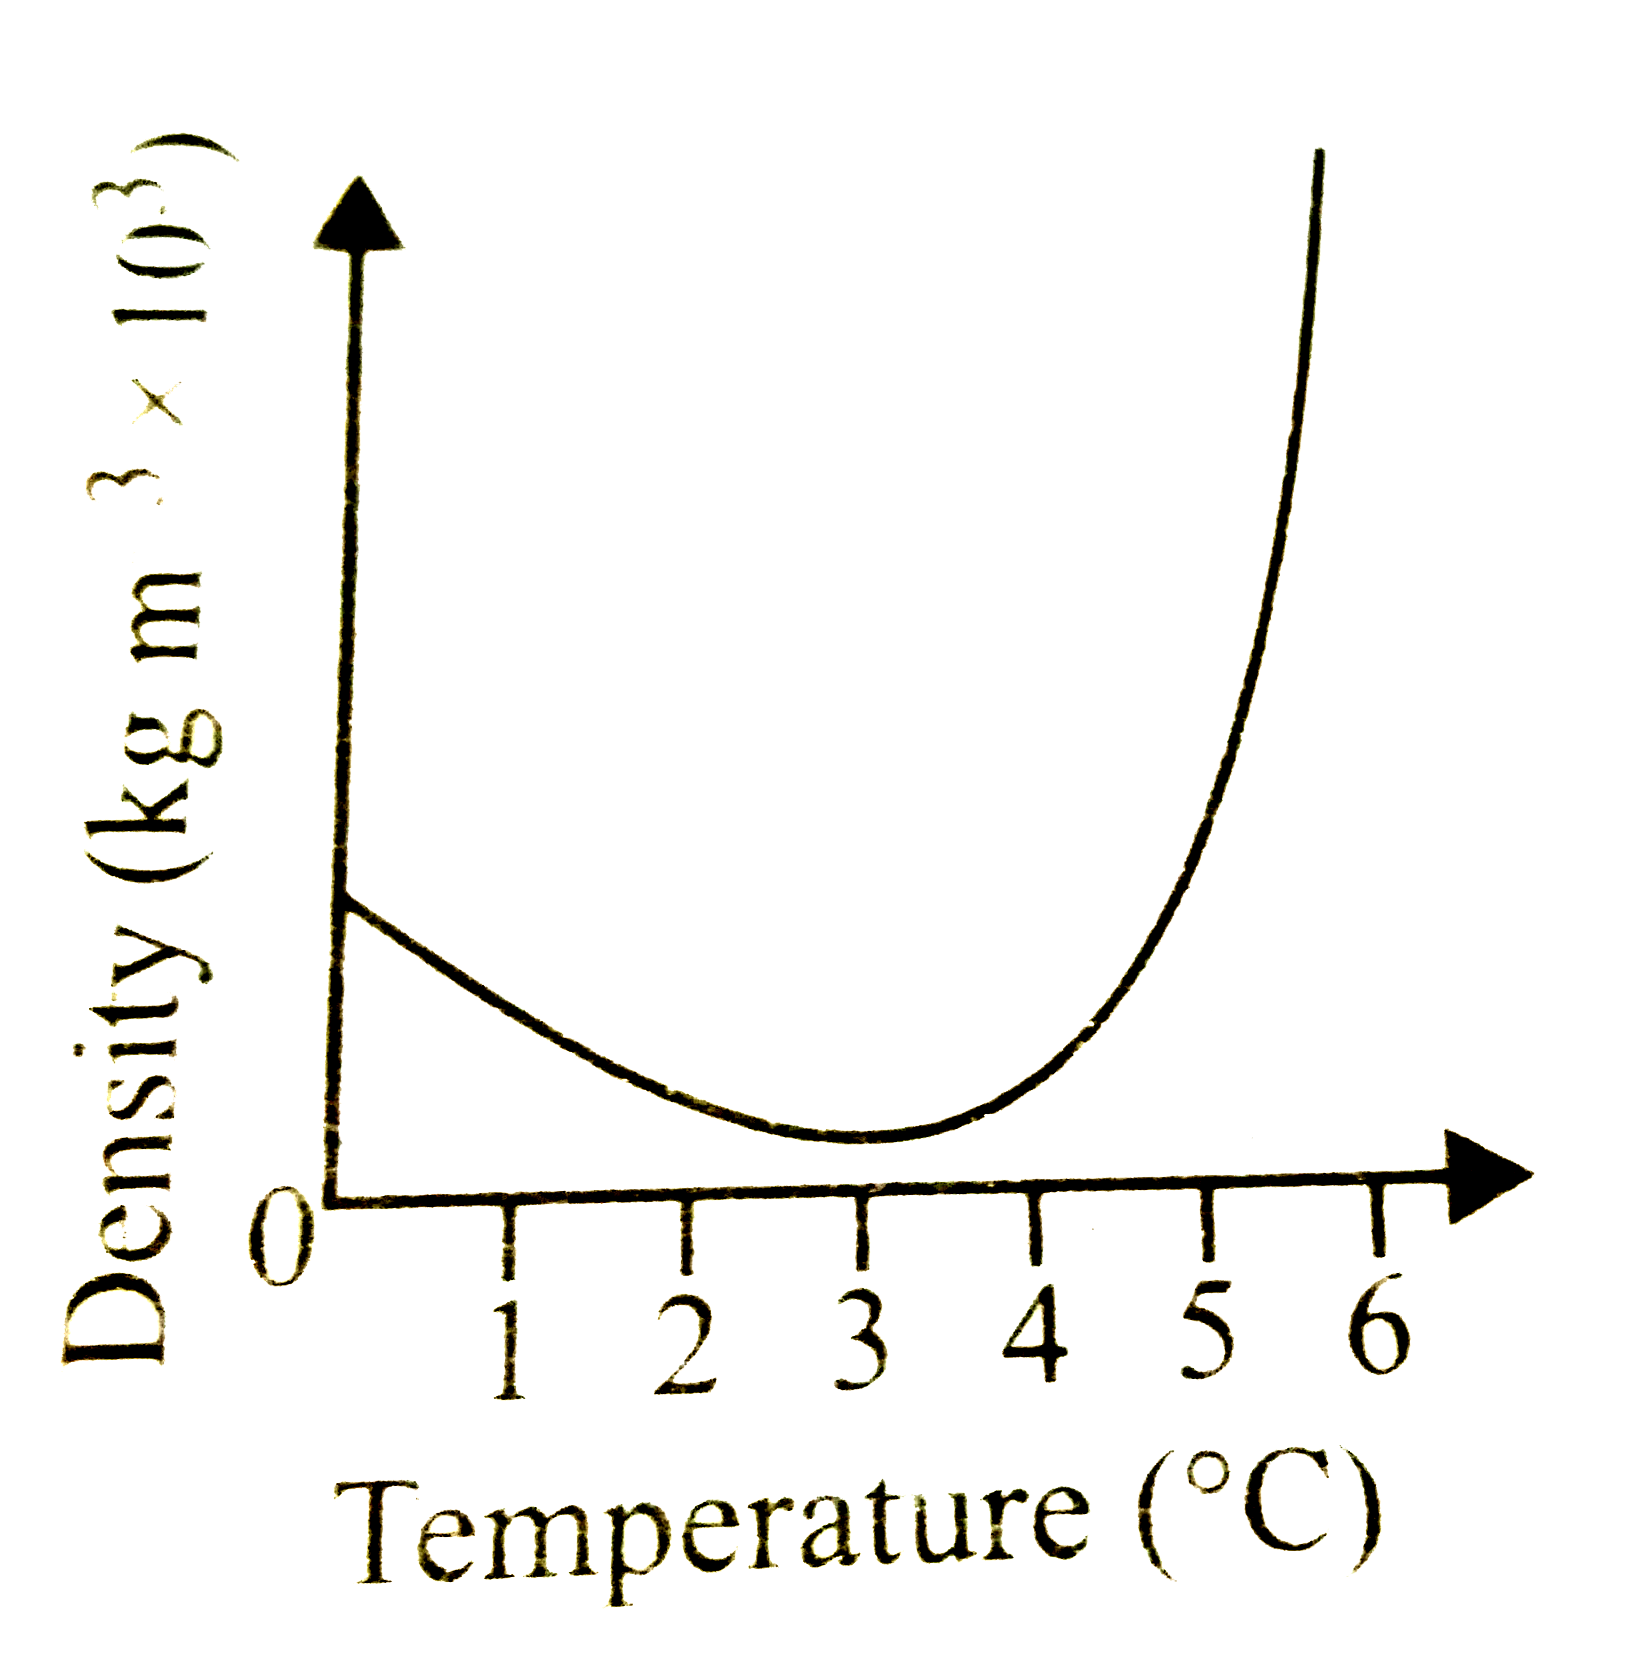 C
C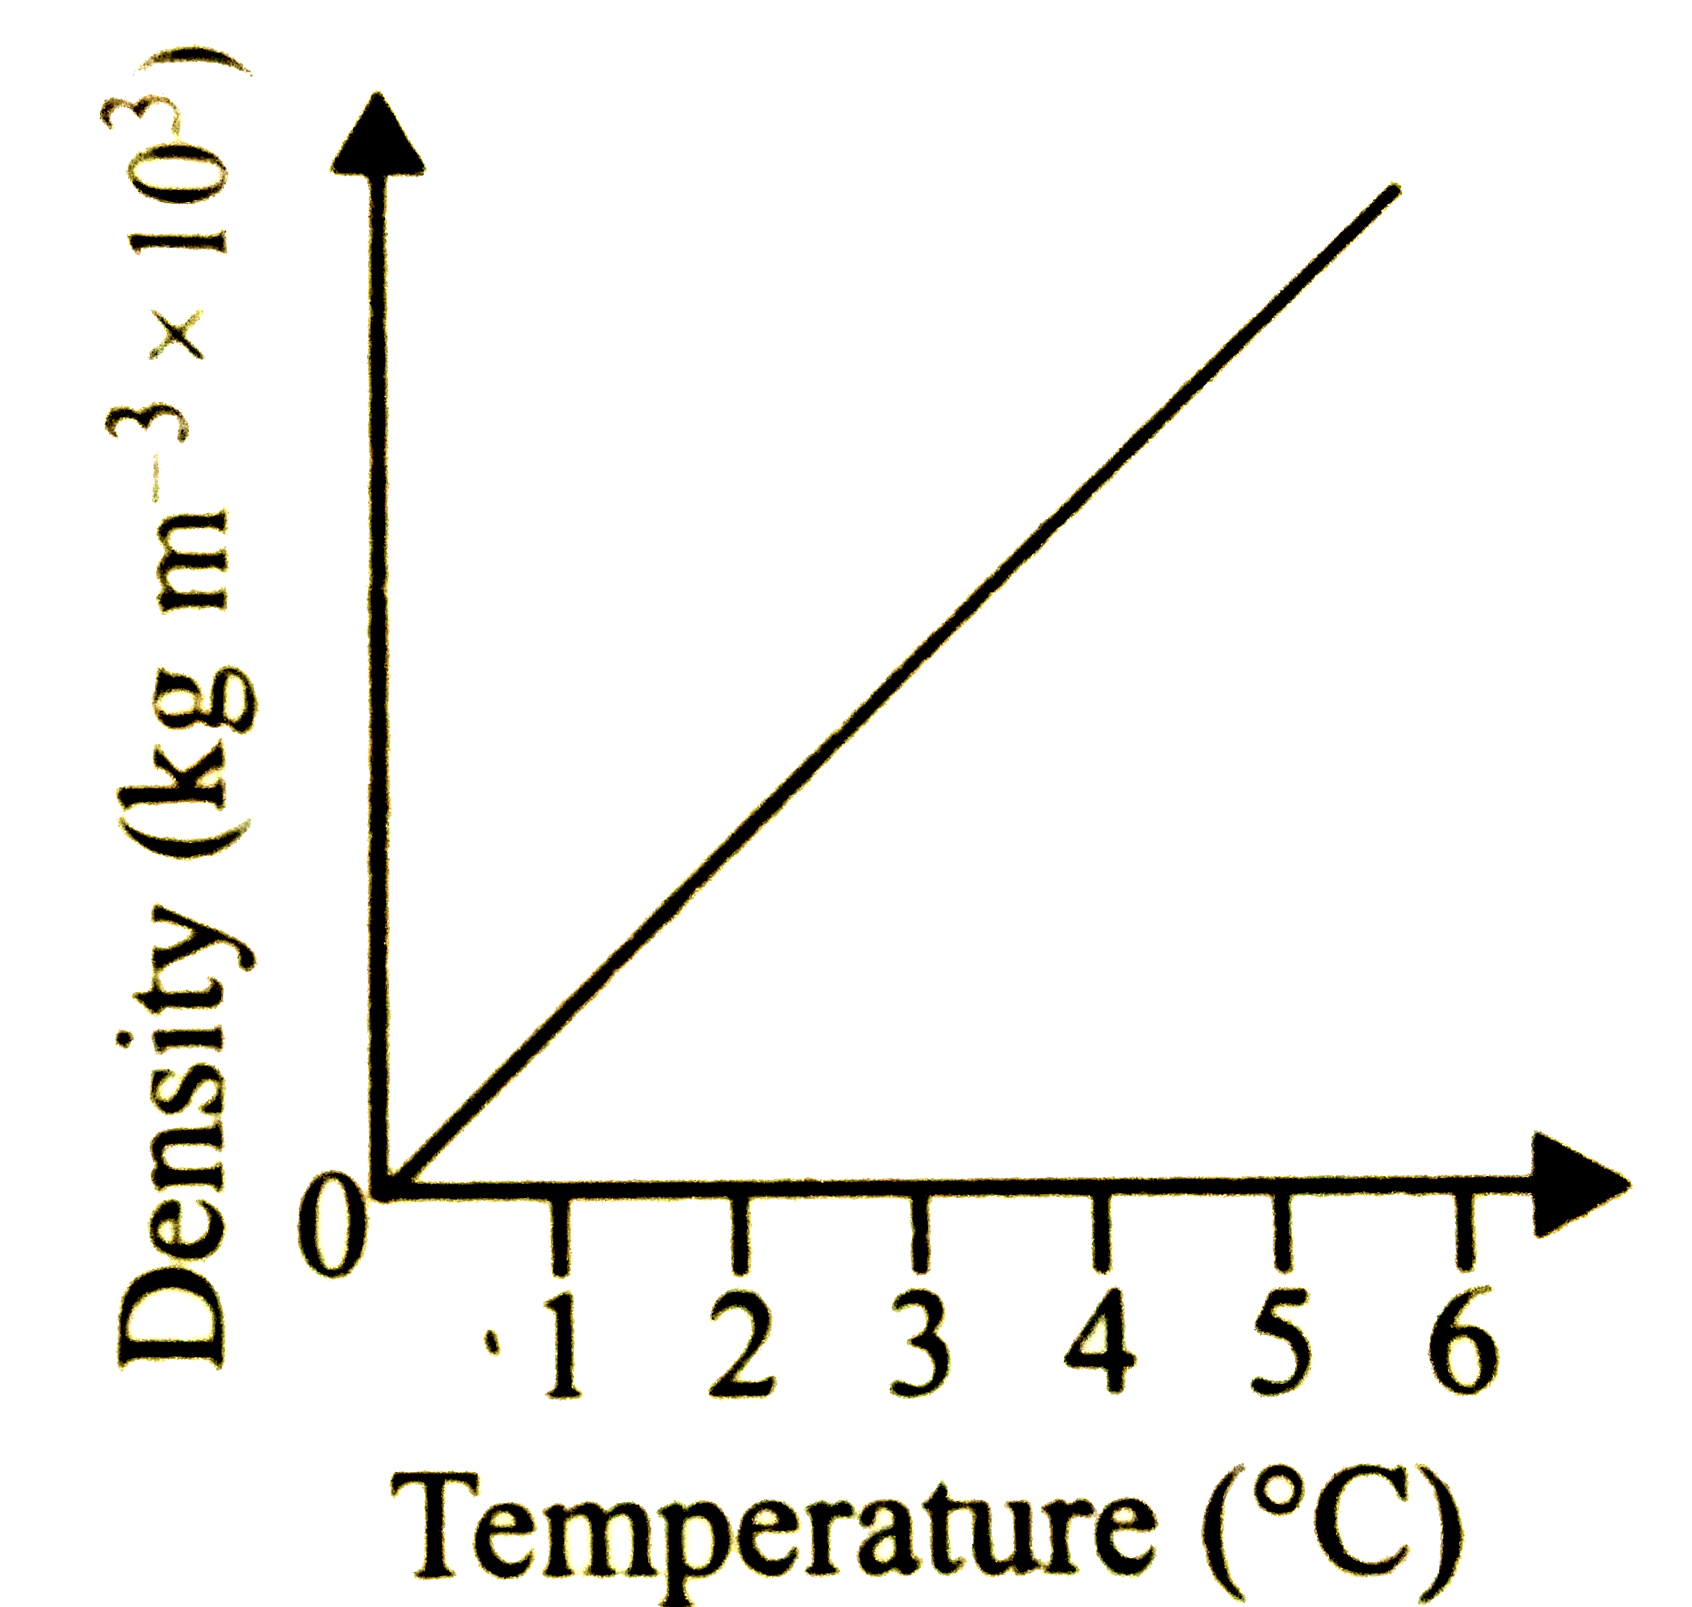 D
D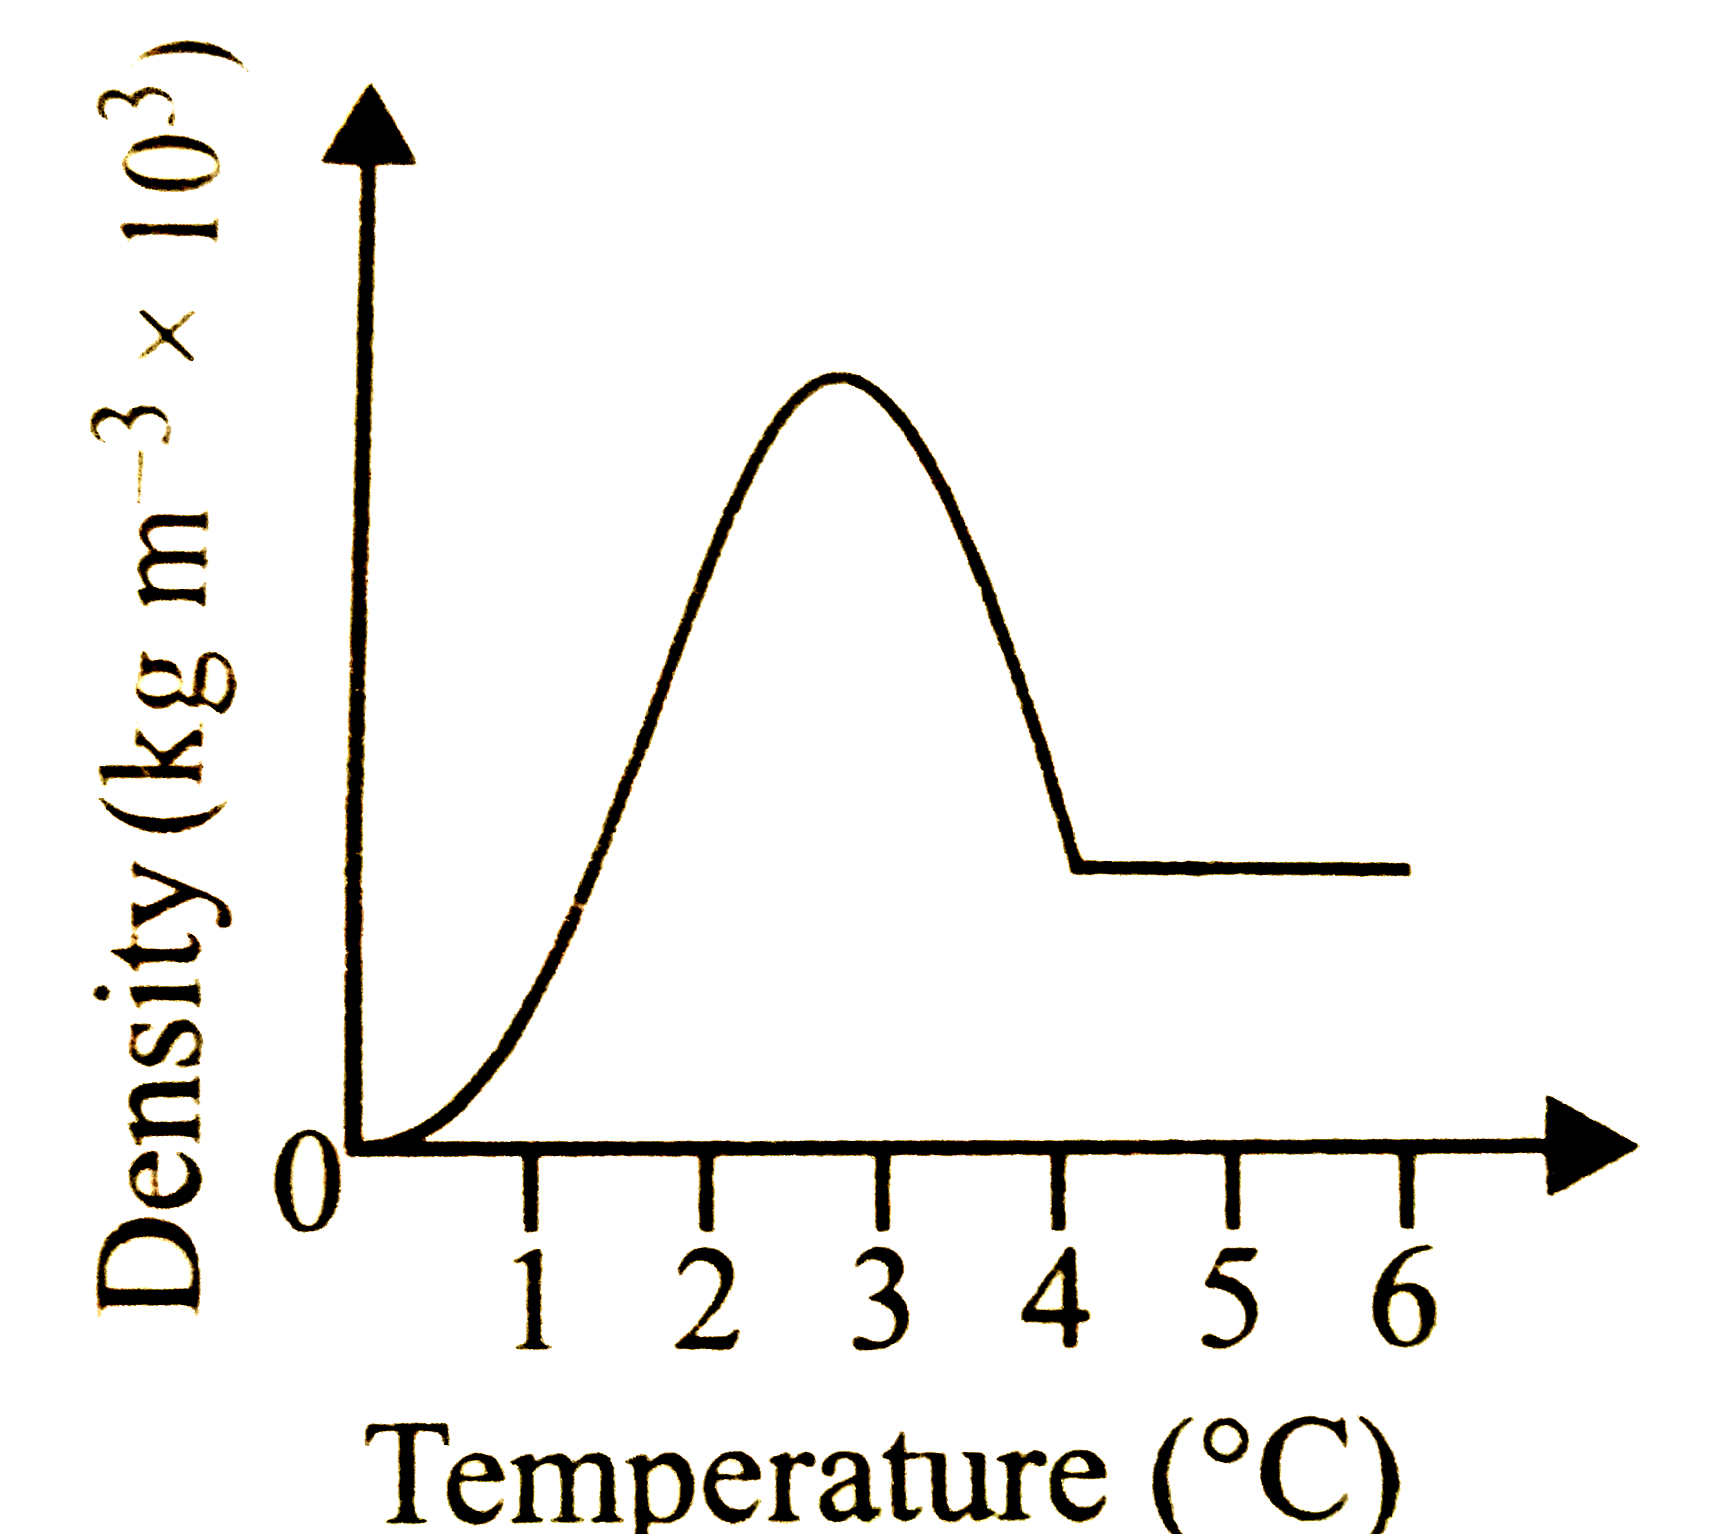
Which one of the following graphs represents variation of specific heat capacity of water with temperature?
A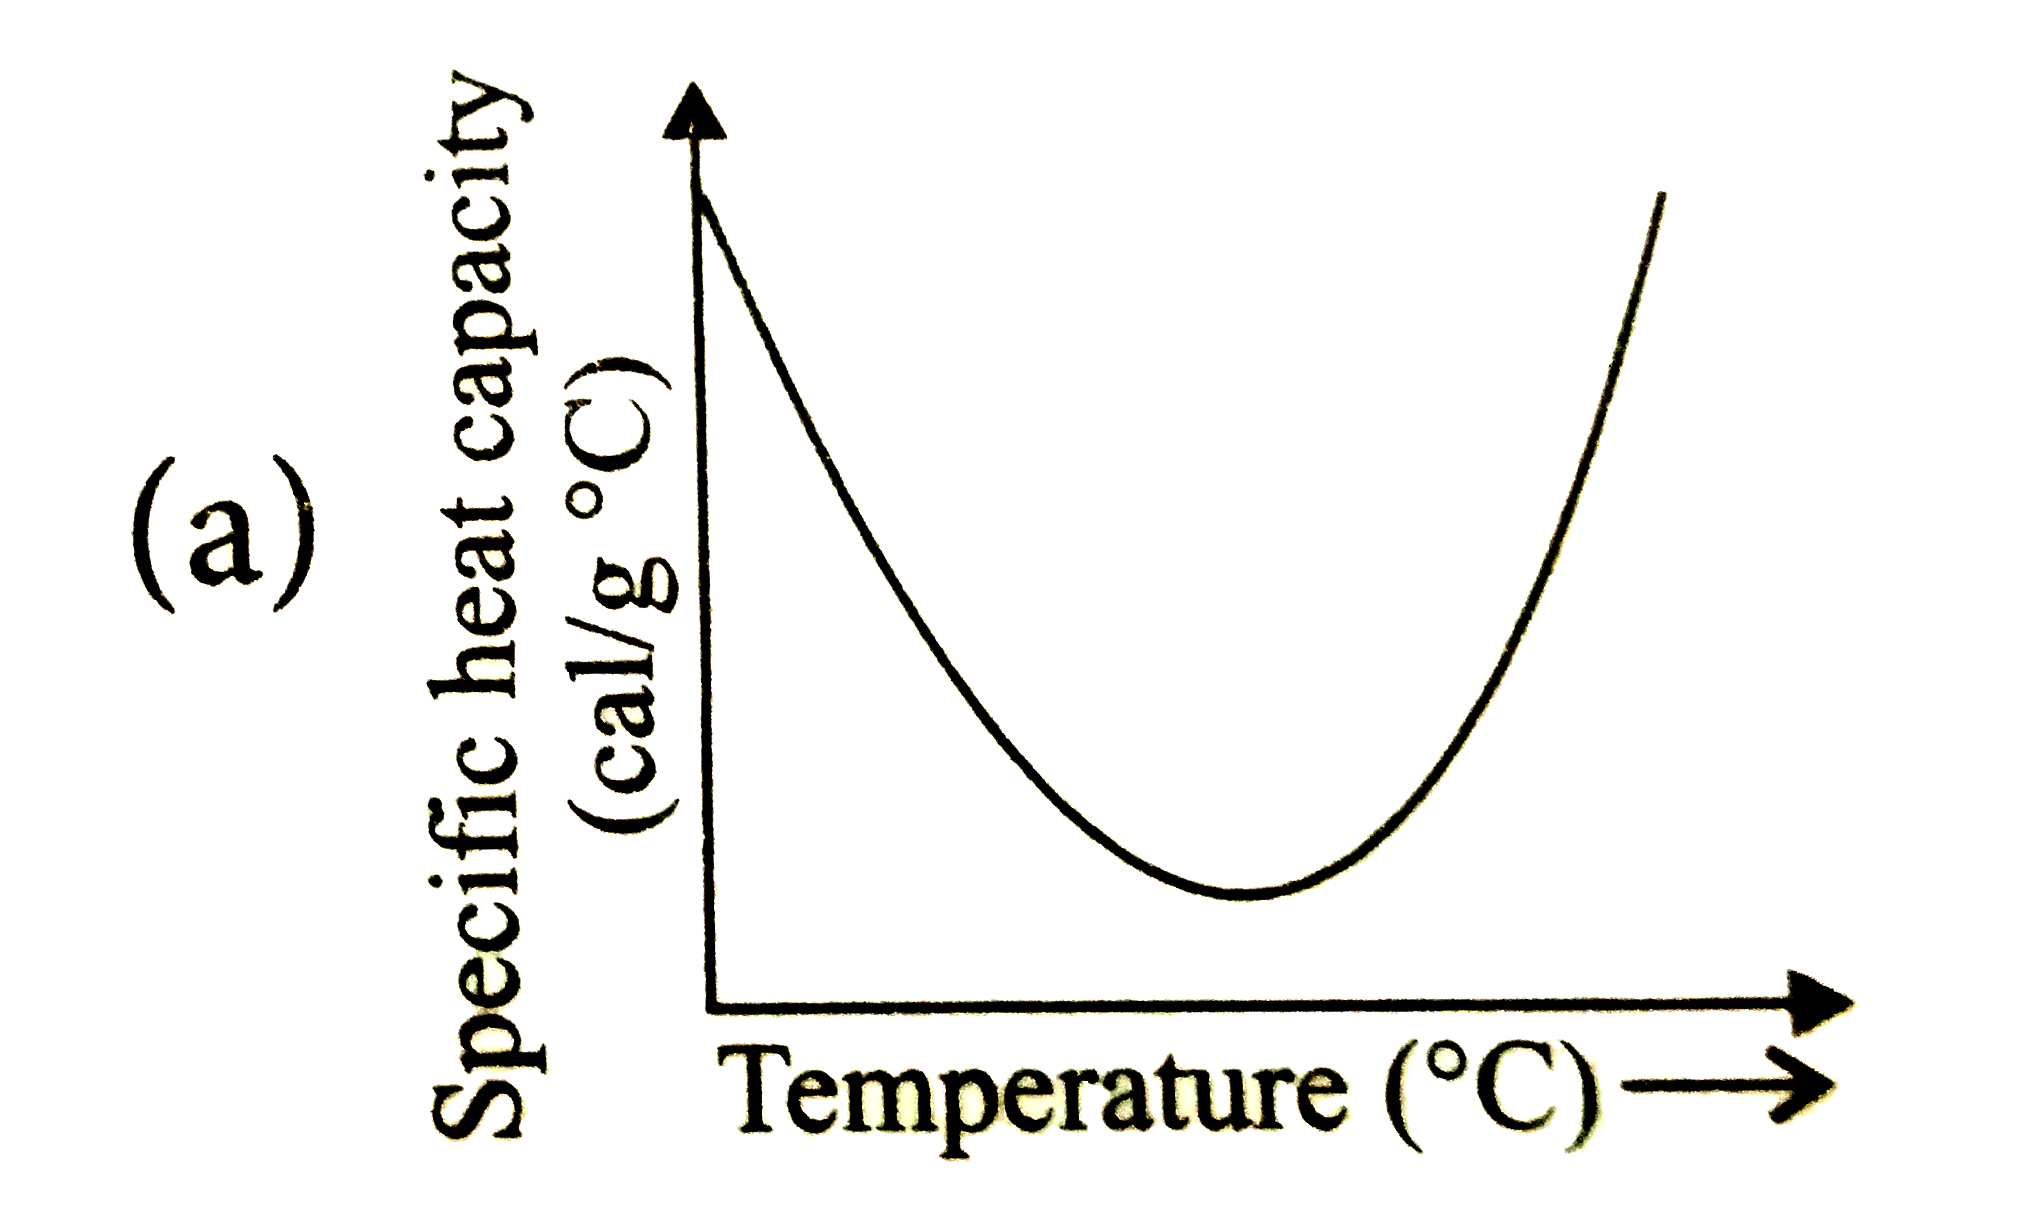 B
B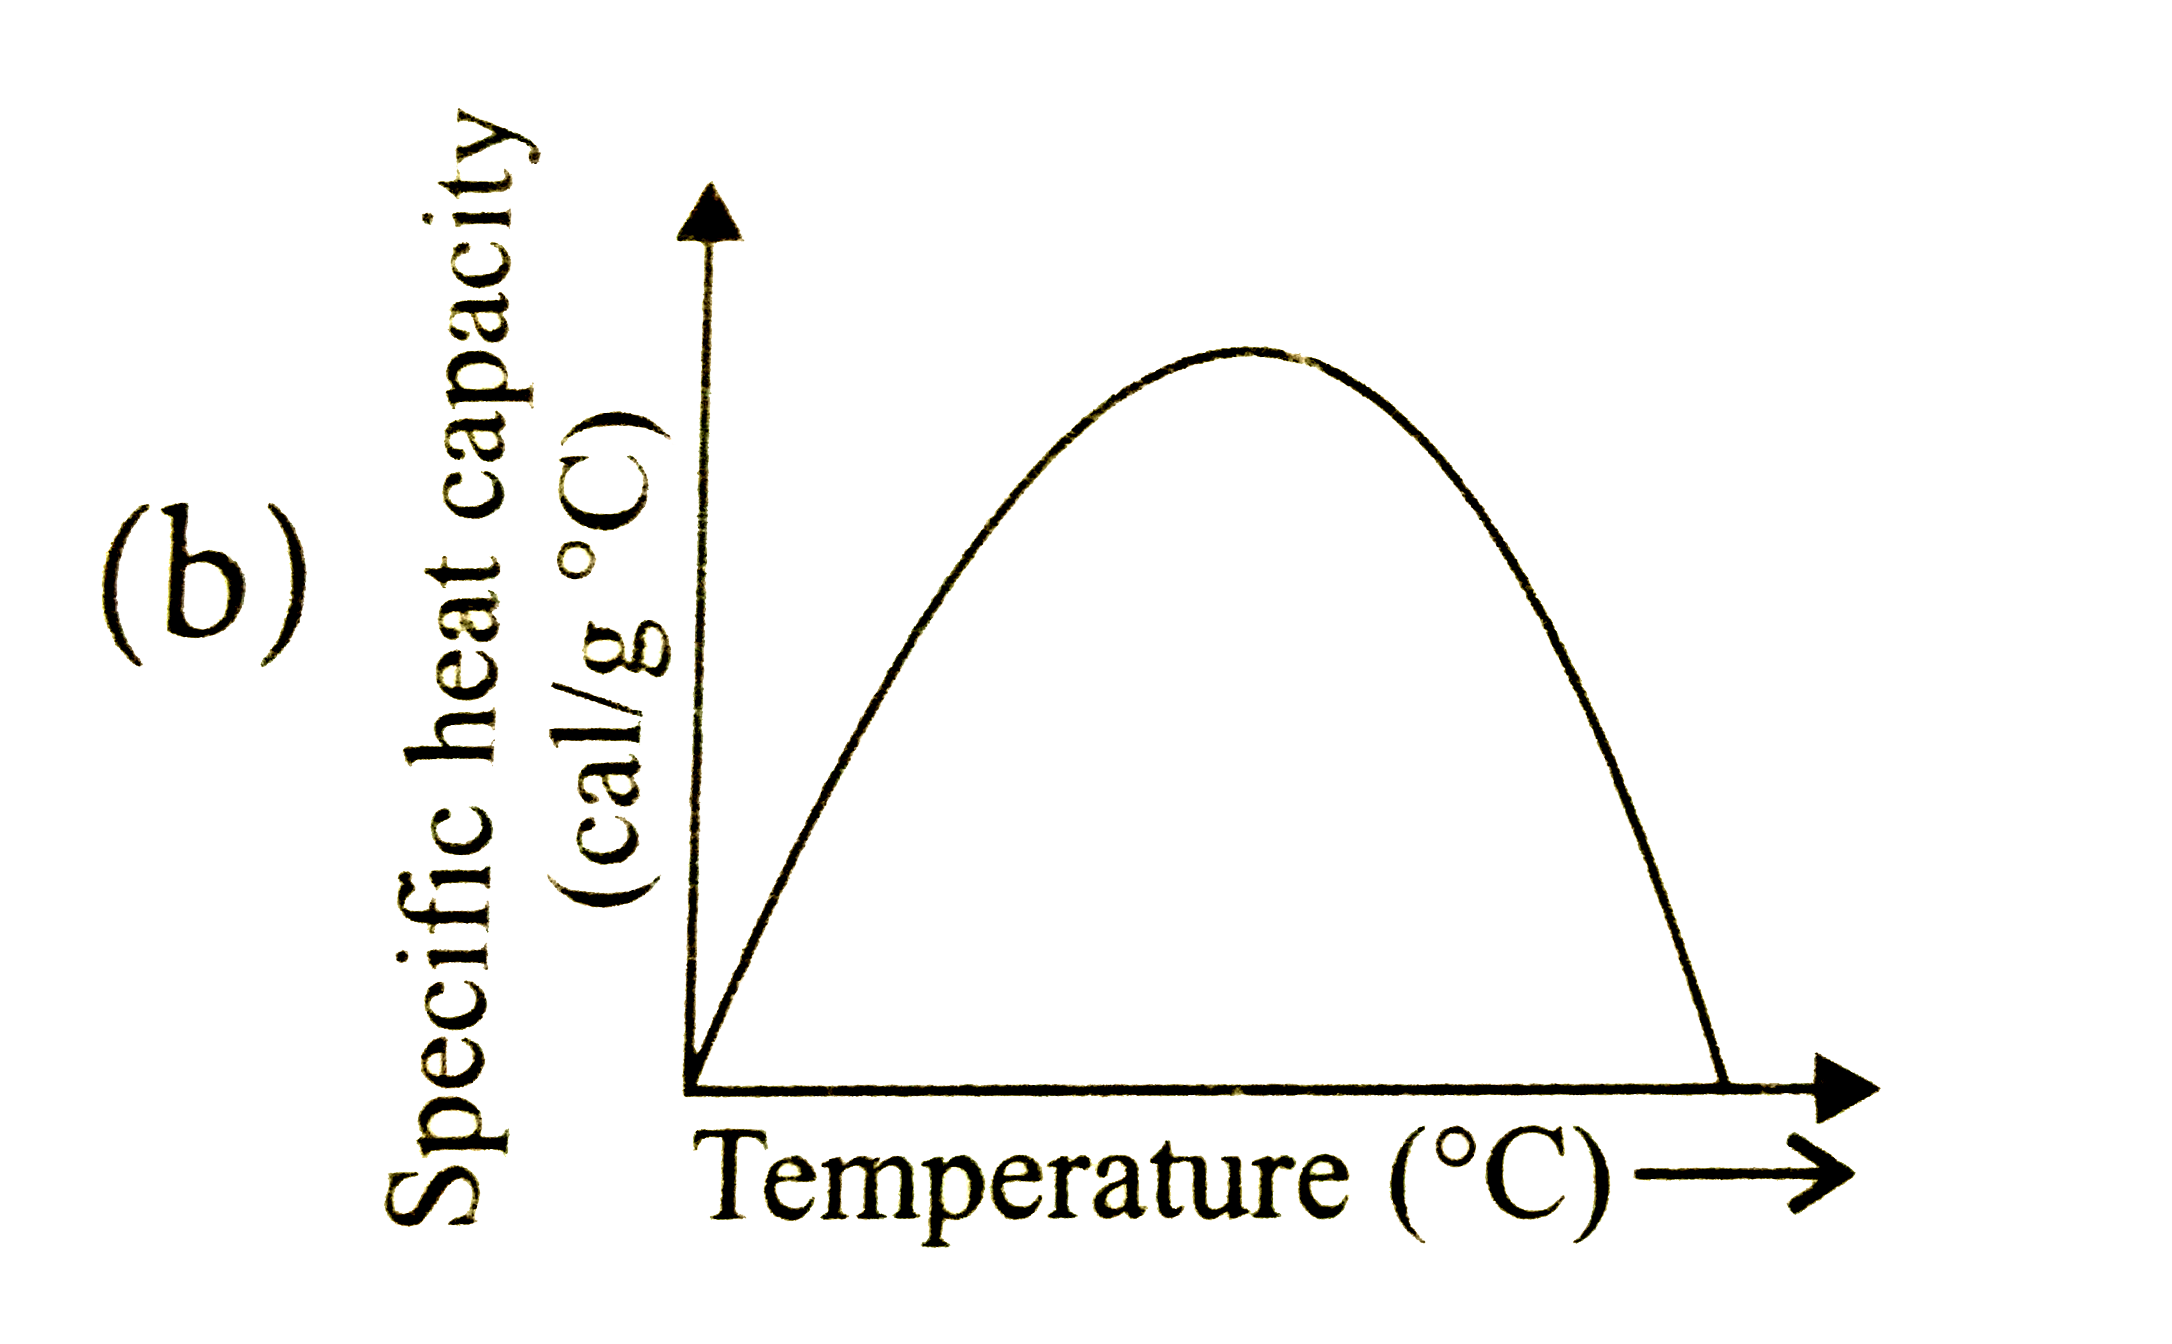 C
C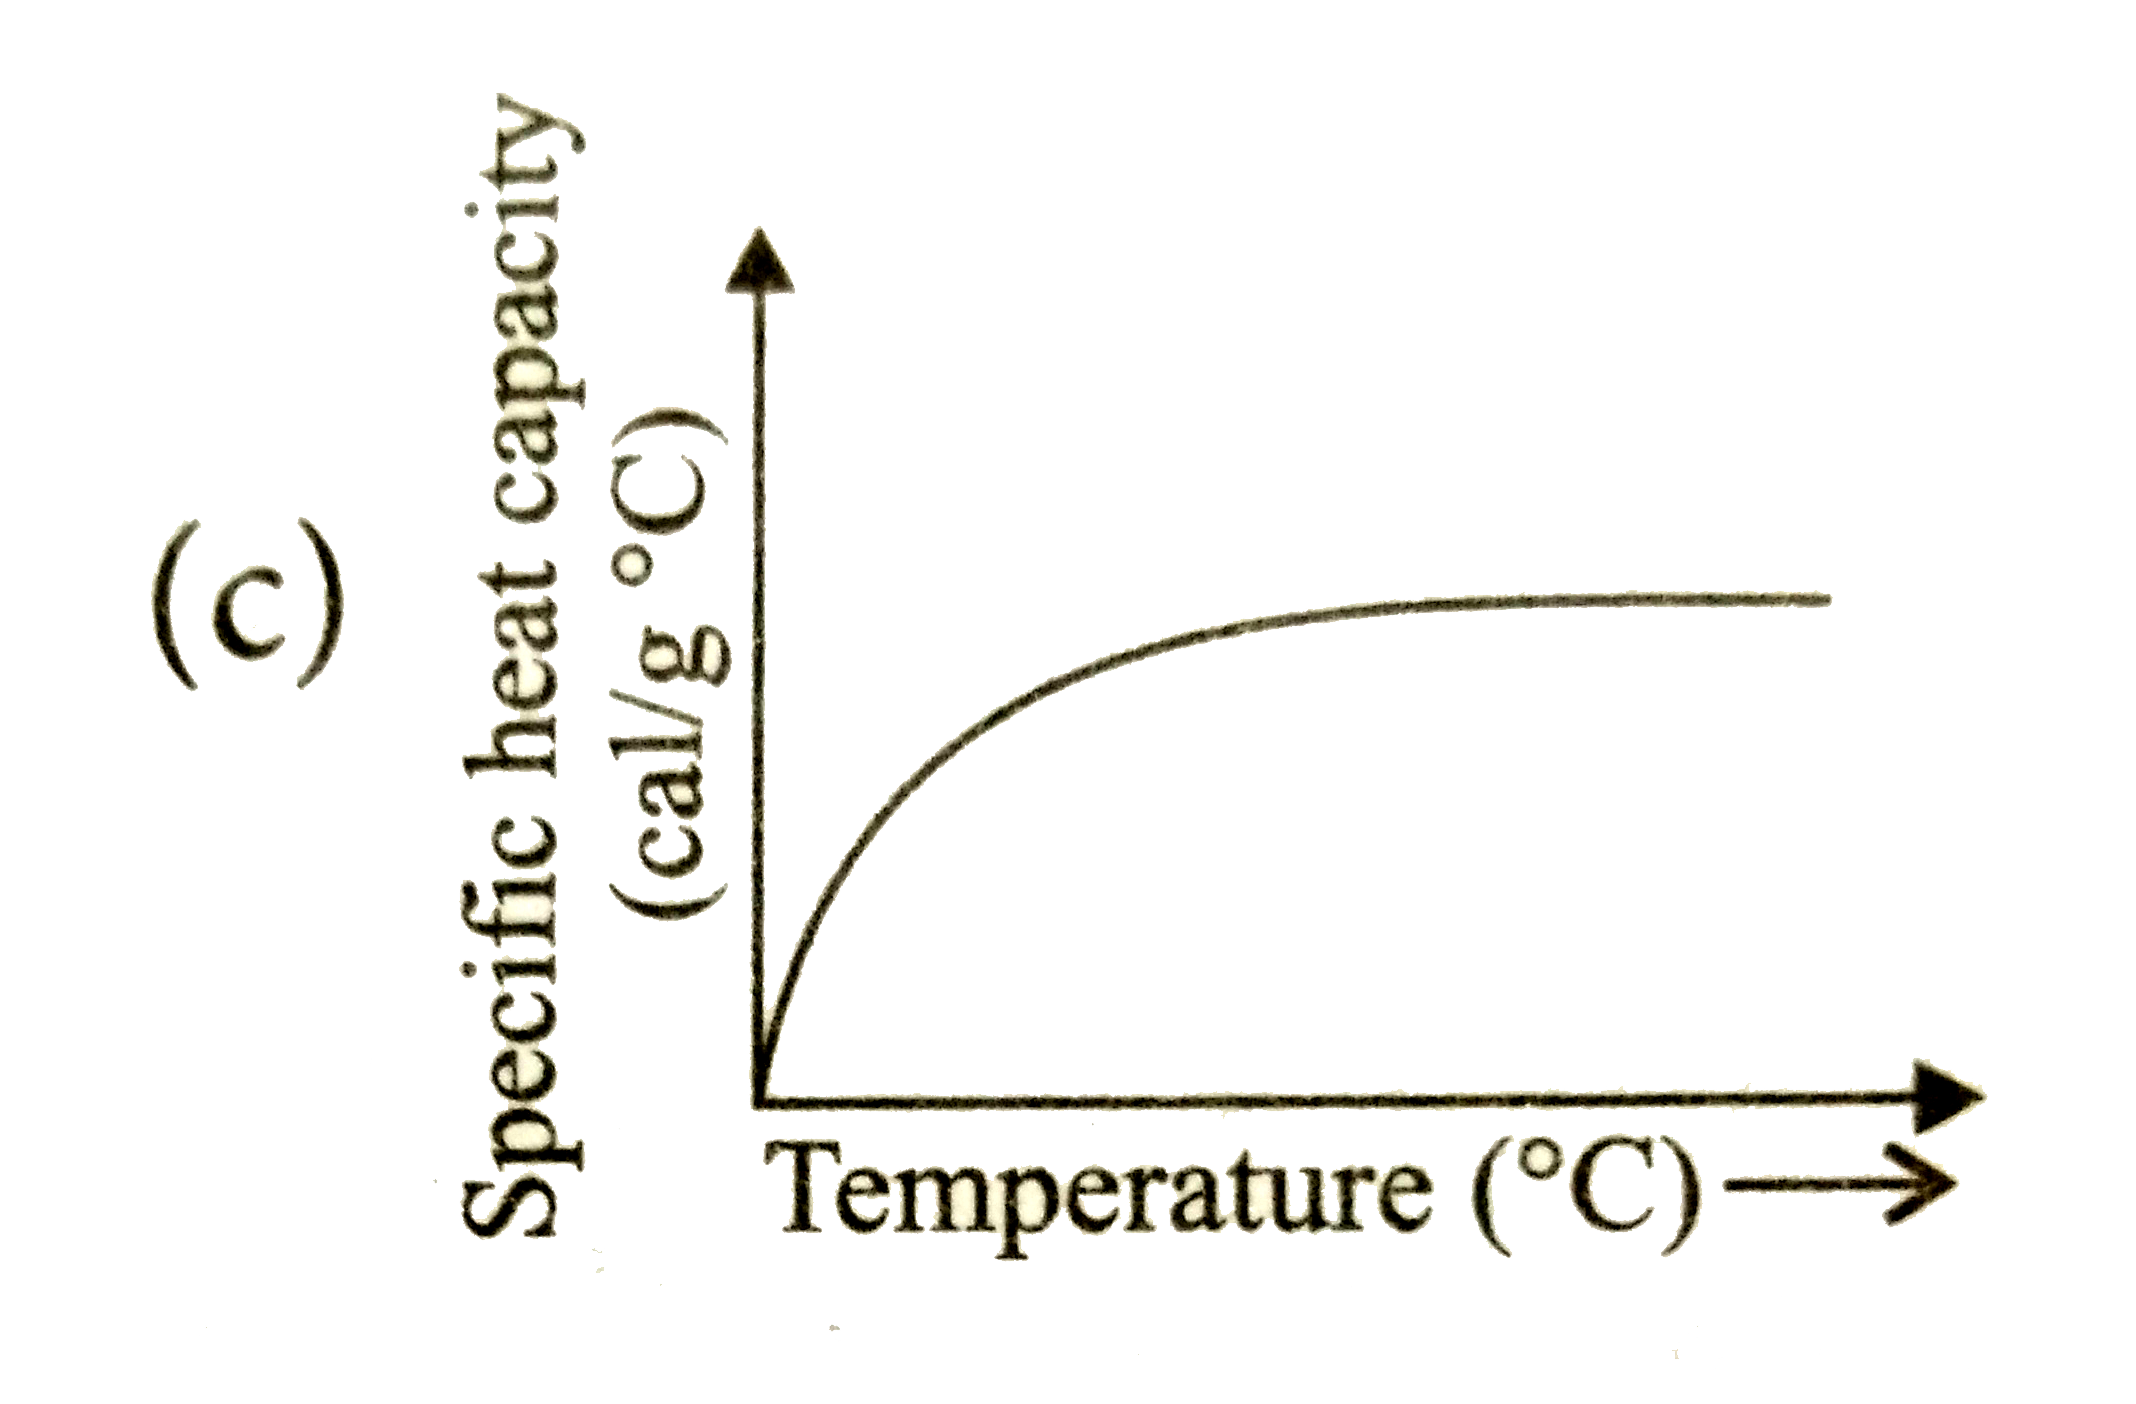 D
D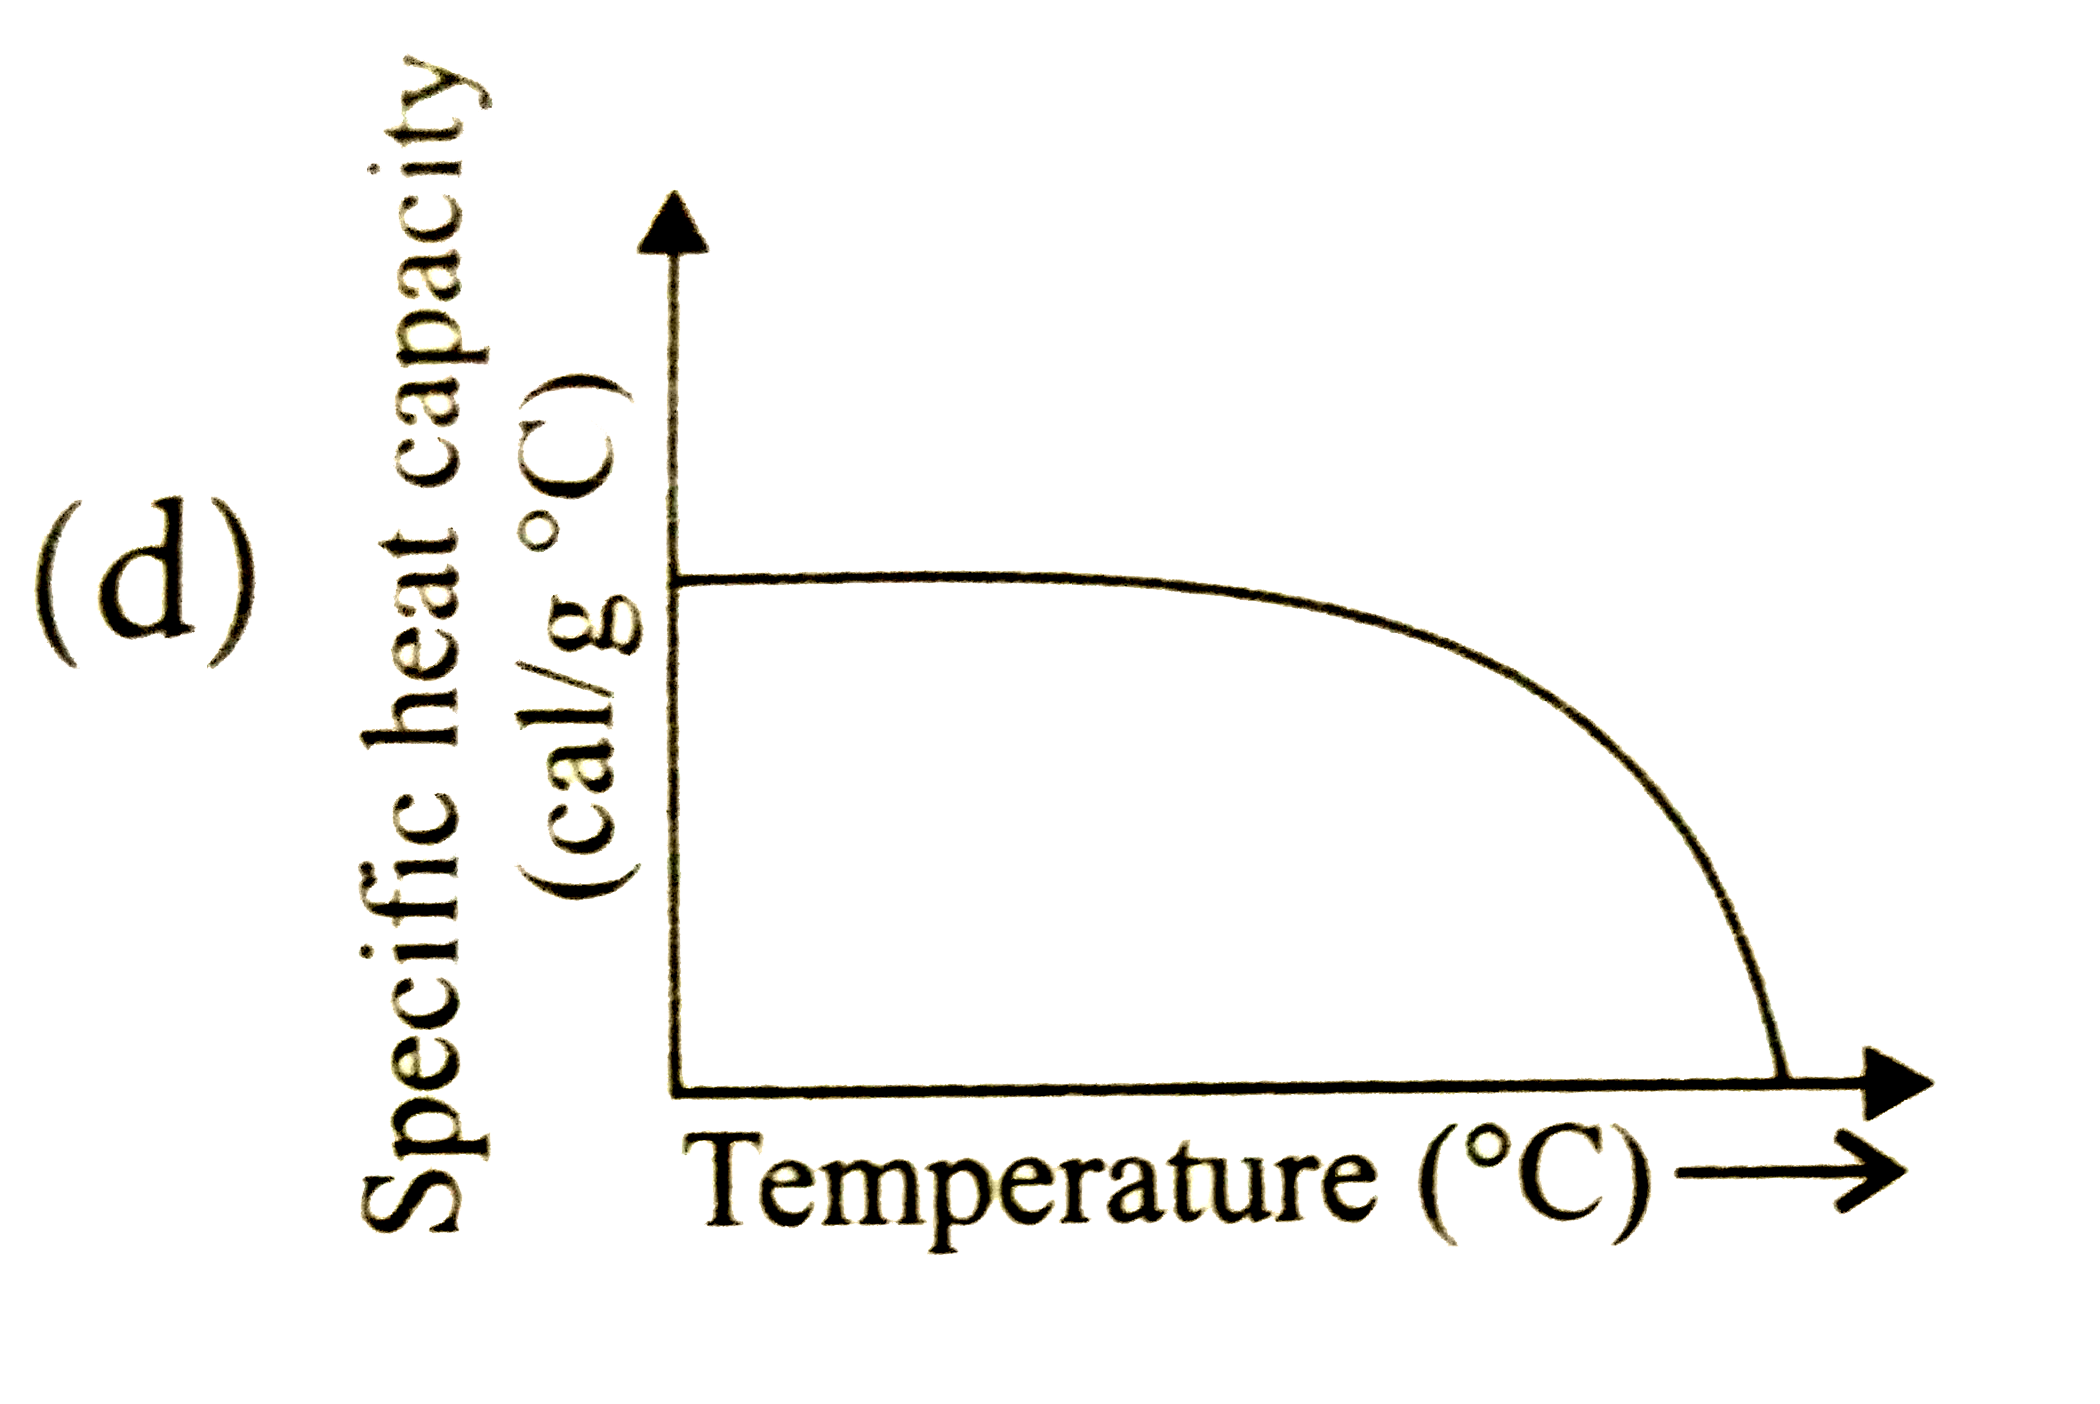
Which of the following curves represent(s) Boyle's law?
View SolutionWhich of the following represents the heavy water?
View SolutionWhich of the following represents logistic growth curve?
View SolutionWhich of the following curve represents the variation of λM with √C for AgNO3?
View SolutionA point source of light is used in an experiment on photoelectric effect . Which of the following curves best represents the variation of photo current (i) with distance (d) of the source from the emitter ?

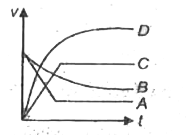
View SolutionA ball is thrown downward with some velocity into a.viscous liquid. Which of the following curves represents correct variation for velocity versus time?
View Solution
