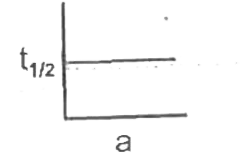
The graph of t1/2 versus initial concentration 'a' is for

(a) First order
(b) Second order
(c) Zero order
(d) Can't predict
The correct Answer is:A
Step by step video & image solution for The graph of t_(1//2) versus initial concentration 'a' is for by Chemistry experts to help you in doubts & scoring excellent marks in Class 12 exams.
Updated on:21/07/2023Topper's Solved these Questions
- CHEMICAL KINETICSBOOK - AAKASH INSTITUTE ENGLISHCHAPTER - CHEMICAL KINETICSEXERCISE - ASSIGNMENT (SECTION B : Objective Type Questions)
20 Videos
- CHEMICAL KINETICSBOOK - AAKASH INSTITUTE ENGLISHCHAPTER - CHEMICAL KINETICSEXERCISE - ASSIGNMENT (SECTION C : Previous Year Questions)
62 Videos
- CHEMICAL KINETICSBOOK - AAKASH INSTITUTE ENGLISHCHAPTER - CHEMICAL KINETICSEXERCISE - EXERCISE
30 Videos
- CHEMICAL BONDING AND MOLECULAR STRUCTURE BOOK - AAKASH INSTITUTE ENGLISHCHAPTER - CHEMICAL BONDING AND MOLECULAR STRUCTURE EXERCISE - Assignment Section J (Aakash Challengers Questions)
10 Videos
- CHEMISTRY IN EVERYDAY LIFE BOOK - AAKASH INSTITUTE ENGLISHCHAPTER - CHEMISTRY IN EVERYDAY LIFE EXERCISE - Assignment ( SECTION - A)
45 Videos
Similar Questions
From different sets of data of t1/2 at diifferent initial concentrations say 'a' for a given reaction, the [t1/2×qa] is found to be constant. The order or reaction is :
View SolutionFor the reactionA→B, for which graph between half life (t1/2)and∈itialconcentration(a)oftherectantisgivenbelow<br><imga≤ocr_imageload∈g=lazysrc=https://d10lpgp6xz60nq.cloudfront.net/physics_images/NRA_PHY_CHM_JMA_C07_E01_022_Q01.pngwh=80%mx-autosty≤=background:white;><br>Hencegraphbetween-(d[A])/(dt) and time will be:
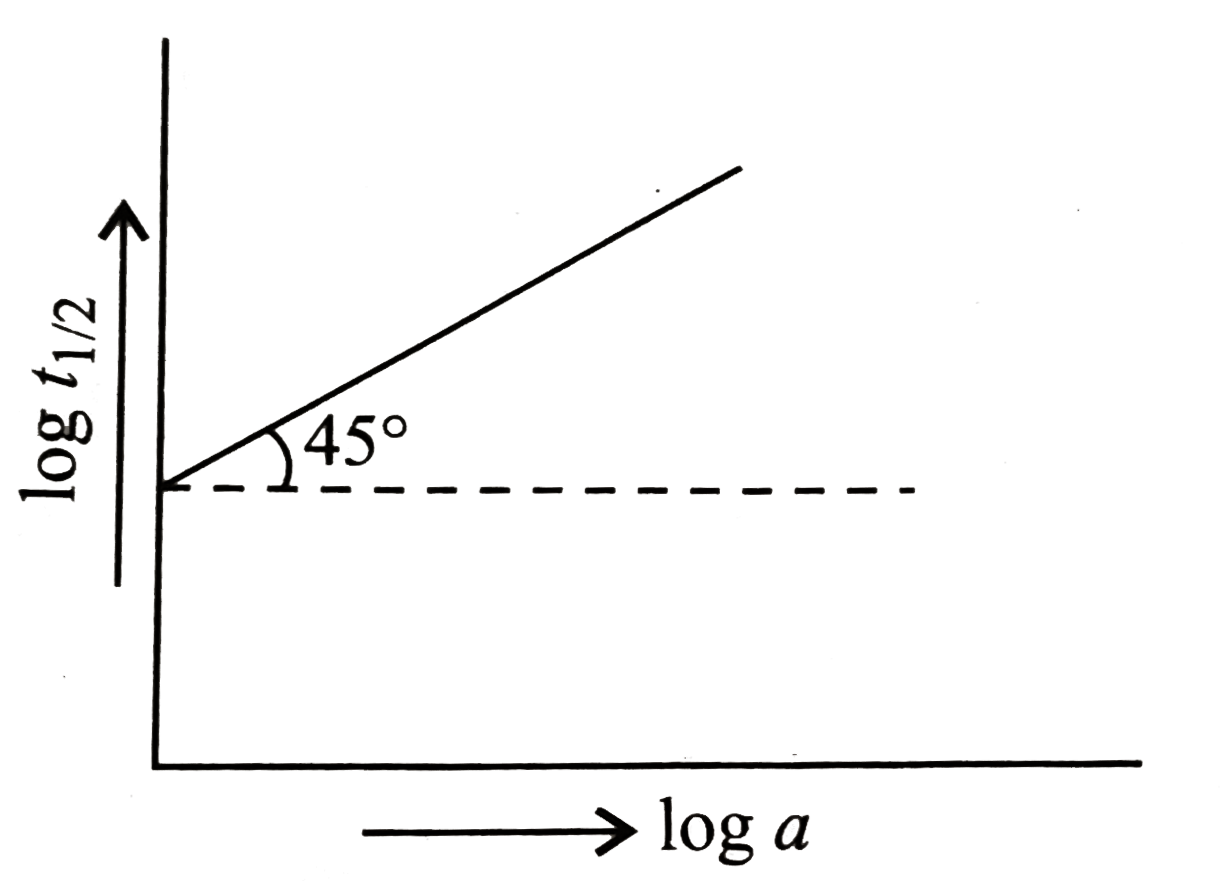
View SolutionFollowing is the graph between logt1/2 and loga (a initial concentration) for a given reaction at 300K

Find the order of reaction.
View SolutionFor zero order reaction , t1/2 will be (A0 is the initial concentration , K is rate constant)
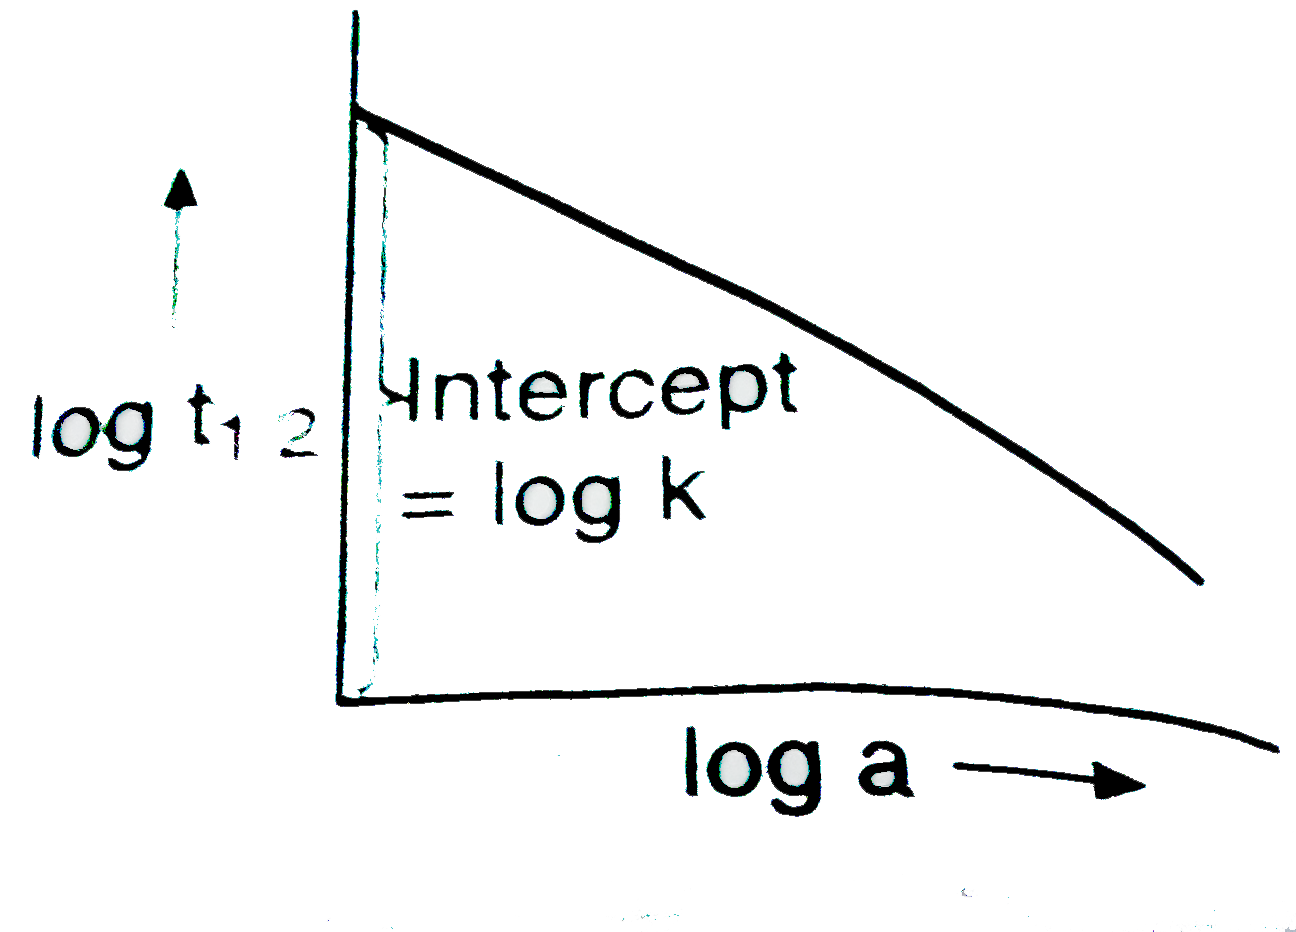
View SolutionFor a second order reaction, 2A→ Products, a plot of log t1/2 vs log a (where a is initial concentration) will give an intercept equal to which one of the following?

View SolutionA graph plotted between logt12 vs log concentration is a straight line. What is your conclusion?
[Given : n = order of reaction]
View SolutionFollowing is the graph between logT50 and loga (a= initial concentration) for a given reaction at 27∘C. Hence order is

View SolutionFor a reaction X→Y, the graph of the product concentration (x) versus time (t) came out to be a straight line passing through the
origin. Hence and time would be the graph of d[X]dt and the time
would be
View SolutionThe half-life period and initial concentration for a reaction are as follows. What is order of reaction ?
∣∣∣Initial concentration (M)350540158t1/2(hr)425275941∣∣∣
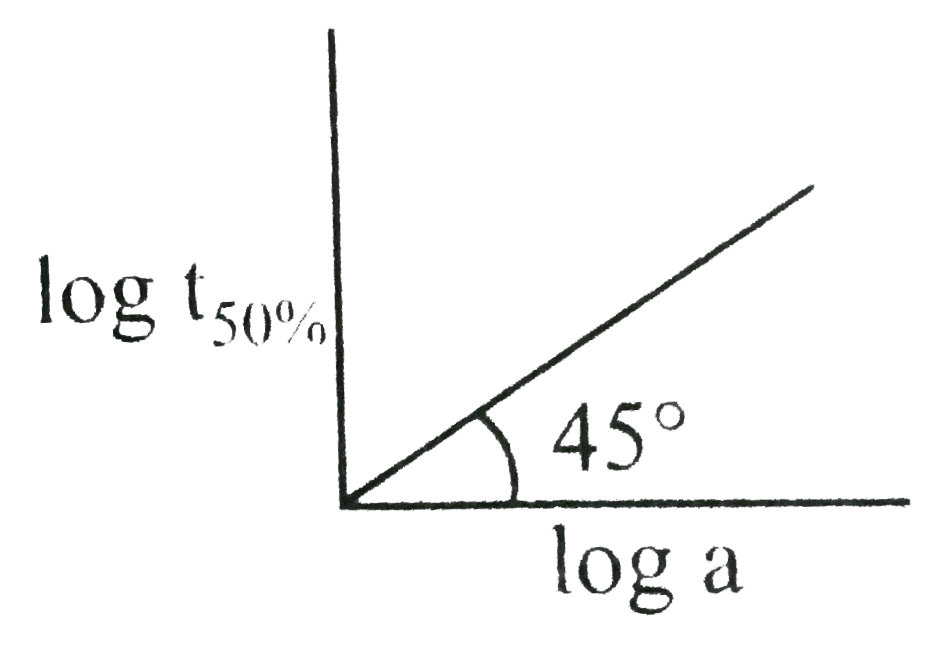
View SolutionWhat will be the order of reaction and rate constant for a chemical change having logt50% versue log concentration of (a) curves as:

View Solution
