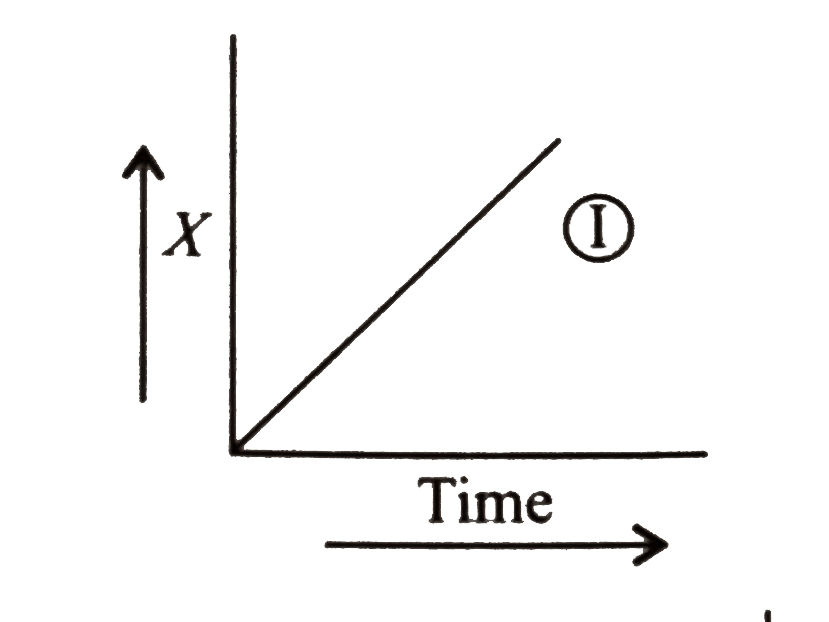
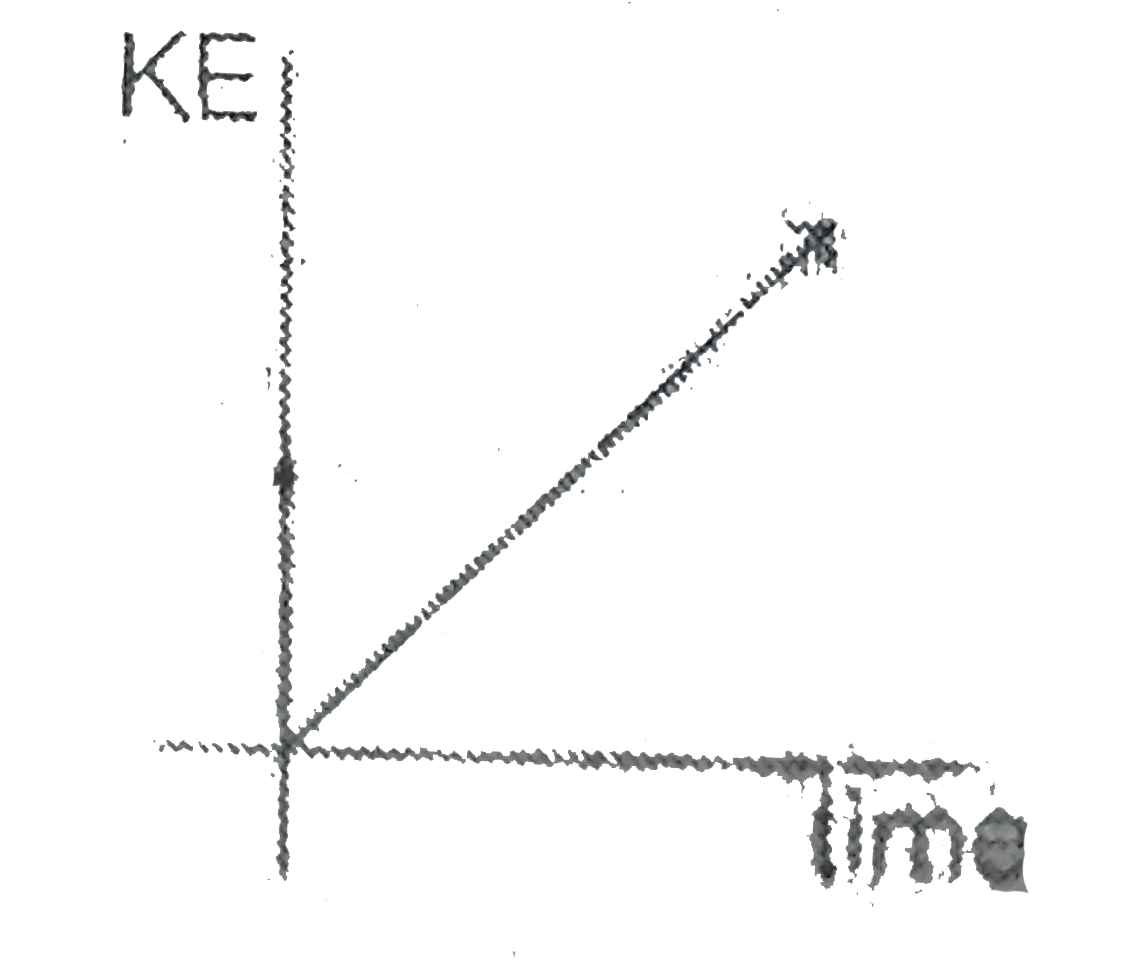
For a reaction , the graph of the product concentration (x) versus time (t) came out to be a straight line passing through the
origin. Hence and time would be the graph of and the time
would be
straight line with a negative slope and an intercept on y-axis
straight linc with a positive slope and an intercept on y-axis
a straight line parallel to x-axis
a hyperbola.
The correct Answer is:C
To solve the problem, we need to analyze the information given about the reaction X→Y and the corresponding graphs.
1. Understanding the Graph of Product Concentration vs. Time:
- We are given that the graph of product concentration (X) versus time t is a straight line passing through the origin. This indicates a linear relationship between concentration and time.
2. Identifying the Order of Reaction:
- A straight line passing through the origin in the graph of concentration vs. time suggests that the reaction follows zero-order kinetics. In zero-order reactions, the concentration of the reactant decreases linearly with time.
3. Rate of Reaction:
- For a zero-order reaction, the rate of reaction r is constant and can be expressed as:
r=−d(X)dt=k
- Here, k is the rate constant.
4. Graph of Rate of Reaction vs. Time:
- Since the rate of reaction is constant for a zero-order reaction, the graph of d(X)dt (which is the rate of change of concentration with respect to time) versus time t will be a horizontal line (straight line parallel to the x-axis).
- This means that the value of d(X)dt remains constant over time.
5. Conclusion:
- Therefore, the graph of d(X)dt versus time t for the given reaction will be a straight line parallel to the x-axis.
Final Answer:
The graph of d(X)dt versus time t will be a straight line parallel to the x-axis.
---
- We are given that the graph of product concentration (X) versus time t is a straight line passing through the origin. This indicates a linear relationship between concentration and time.
- A straight line passing through the origin in the graph of concentration vs. time suggests that the reaction follows zero-order kinetics. In zero-order reactions, the concentration of the reactant decreases linearly with time.
- For a zero-order reaction, the rate of reaction r is constant and can be expressed as:
r=−d(X)dt=k
- Here, k is the rate constant.
- Since the rate of reaction is constant for a zero-order reaction, the graph of d(X)dt (which is the rate of change of concentration with respect to time) versus time t will be a horizontal line (straight line parallel to the x-axis).
- This means that the value of d(X)dt remains constant over time.
- Therefore, the graph of d(X)dt versus time t for the given reaction will be a straight line parallel to the x-axis.
The graph of d(X)dt versus time t will be a straight line parallel to the x-axis.
Similar Questions
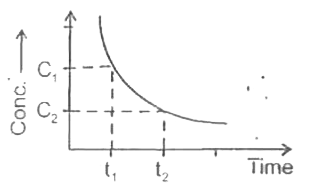
The graph plotted between concentration versus time
View SolutionThe equation to the striaght lines passing through the origin and making an angle α with straight line y+x=0 are given by
View SolutionThe acceleration versus time graph of a particle moving in a straight line is show in. The velocity-time graph of the particle would be
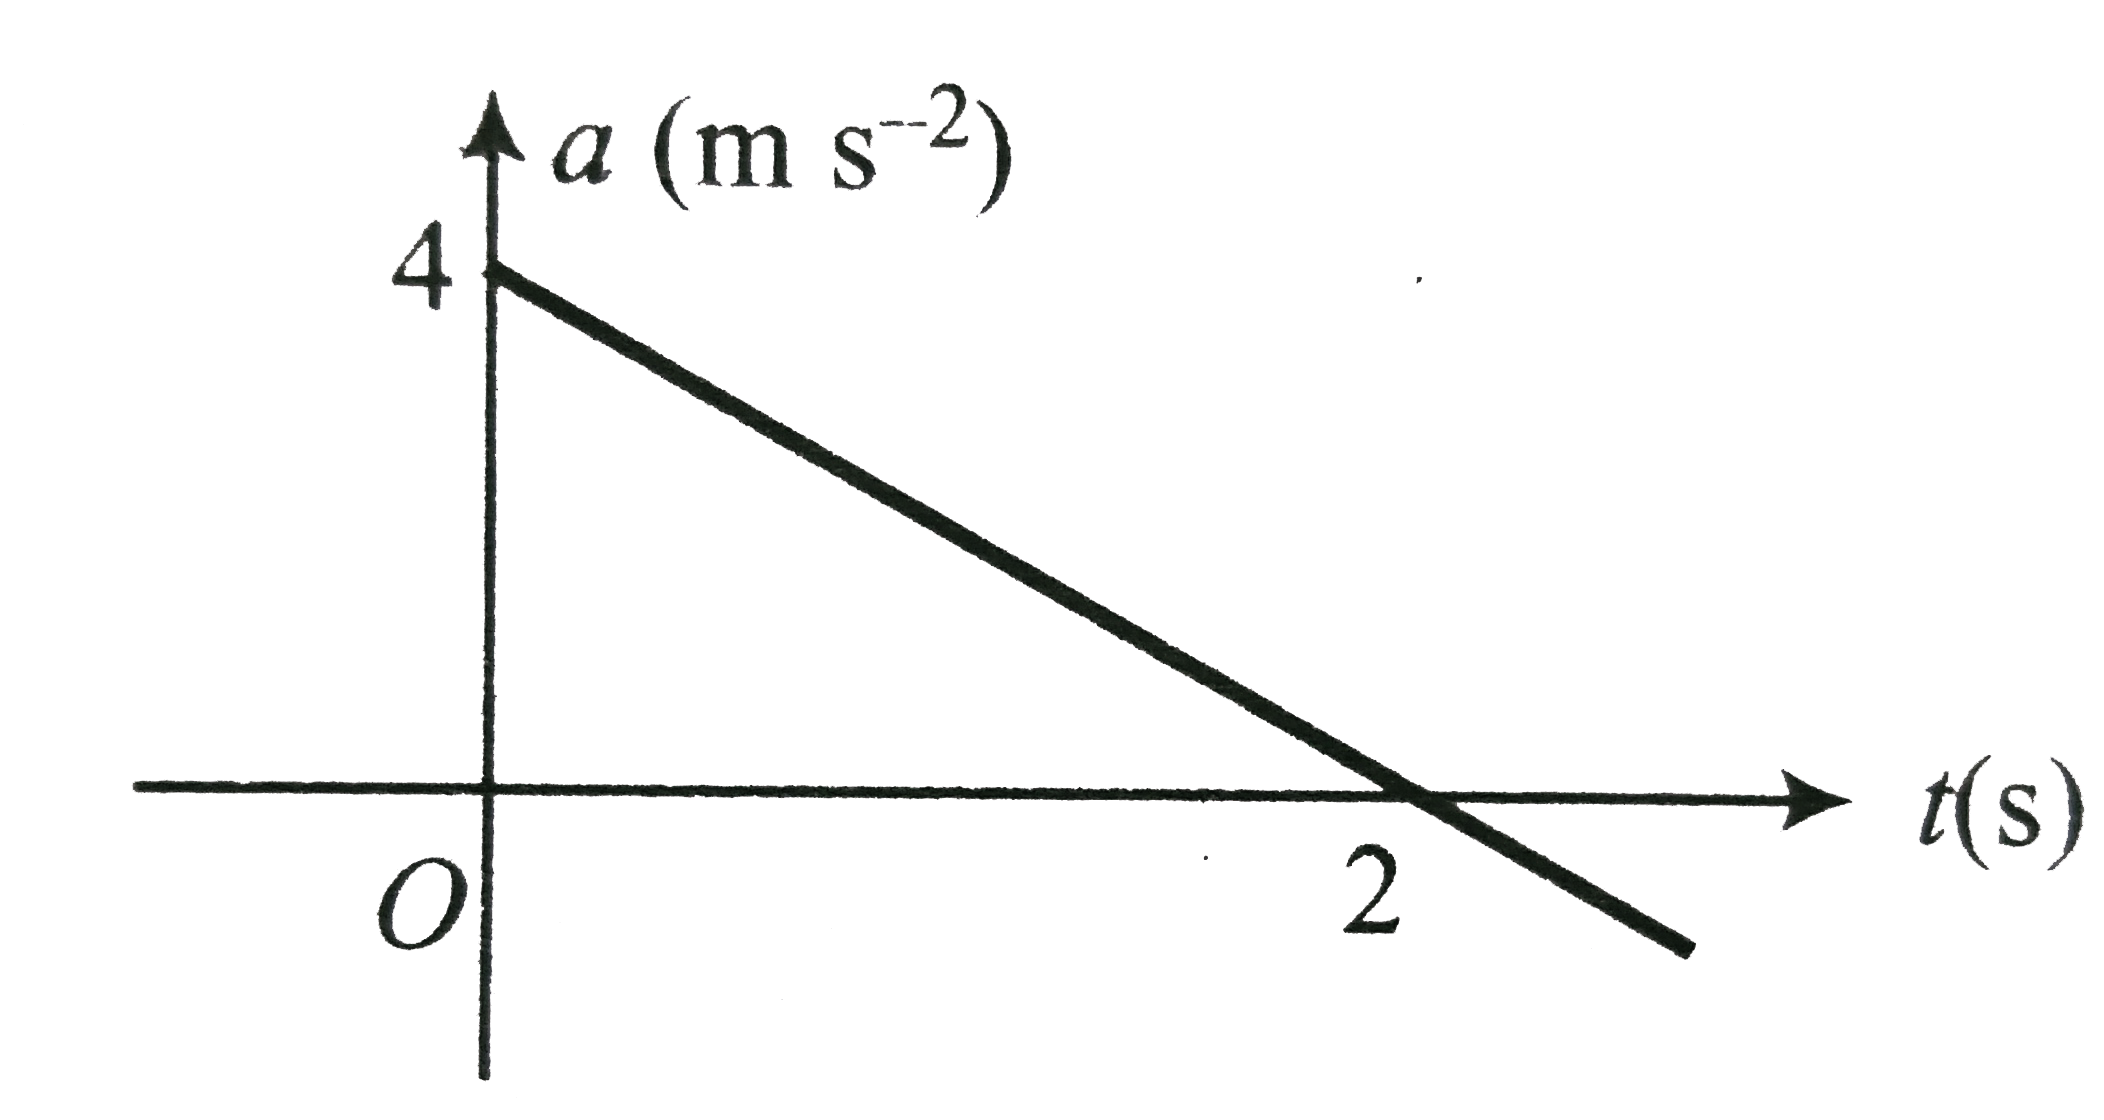 .
.
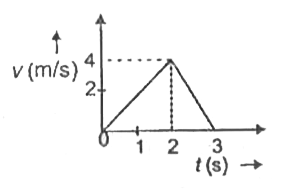
View SolutionThe velocity versus time graph of a body moving in a straight line is as shown in the figure below
View SolutionFind the equation of the straight line passing through origin and the point of intersection of the lines x+2y=7 and x−y=4 .
View SolutionFor the reaction A→products , the graph of the fraction of A remaining as a function of time (x− axis ) is a straight line with −ve slpe . The order of the reaction is therefore
View SolutionIn a second order reaction, the plot of 1/(a−x) versus t is a straight line.
View SolutionThe graph between concentration (X) of the Product and time of the reaction A→B is of the type 1. Hence, graph between −d[A]dt and time will be of the type:
View SolutionThe graph between concentration (X) of the Product and time of the reaction A→B is of the type 1. Hence, graph between −d[A]dt and time will be of the type:

View SolutionThe kinetic energy (KE) versus time graph for a particle moving along a straight line is as shown in the figure. The force versus time graph for the particle may be
View Solution
