In which process P-V diagramis a stright line parallel to the volume axis ?
Iochoric
Isobaric
Isothermal
Adiabatic
The correct Answer is:B
To determine in which process the P-V (Pressure-Volume) diagram is a straight line parallel to the volume axis, we can analyze the characteristics of different thermodynamic processes.
1. Understanding the P-V Diagram:
- The P-V diagram plots pressure (P) on the y-axis and volume (V) on the x-axis.
- A straight line parallel to the volume axis indicates that pressure remains constant while volume changes.
2. Identifying the Characteristics of Processes:
- Isobaric Process: In this process, the pressure remains constant (P = constant) while the volume can change. This means that if we were to plot this on a P-V diagram, it would appear as a horizontal line (parallel to the volume axis).
- Isochoric Process: In this process, the volume remains constant (V = constant) while pressure can change. This would appear as a vertical line (parallel to the pressure axis).
- Isothermal Process: In this process, the temperature remains constant, and the curve is hyperbolic, not a straight line.
- Adiabatic Process: This process also does not yield a straight line on the P-V diagram; it is represented by a curve.
3. Conclusion:
- Since we are looking for a straight line parallel to the volume axis, we conclude that the process being described is an Isobaric Process.
Final Answer:
The process in which the P-V diagram is a straight line parallel to the volume axis is the Isobaric Process.
- The P-V diagram plots pressure (P) on the y-axis and volume (V) on the x-axis.
- A straight line parallel to the volume axis indicates that pressure remains constant while volume changes.
- Isobaric Process: In this process, the pressure remains constant (P = constant) while the volume can change. This means that if we were to plot this on a P-V diagram, it would appear as a horizontal line (parallel to the volume axis).
- Isochoric Process: In this process, the volume remains constant (V = constant) while pressure can change. This would appear as a vertical line (parallel to the pressure axis).
- Isothermal Process: In this process, the temperature remains constant, and the curve is hyperbolic, not a straight line.
- Adiabatic Process: This process also does not yield a straight line on the P-V diagram; it is represented by a curve.
- Since we are looking for a straight line parallel to the volume axis, we conclude that the process being described is an Isobaric Process.
The process in which the P-V diagram is a straight line parallel to the volume axis is the Isobaric Process.
Topper's Solved these Questions
- THERMODYNAMICSBOOK - AAKASH INSTITUTE ENGLISHCHAPTER - THERMODYNAMICSEXERCISE - ASSIGNMENT (SECTION -B) (Objective Type Questions)
30 Videos
- THERMODYNAMICSBOOK - AAKASH INSTITUTE ENGLISHCHAPTER - THERMODYNAMICSEXERCISE - ASSIGNMENT (SECTION -C) (Previous Year Questions)
63 Videos
- THERMODYNAMICSBOOK - AAKASH INSTITUTE ENGLISHCHAPTER - THERMODYNAMICSEXERCISE - EXERCISE
20 Videos
- THERMAL PROPERTIES OF MATTERBOOK - AAKASH INSTITUTE ENGLISHCHAPTER - THERMAL PROPERTIES OF MATTEREXERCISE - Assignment (Section-J) Akash Challengers Questions
7 Videos
- UNITS AND MEASUREMENTSBOOK - AAKASH INSTITUTE ENGLISHCHAPTER - UNITS AND MEASUREMENTSEXERCISE - ASSIGNMENT (SECTION - D)
15 Videos
Similar Questions
Assertion: In isochoric process p-V graph is straight line parallel to p-axis.
Reason: In isochoric process density ρ remains constant.
View SolutionA cyclic process ABCA shown in the V-T diagram is performed with a constant mass of an ideal gas. Show the same process on a p-V diagram, In the figure, CA is parallel to the V-axis and BC is parallel to the T-axis.<br><imga≤ocr_imageload∈g=lazysrc=https://d10lpgp6xz60nq.cloudfront.net/physics_imagesHCV_VOL2_C24_S01_010_Q01.pngwh=80%mx-autosty≤=background:white;>
View SolutionAssertion: In isobaric process, (V - T) graph is a straight line passing through origin. Slope of this line is directly proportional to mass of the gas. (V) is taken on (y - axis).
Reason: V=(nRp)T
∴ Slope∝n
or slope∝m.
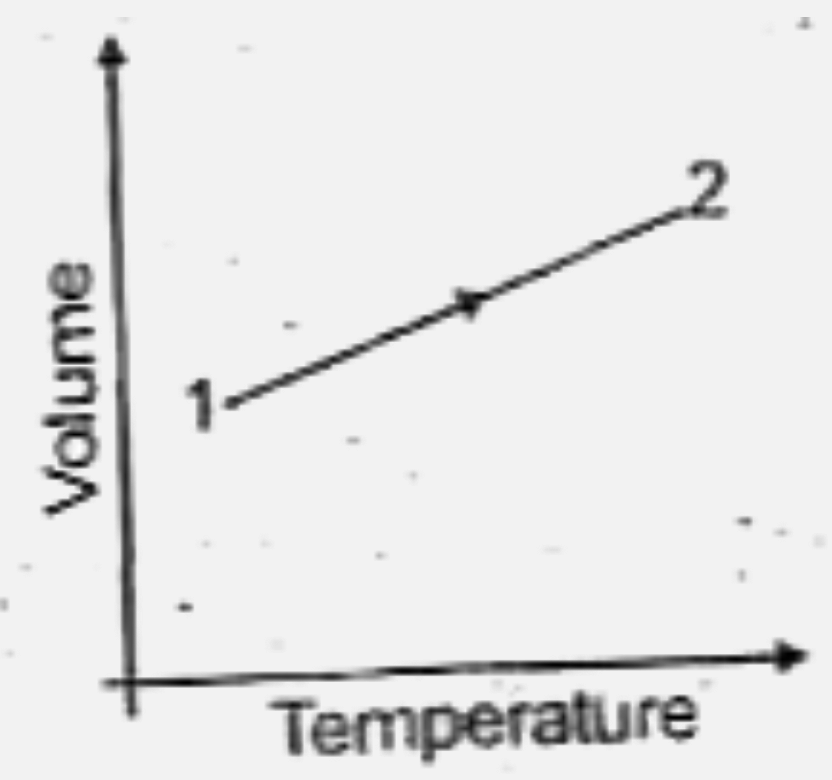
View SolutionOn a volume-temperature diagram a process 1-2 is an upward sloping straight line having the tendency to ct the volume axis as shown in the figure ehead. During this process the preseure

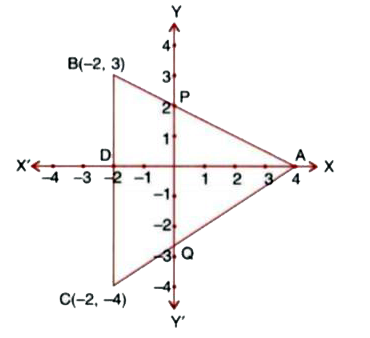
View SolutionIn the figure, given, ABC is a triangle and BC is parallel to the y-axis. AB and AC intersect the y-axis at P and Q respectively.

Find the equation of the line AC.
View SolutionAn ideal gas has pressure p0, volume V0 and temperature T0. It is taken an isochoric process till its pressure is doubled. It is now isothermally expanded to get the original pressure. Finally , the gas is isobarically compressed to its original volume V0. (a) Show the process on a p-V diagram. (b) What is the tempertaure in the isothermal part of the process? (c) What is the volume at the end of the isothermal part of the process?
View SolutionThe tangent at a point P of a curve meets the y-axis at A, and the line parallel to y-axis at A, and the line parallel to y-axis through P meets the x-axis at B. If area of ΔOAB is constant (O being the origin), Then the curve is
View SolutionFind the equation of line passing through point (2,3) which is
(i) parallel of the x-axis
(ii) parallel to the y-axis
View SolutionFind the equation of a line which pasess through the point (1,−1) and parallel to
(i)X−axis (ii)Y−axis
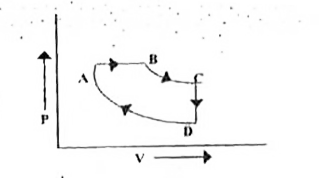
View SolutionA cyclic process ABCD is shown in the figure P-V diagram. Which of the following curves represent the same process?

View Solution
