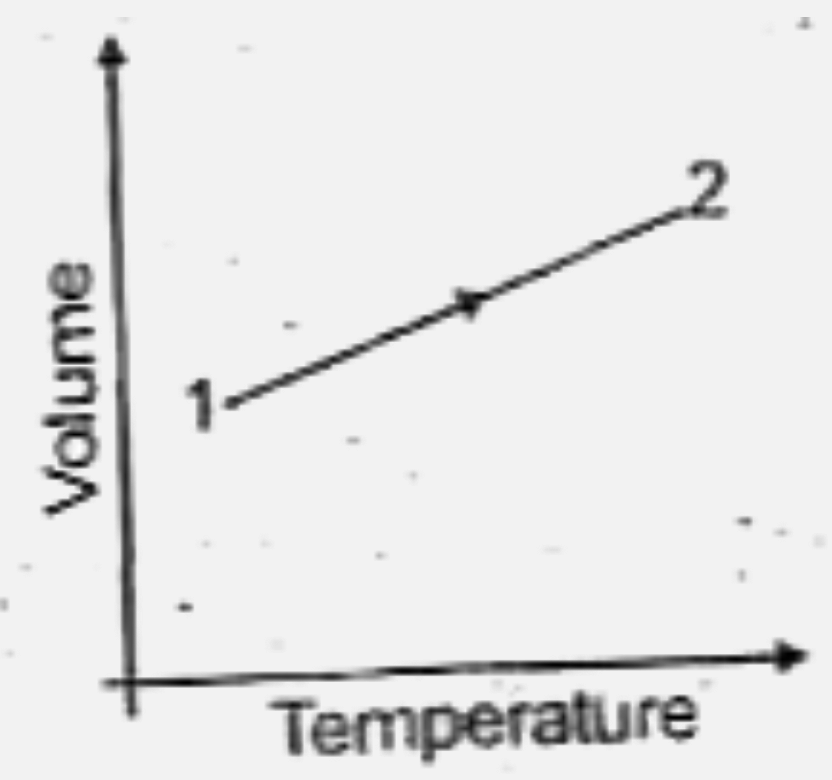
On a volume-temperature diagram a process 1-2 is an upward sloping straight line having the tendency to ct the volume axis as shown in the figure ehead. During this process the preseure
Remains constant
Continuously increases
Continuously decreases
Data insufficient
If this line had the tendency to pass through the origin, the presure had been constant, hence answer(1) is wrong. Look at this process in the background of several isobaric lines.

Here note that p1>p2>p3. The process line 1-2 cuts p3 first then p2 then p1. So during the process 1−2 the pressure continously increases. Hence the correct answer is (2).
Note : But be careful. Let us suppose on the same volume temperature diagram, the upward sloping line has the tendency to cut the tmperature axis as shown below.

Now in the process 1 to 2 the answer will be reversed because first we are touching p1 then p2 then p3. So, we are moving from high pressure p1 to low pressure p3 hence, pressure continuously decreases now.
Similar Questions
In which process P-V diagramis a stright line parallel to the volume axis ?
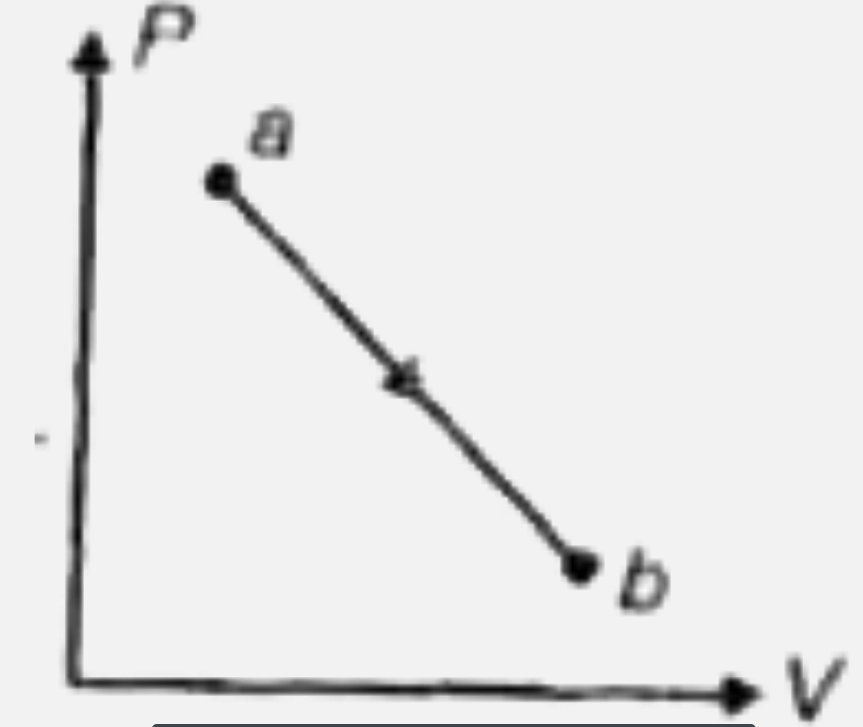
View SolutionA gas undergoes expansion in such a mannerthat its p-V diagram plot is a downward sloping straight line as shown in the figure below. What happens to the temperature during the process ?
 View Solution
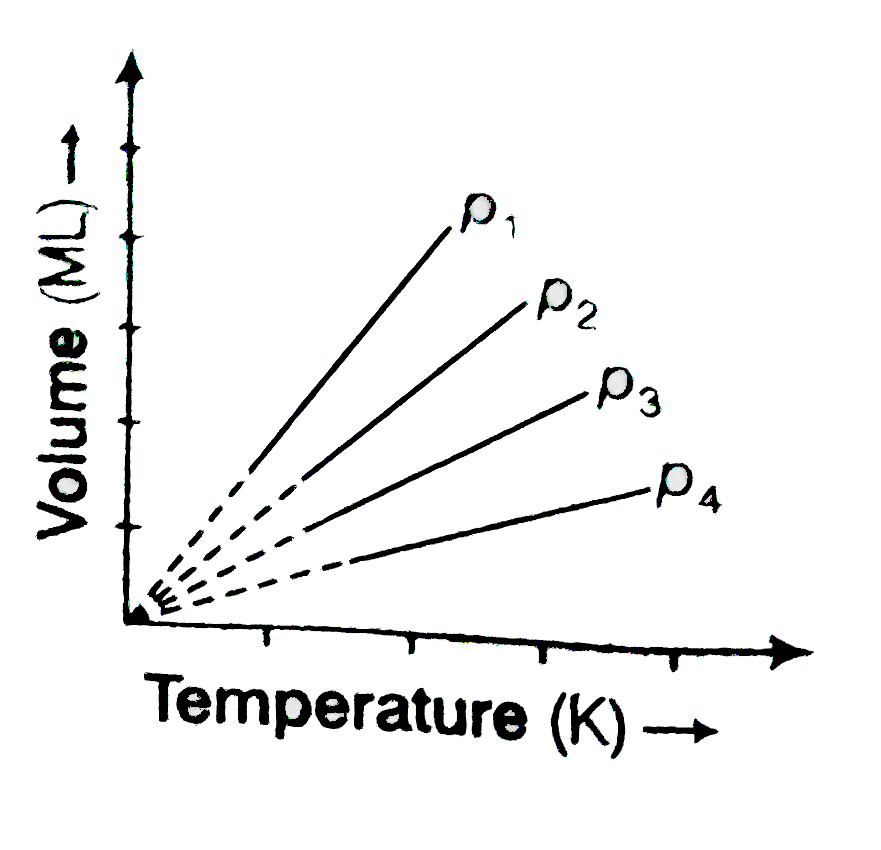
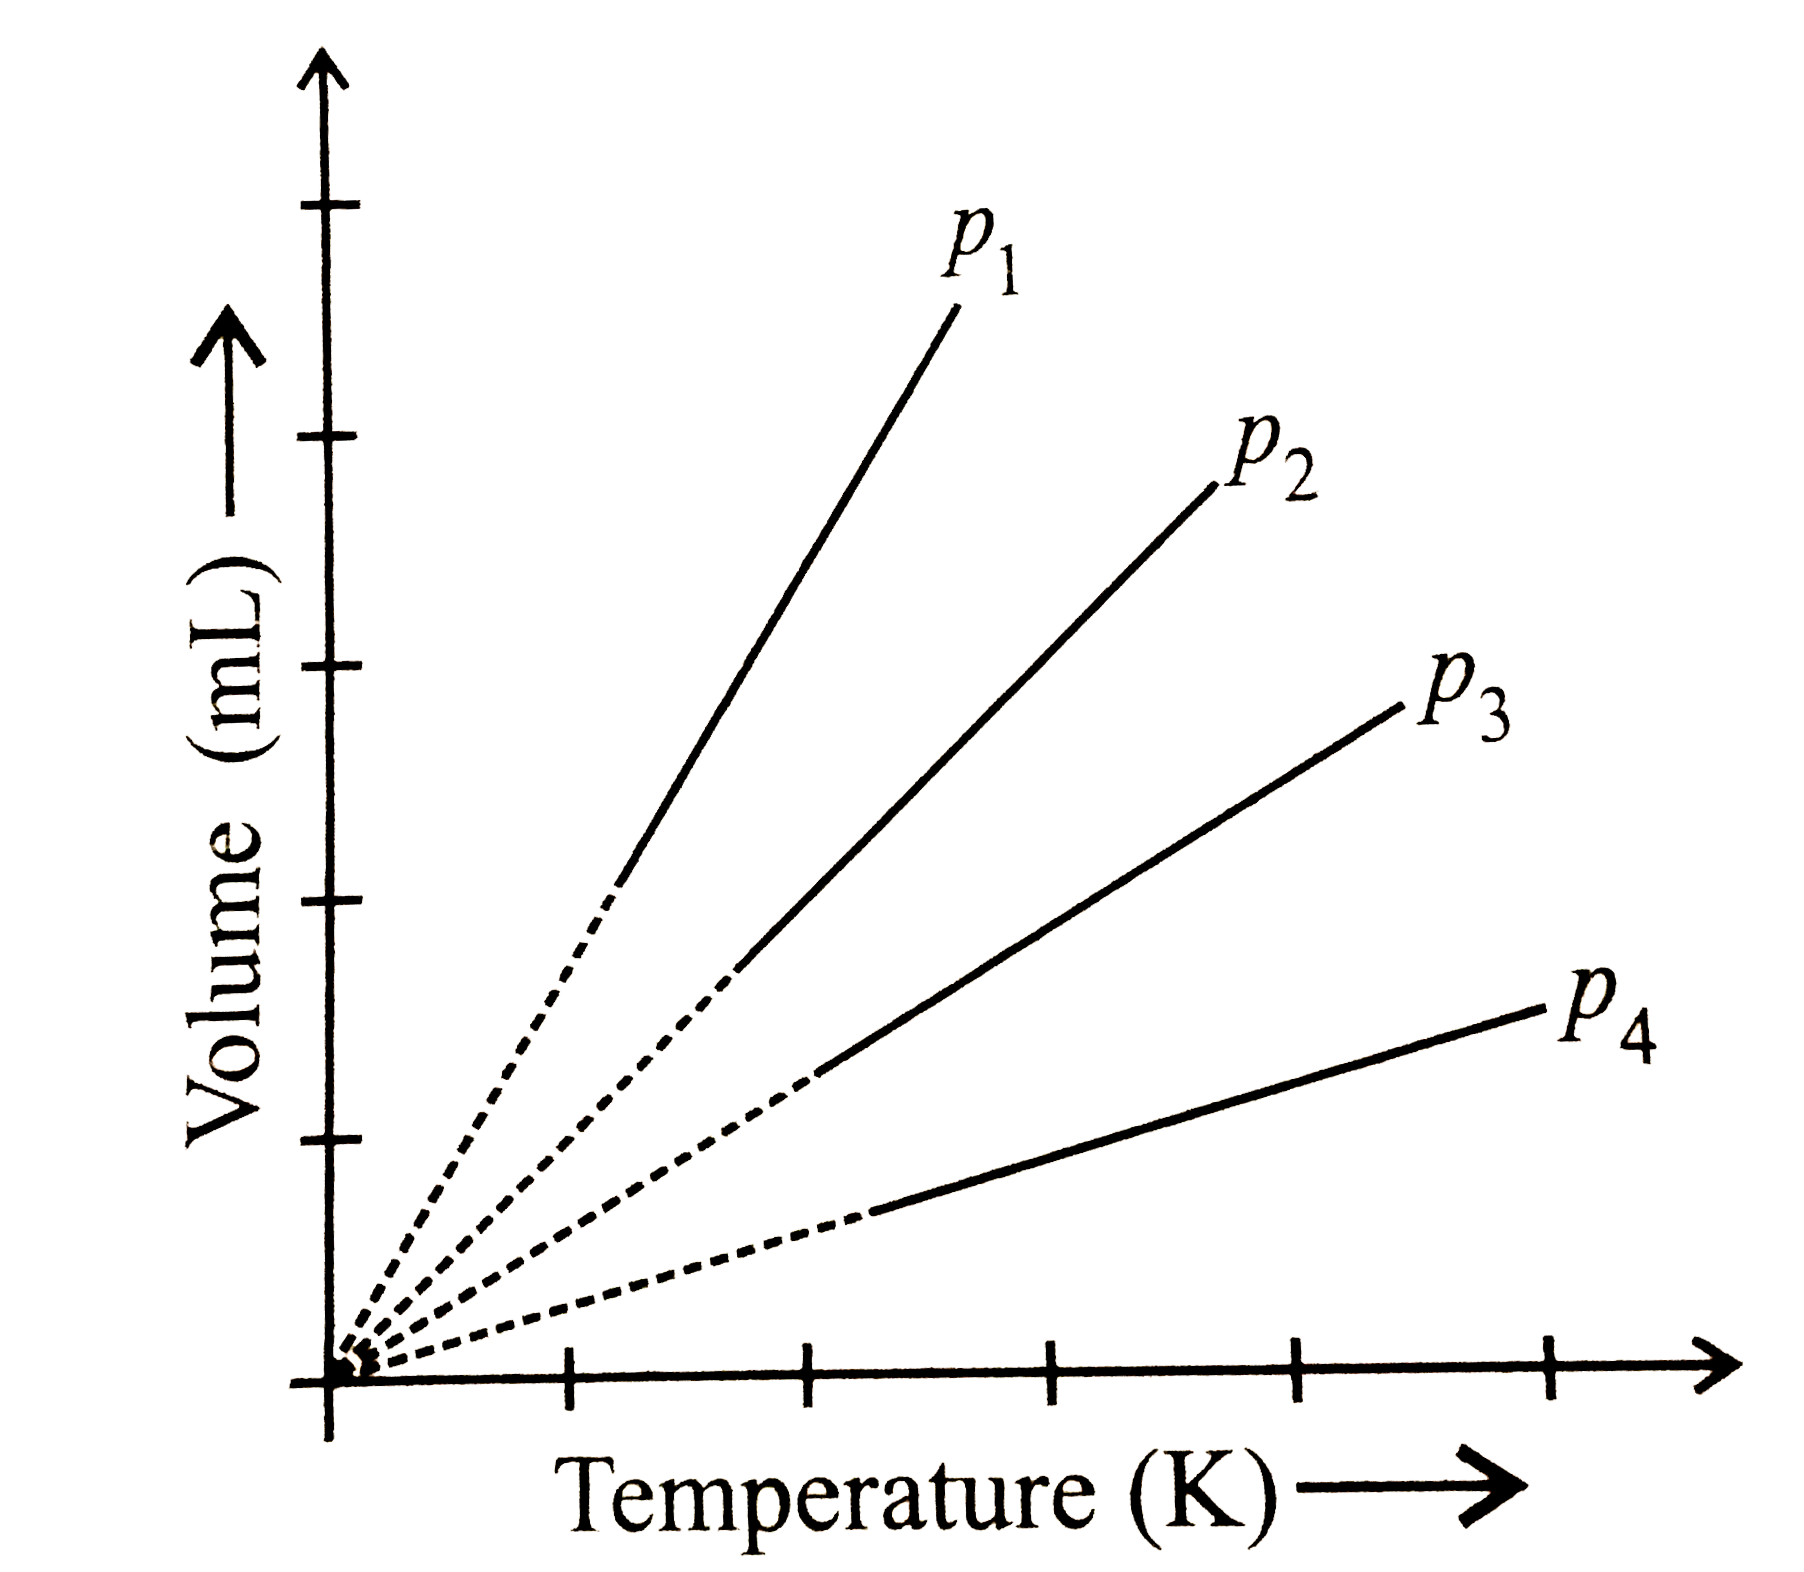
A plot of volume (V) versus temperature (T) for a gas at constant pressure is a straight line passing through the origin. The plots at different values of pressure are shown in figure. Which of the following order of pressure is correct for this gas ?
 View Solution
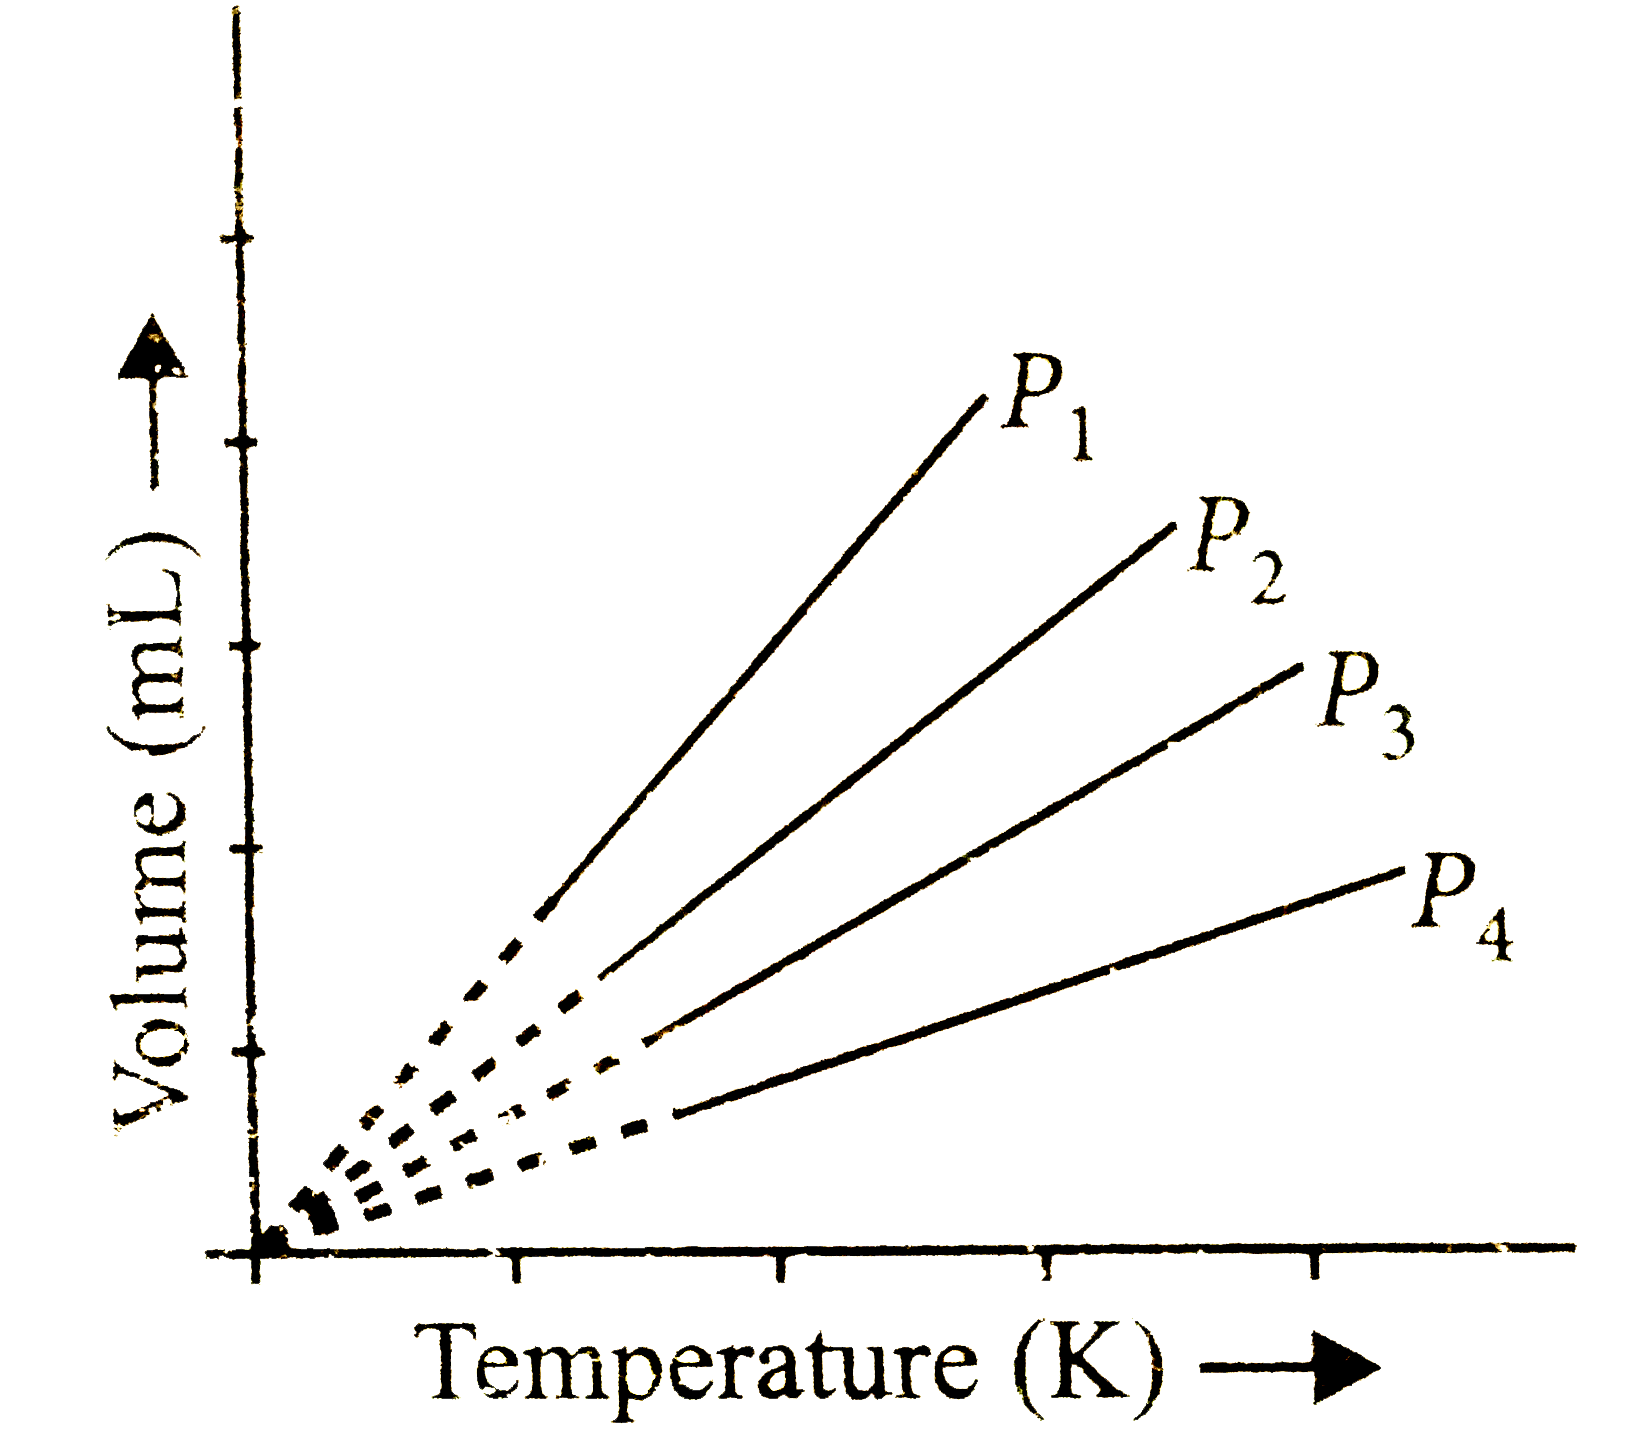
A plot of volume (V) versus temperature (T) for a gas at constant pressure is a straight line passing through the origin . The plots at different values of pressure are shown in figure .
Which of the following order of pressure is correct for this gas ?
 View Solution
A plot of volume (V) versus temperature (T) for a gas at constannt pressure is a straight line passing through the origin. The plots at different values of pressure are shown in figure. Which of the following order of pressure is correct for this gas?
 View Solution
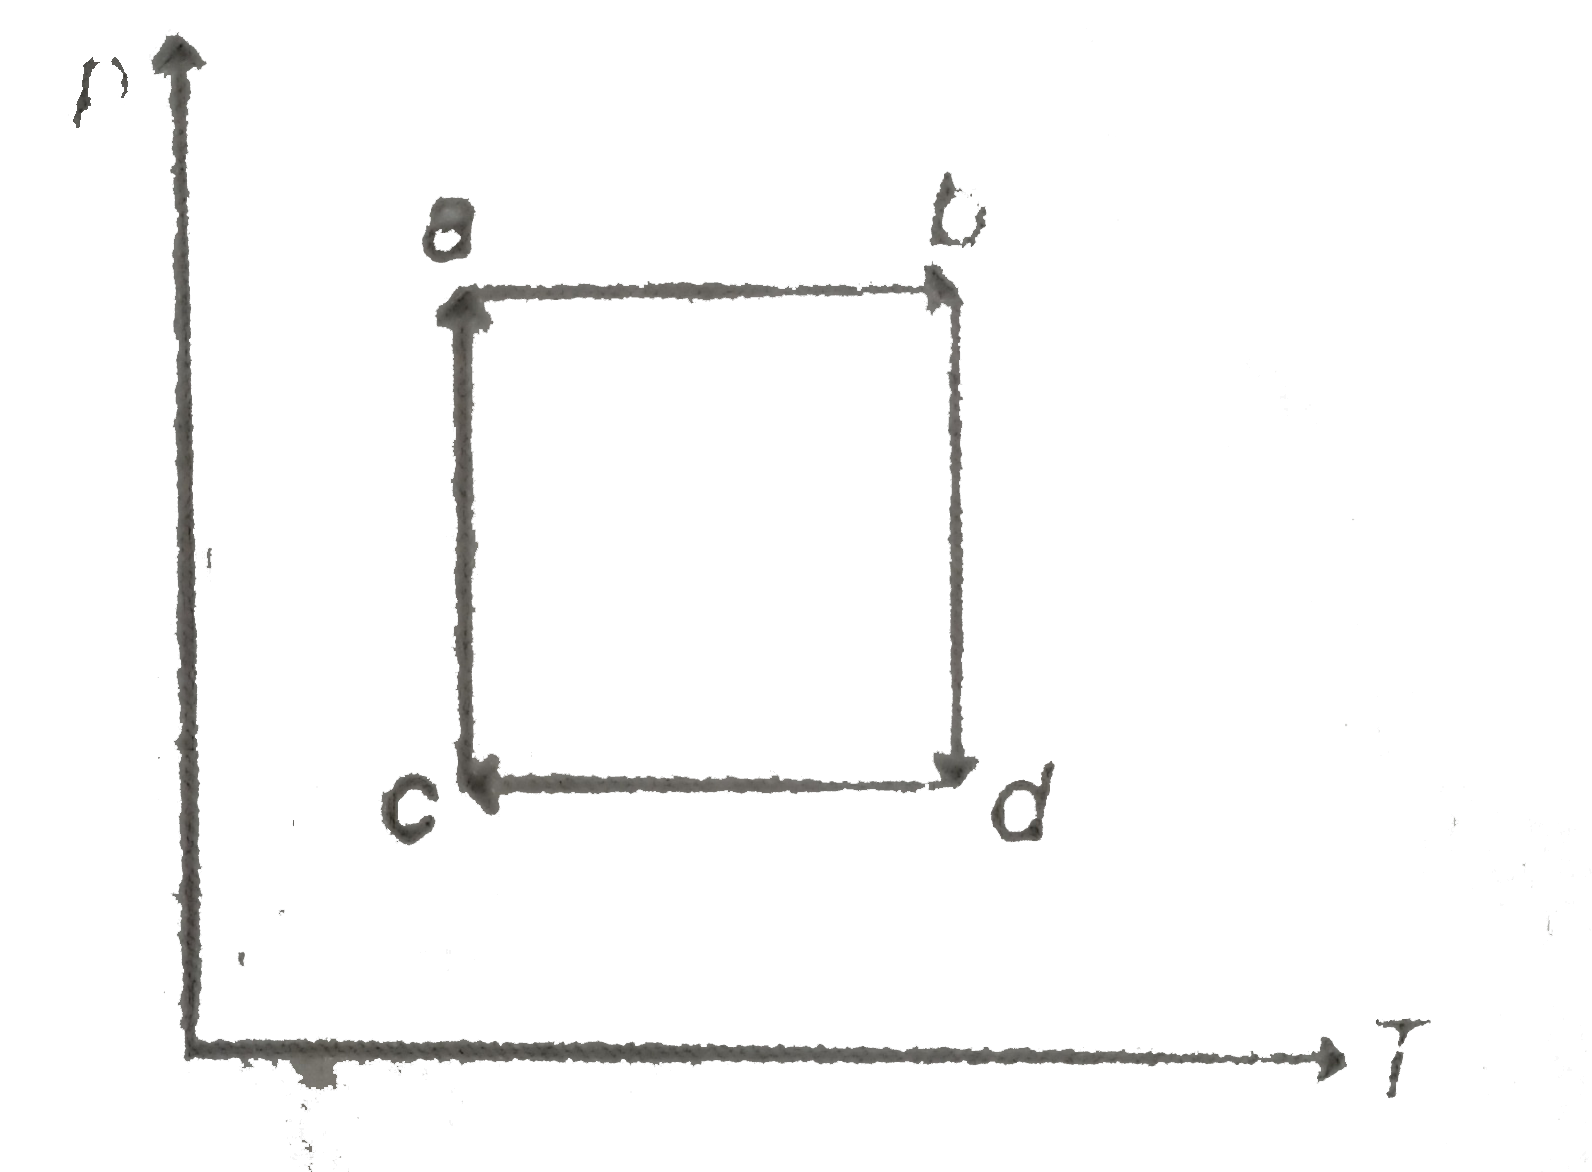
On a pT diagram, a cyclic process is performed as shown. Where is the volume maximum?
 View Solution
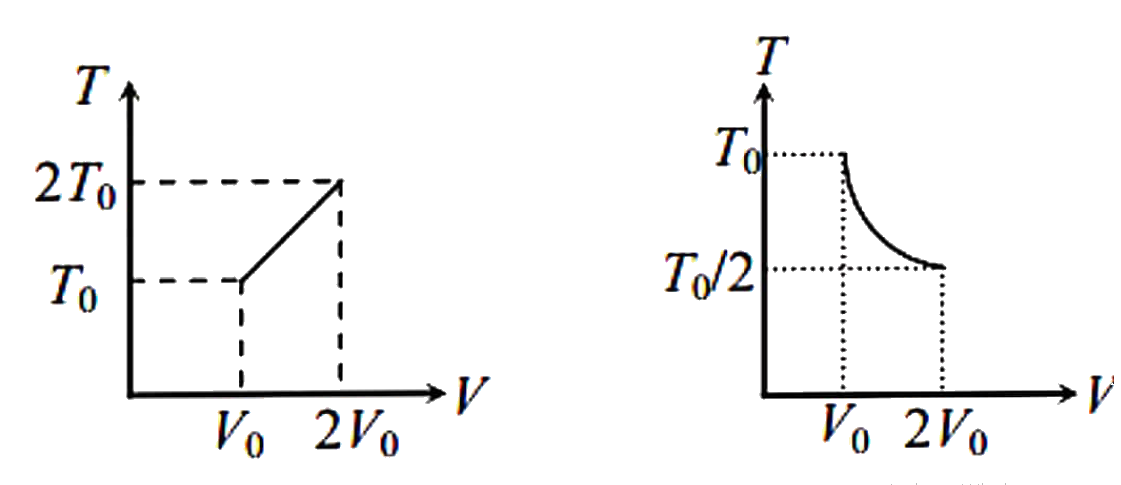
Temperature and volume curves are drawn for two thermodynamic processes. For the first process, it is a straight line and for the second, it is a rectangular hyperbola. The ratio of work done in the first process to the work done in the second process is
 View Solution
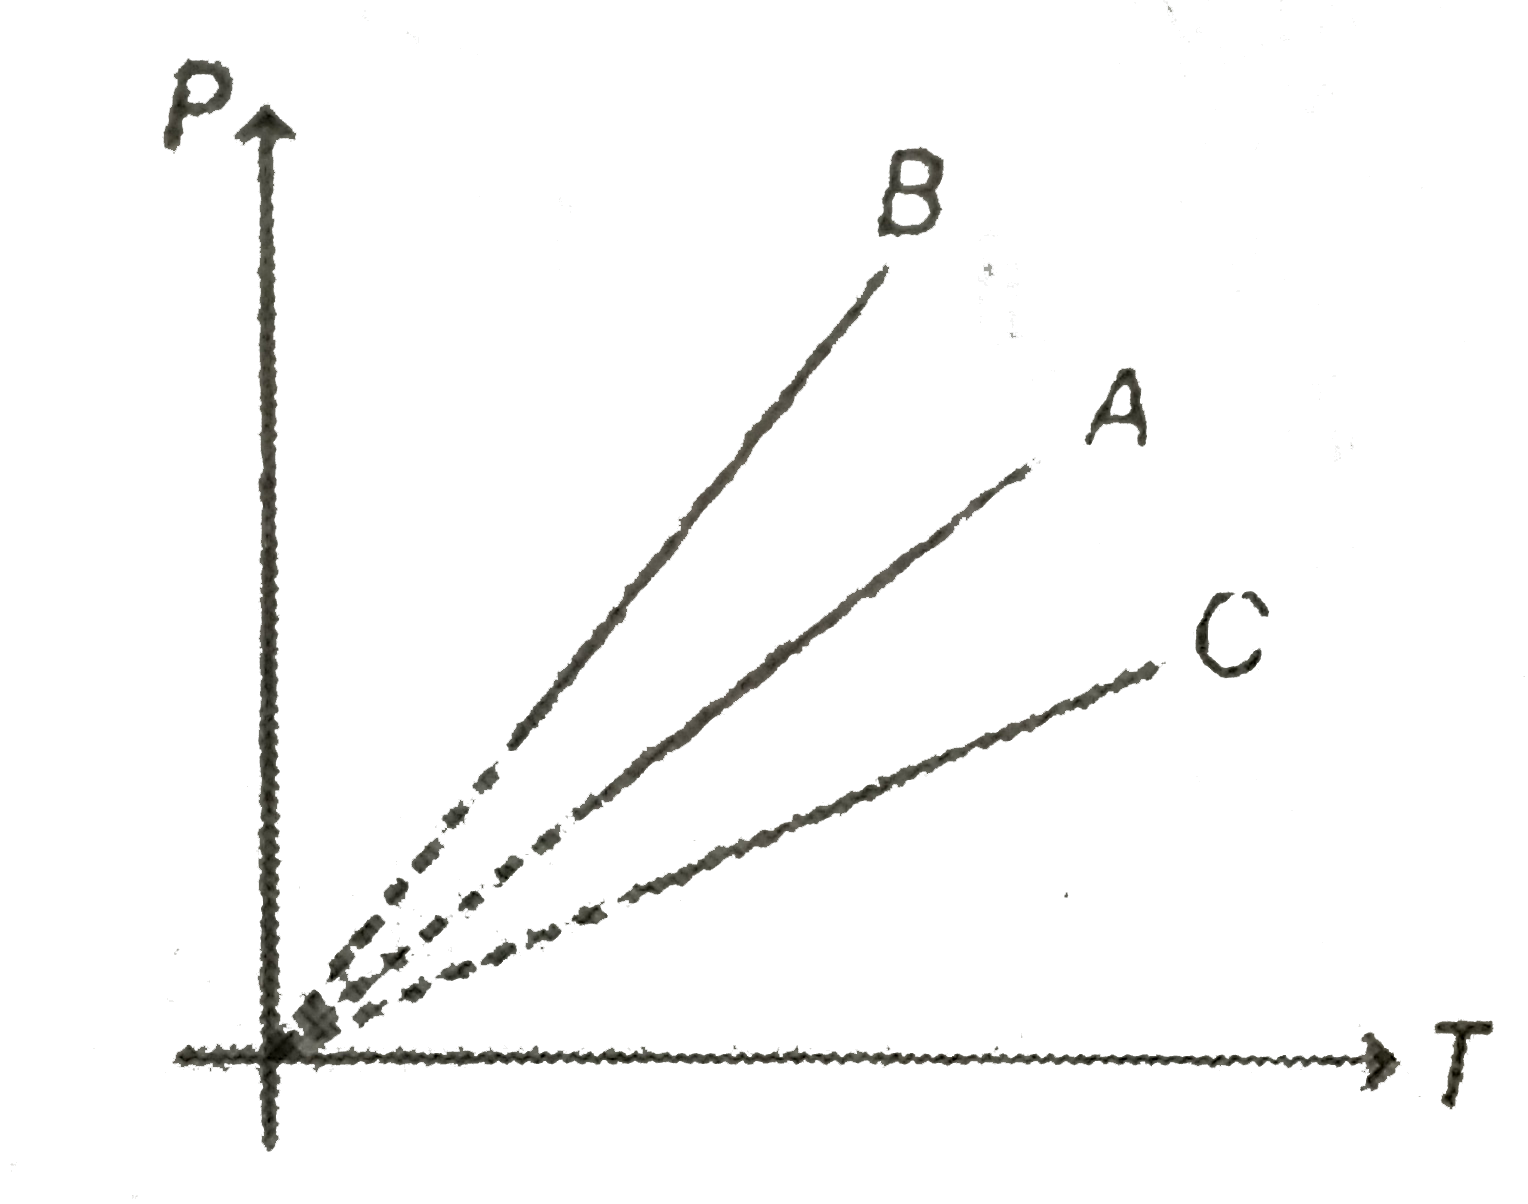
Pressure versus temperature graph of an ideal gas at constant volume V is shown by the straight line A. Now mass of the gas is doubled and the volume is halved, then the corresponding pressure versus temperature graph will be shown by the line
 View Solution
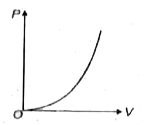
The variation of pressure P with volume V for an ideal diatomic gas is parabolic as shown in the figure . The molar species heat of the gas during this process is
 View Solution
Three processes compose a thermodynamic cycle shown in the accompanying P−V, diagram of an ideal gas.
Process 1→2 take place at constant temperature, during this process 60J of heat enters the system.
Process 2→3 takes place at constant volume. During this process 40J of heat leaves the system.
Process 3→1 is adiabatic.
What is the change in internal energy of the during process 3→1?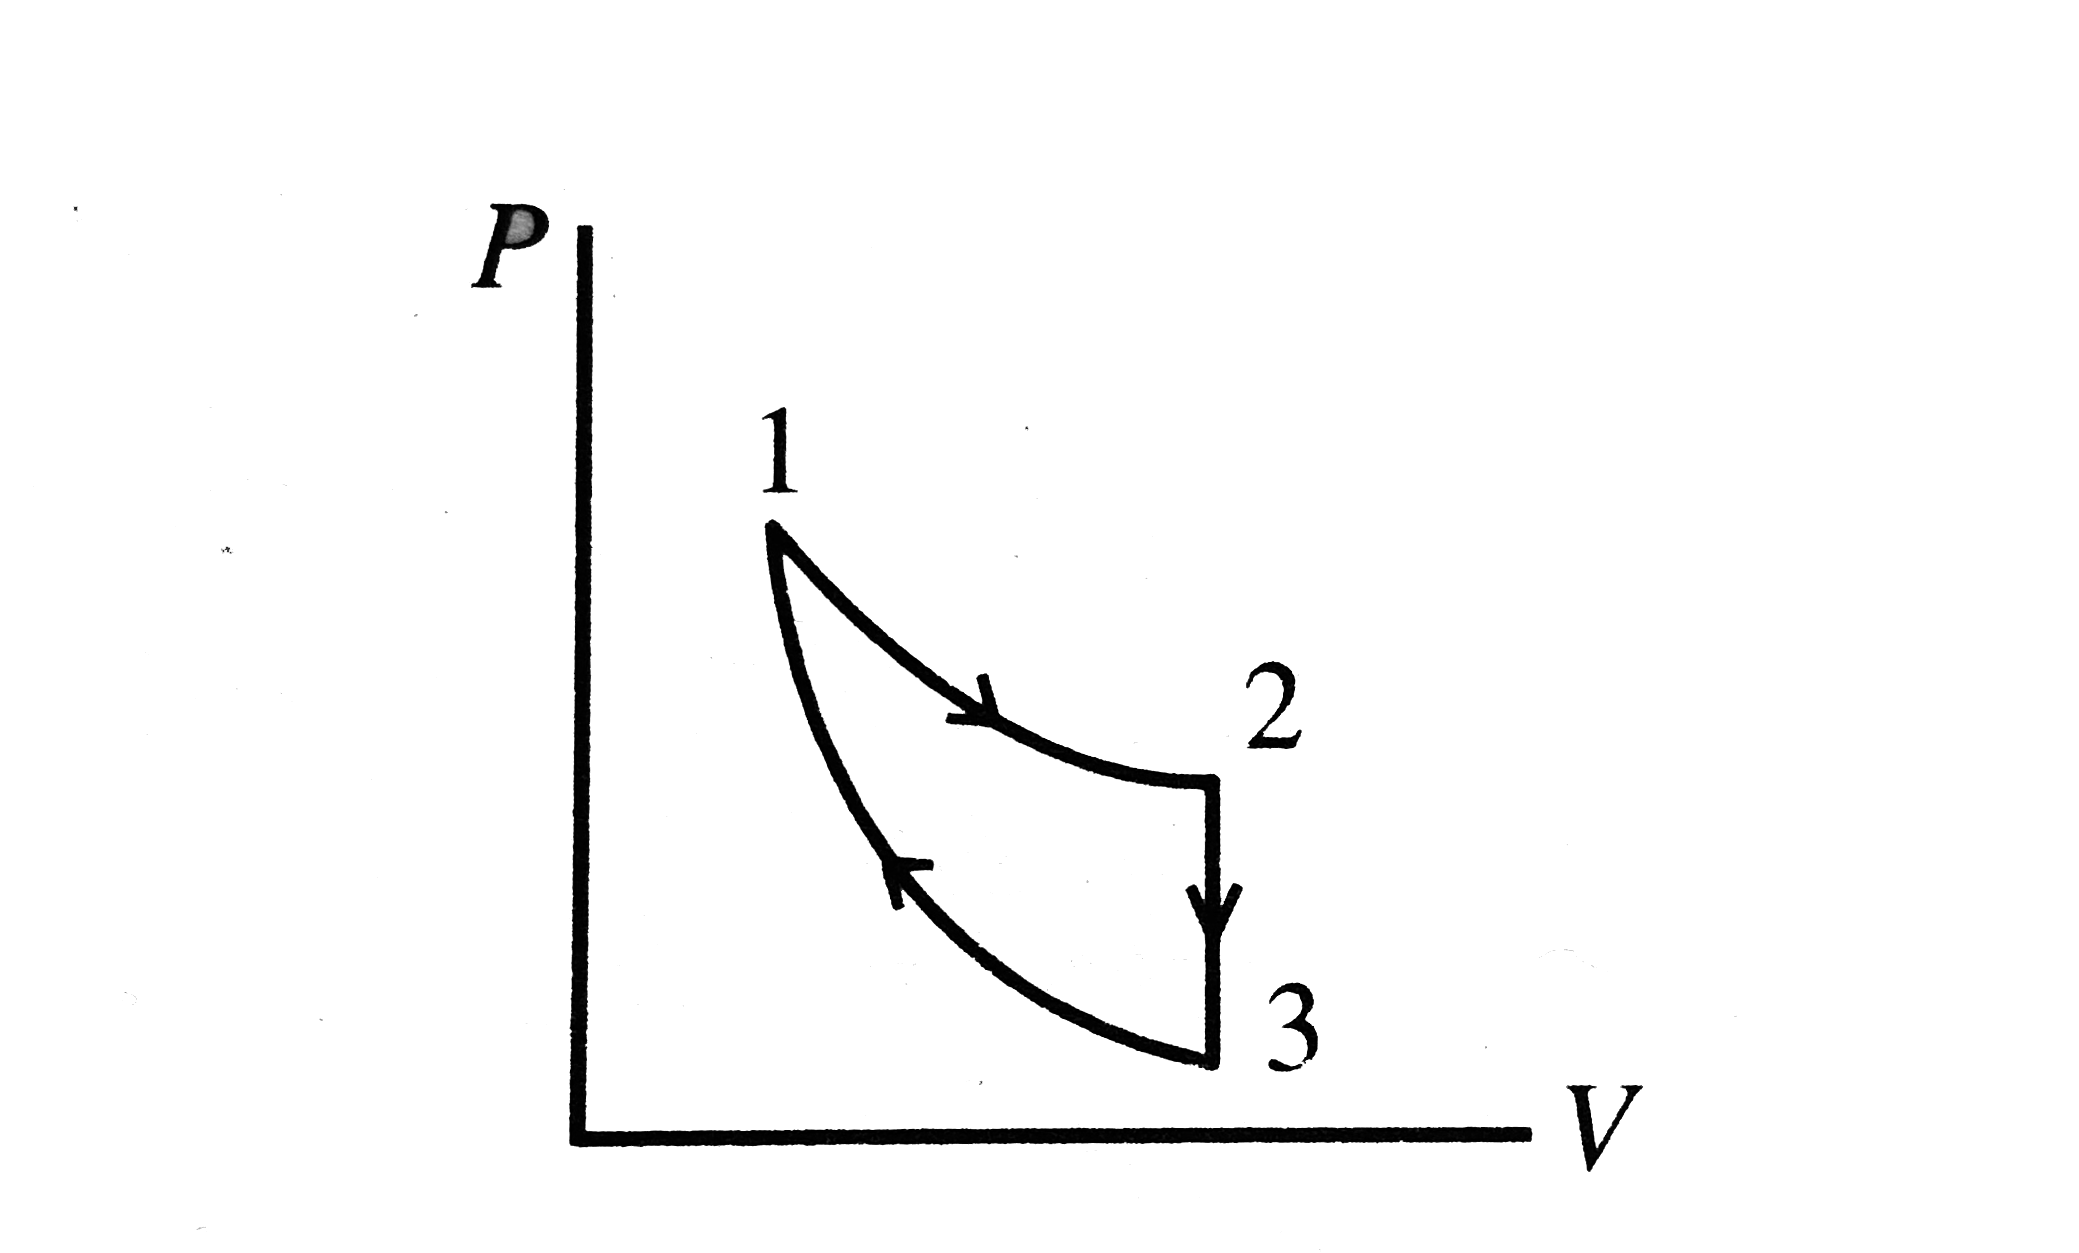 View Solution

