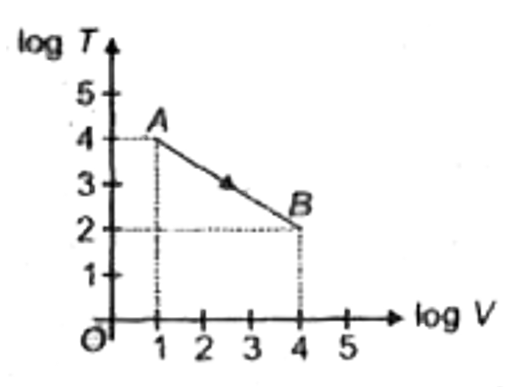
Figure shows , the adiabatic curve on log T and log V scale performed on ideal gas . The gas is
Monatomic
Diatomic
Polyatomic
Mixture of monatomic and diatomic
The correct Answer is:A
Step by step video & image solution for Figure shows , the adiabatic curve on log T and log V scale performed on ideal gas . The gas is by Physics experts to help you in doubts & scoring excellent marks in Class 12 exams.
Updated on:21/07/2023Topper's Solved these Questions
- THERMODYNAMICSBOOK - AAKASH INSTITUTE ENGLISHCHAPTER - THERMODYNAMICSEXERCISE - ASSIGNMENT (SECTION -C) (Previous Year Questions)
63 Videos
- THERMODYNAMICSBOOK - AAKASH INSTITUTE ENGLISHCHAPTER - THERMODYNAMICSEXERCISE - ASSIGNMENT (SECTION -D) (Assertion - Reason Type Questions)
10 Videos
- THERMODYNAMICSBOOK - AAKASH INSTITUTE ENGLISHCHAPTER - THERMODYNAMICSEXERCISE - ASSIGNMENT (SECTION -A) (Objective Type Questions)
47 Videos
- THERMAL PROPERTIES OF MATTERBOOK - AAKASH INSTITUTE ENGLISHCHAPTER - THERMAL PROPERTIES OF MATTEREXERCISE - Assignment (Section-J) Akash Challengers Questions
7 Videos
- UNITS AND MEASUREMENTSBOOK - AAKASH INSTITUTE ENGLISHCHAPTER - UNITS AND MEASUREMENTSEXERCISE - ASSIGNMENT (SECTION - D)
15 Videos
Similar Questions
Knowledge Check
In an adiabatic expansion of an ideal gas -
A(a) W=−ΔUB(b) W=ΔUC(c) ΔU=0D(d) W=0
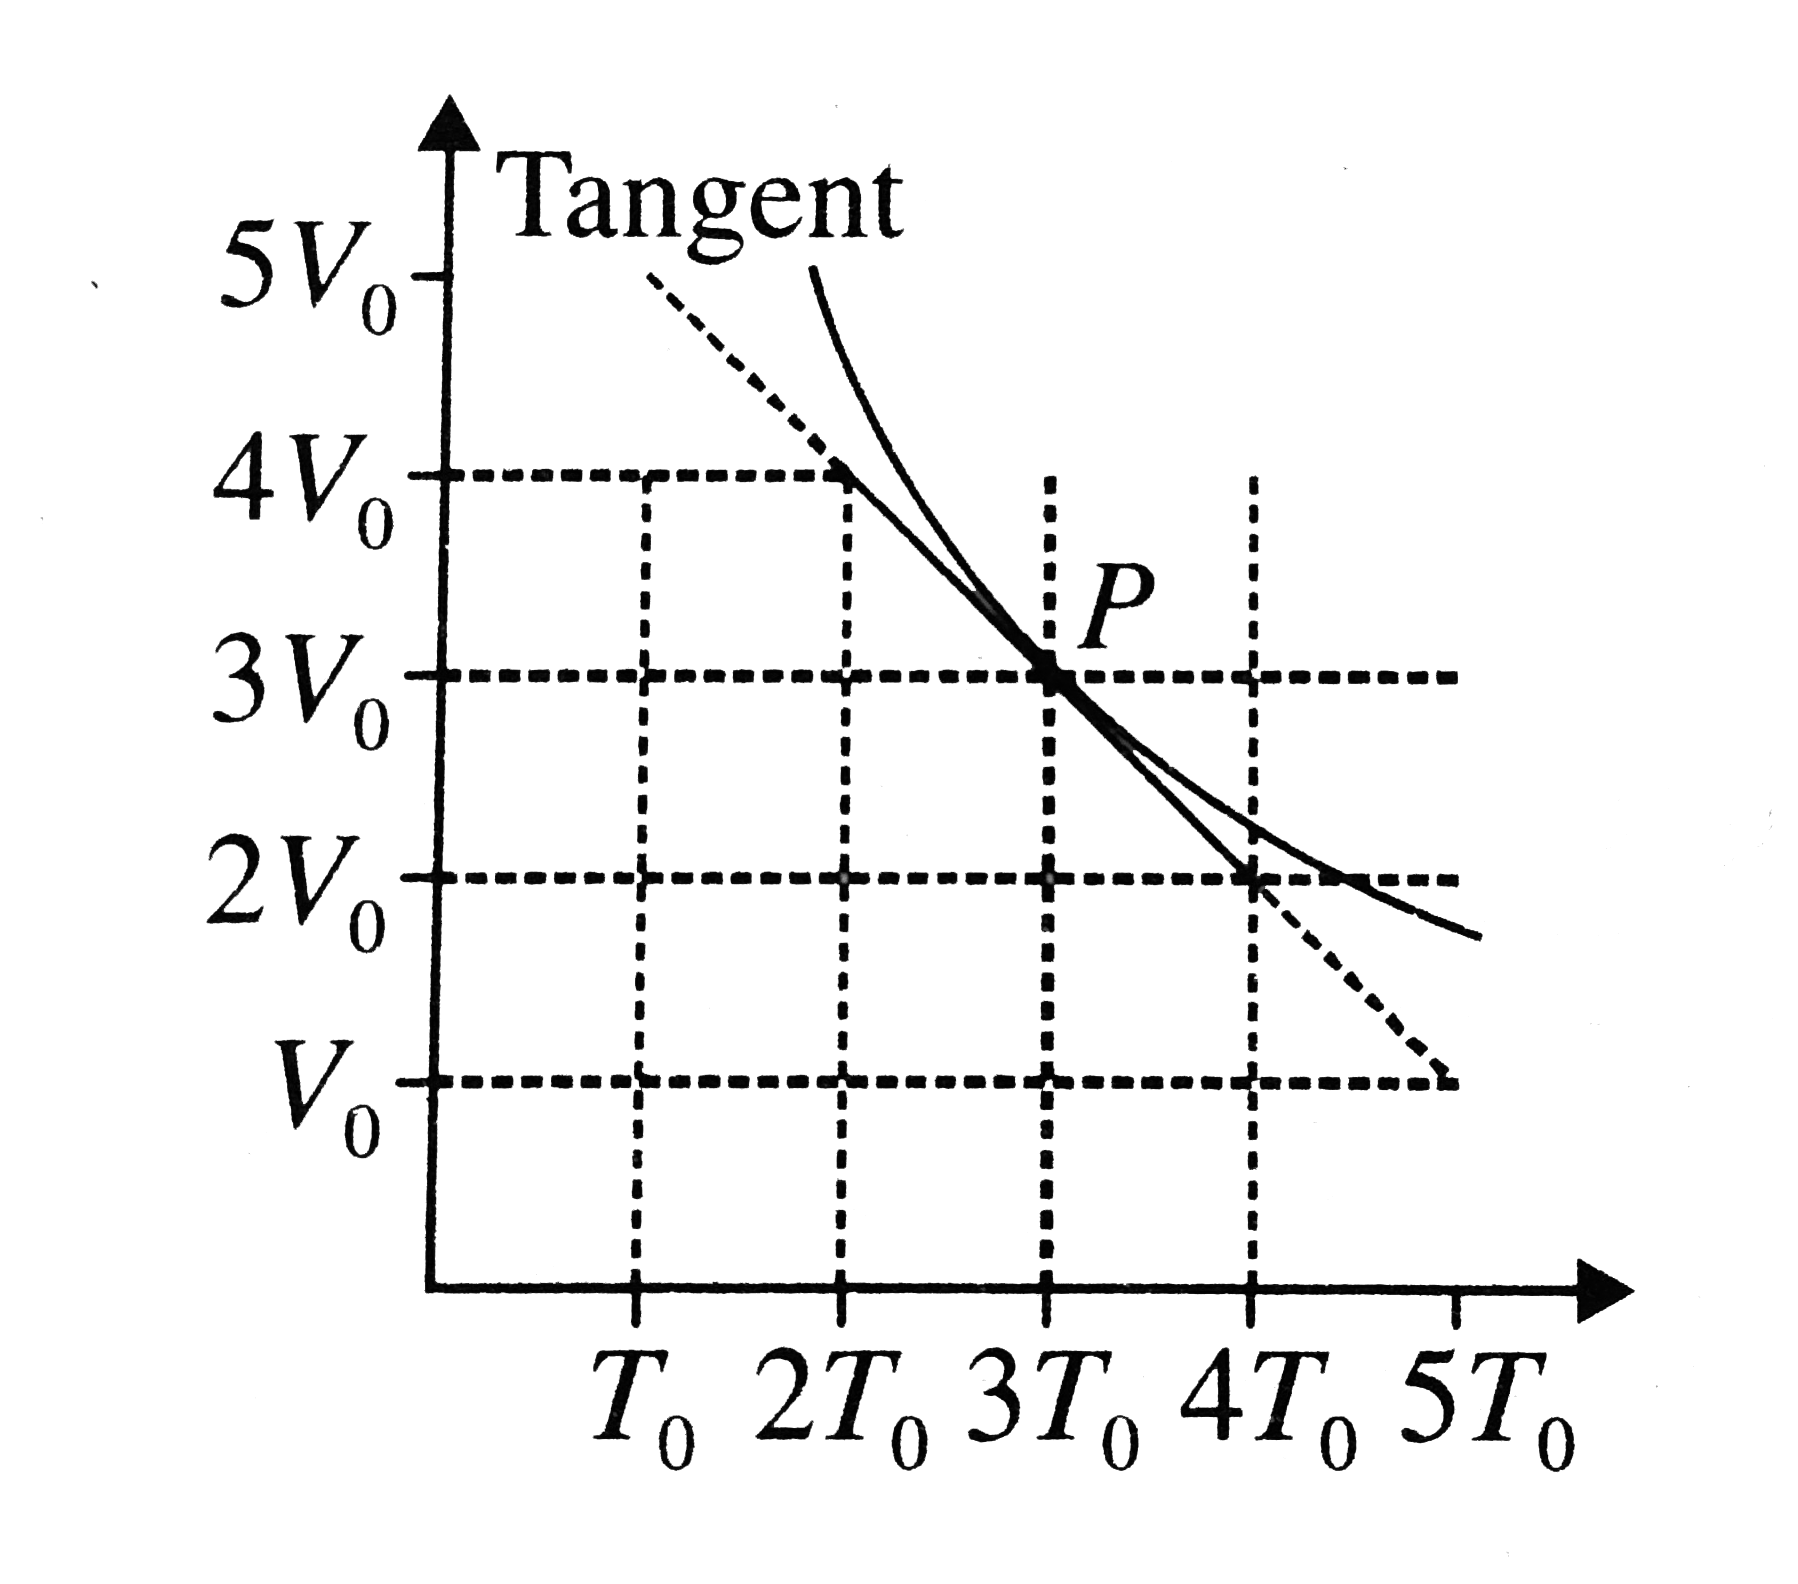
Figure shows the adiabatic curve for n moles of an ideal gas, the bulk modulus for the gas corresponding to the point P will be
View SolutionThe slope of the graph between log P and log V at constant temperature for a given mass of gas is
View SolutionWhich curve in figure represents the curve of ideal gas ?
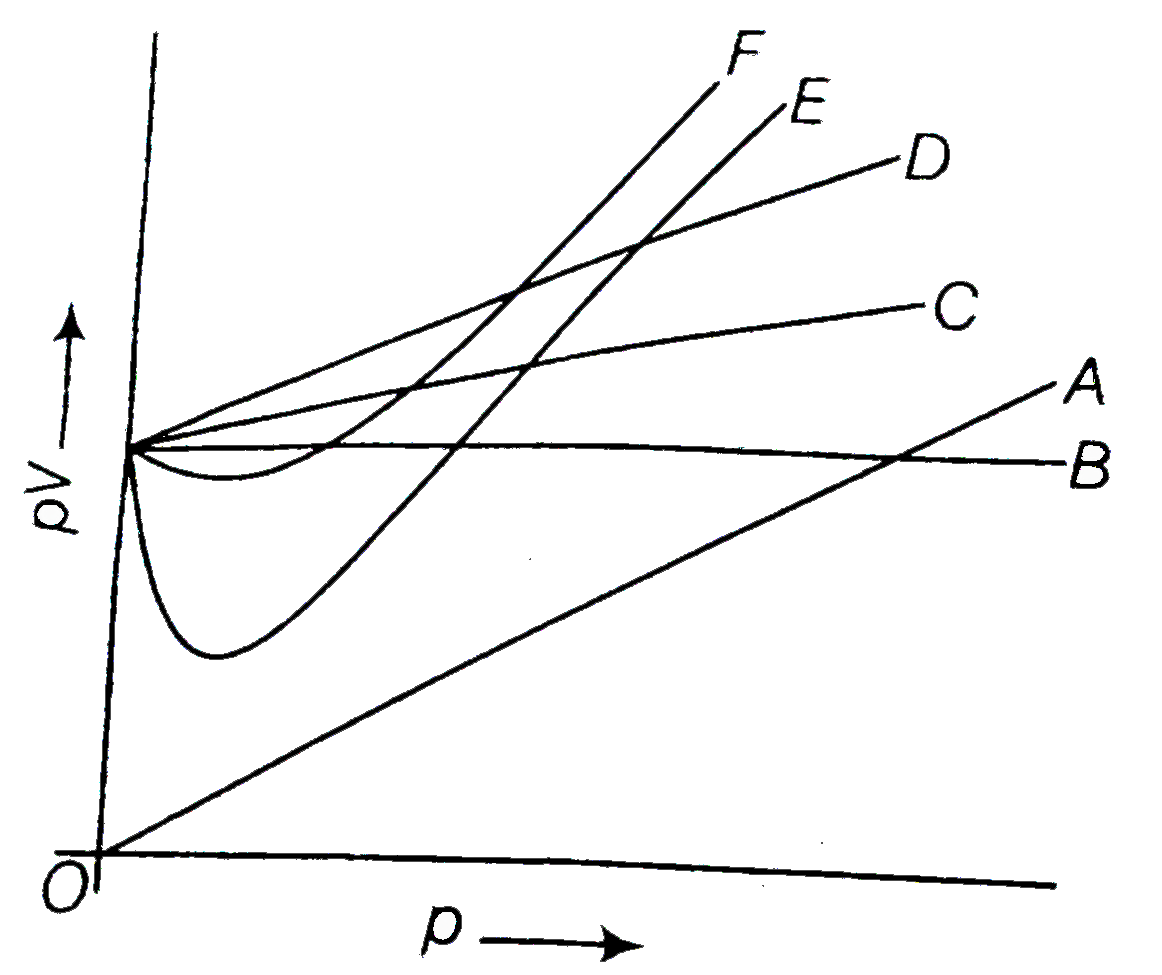
View SolutionWhich curve in figure represents the curve of ideal gas ?

View SolutionThe curves A and B in the figure shown P-V graphs for an isothermal and an adiabatic process for an idea gas. The isothermal process is represented by the curve A.
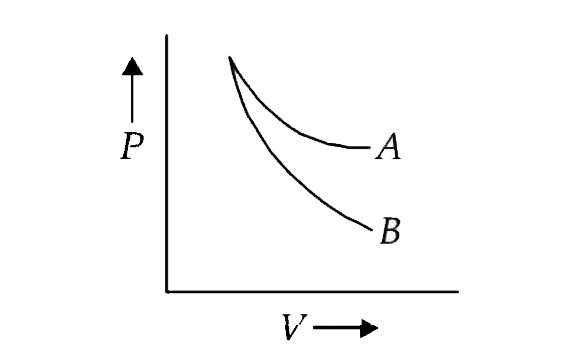
View SolutionThe curves A and B in the figure shown P-V graphs for an isothermal and an adiabatic process for an idea gas. The isothermal process is represented by the curve A.

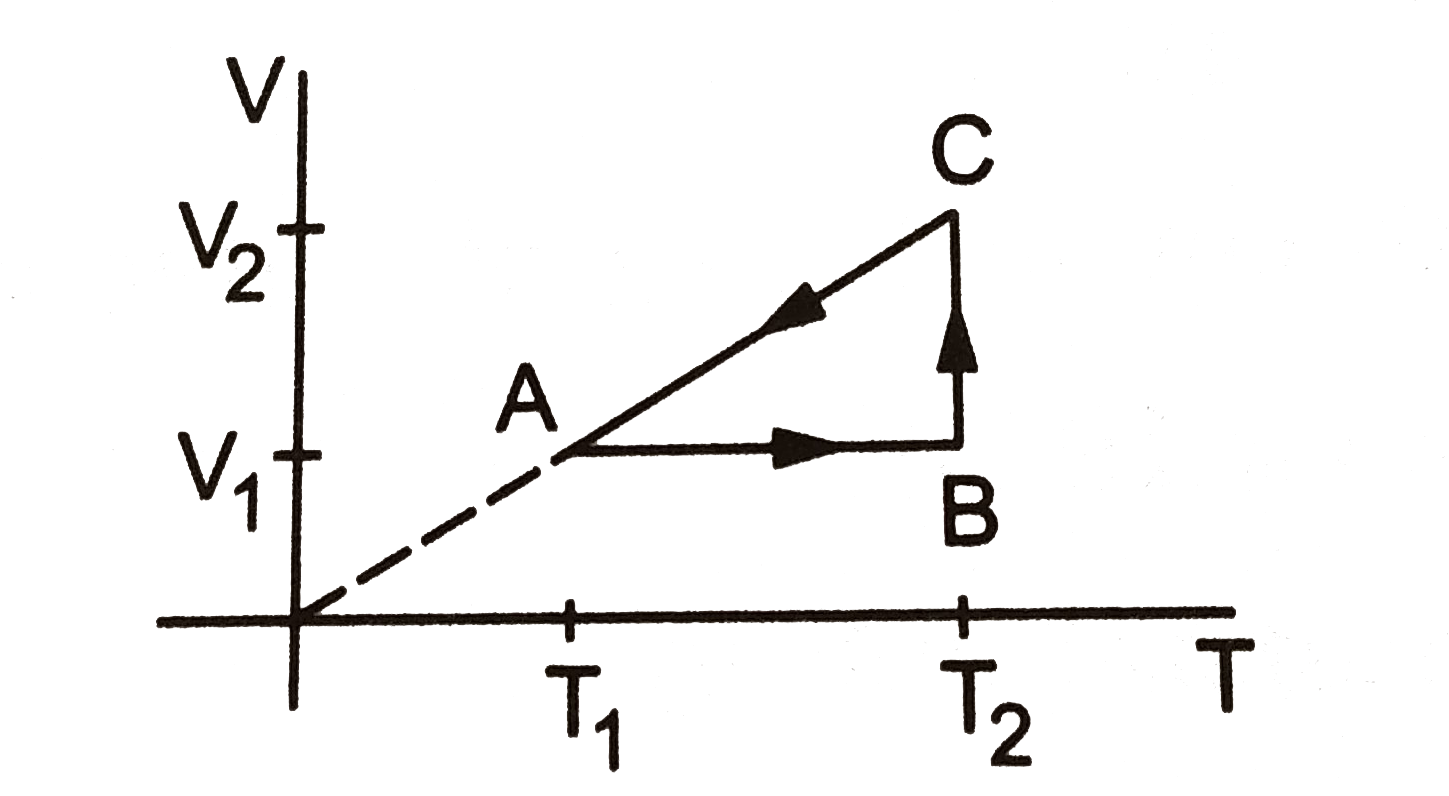
View SolutionFigure Shows a process ABCA performed on an ideal gas. Find the net heat given to the system during the process.
View Solution

_S01_085_Q01.png)