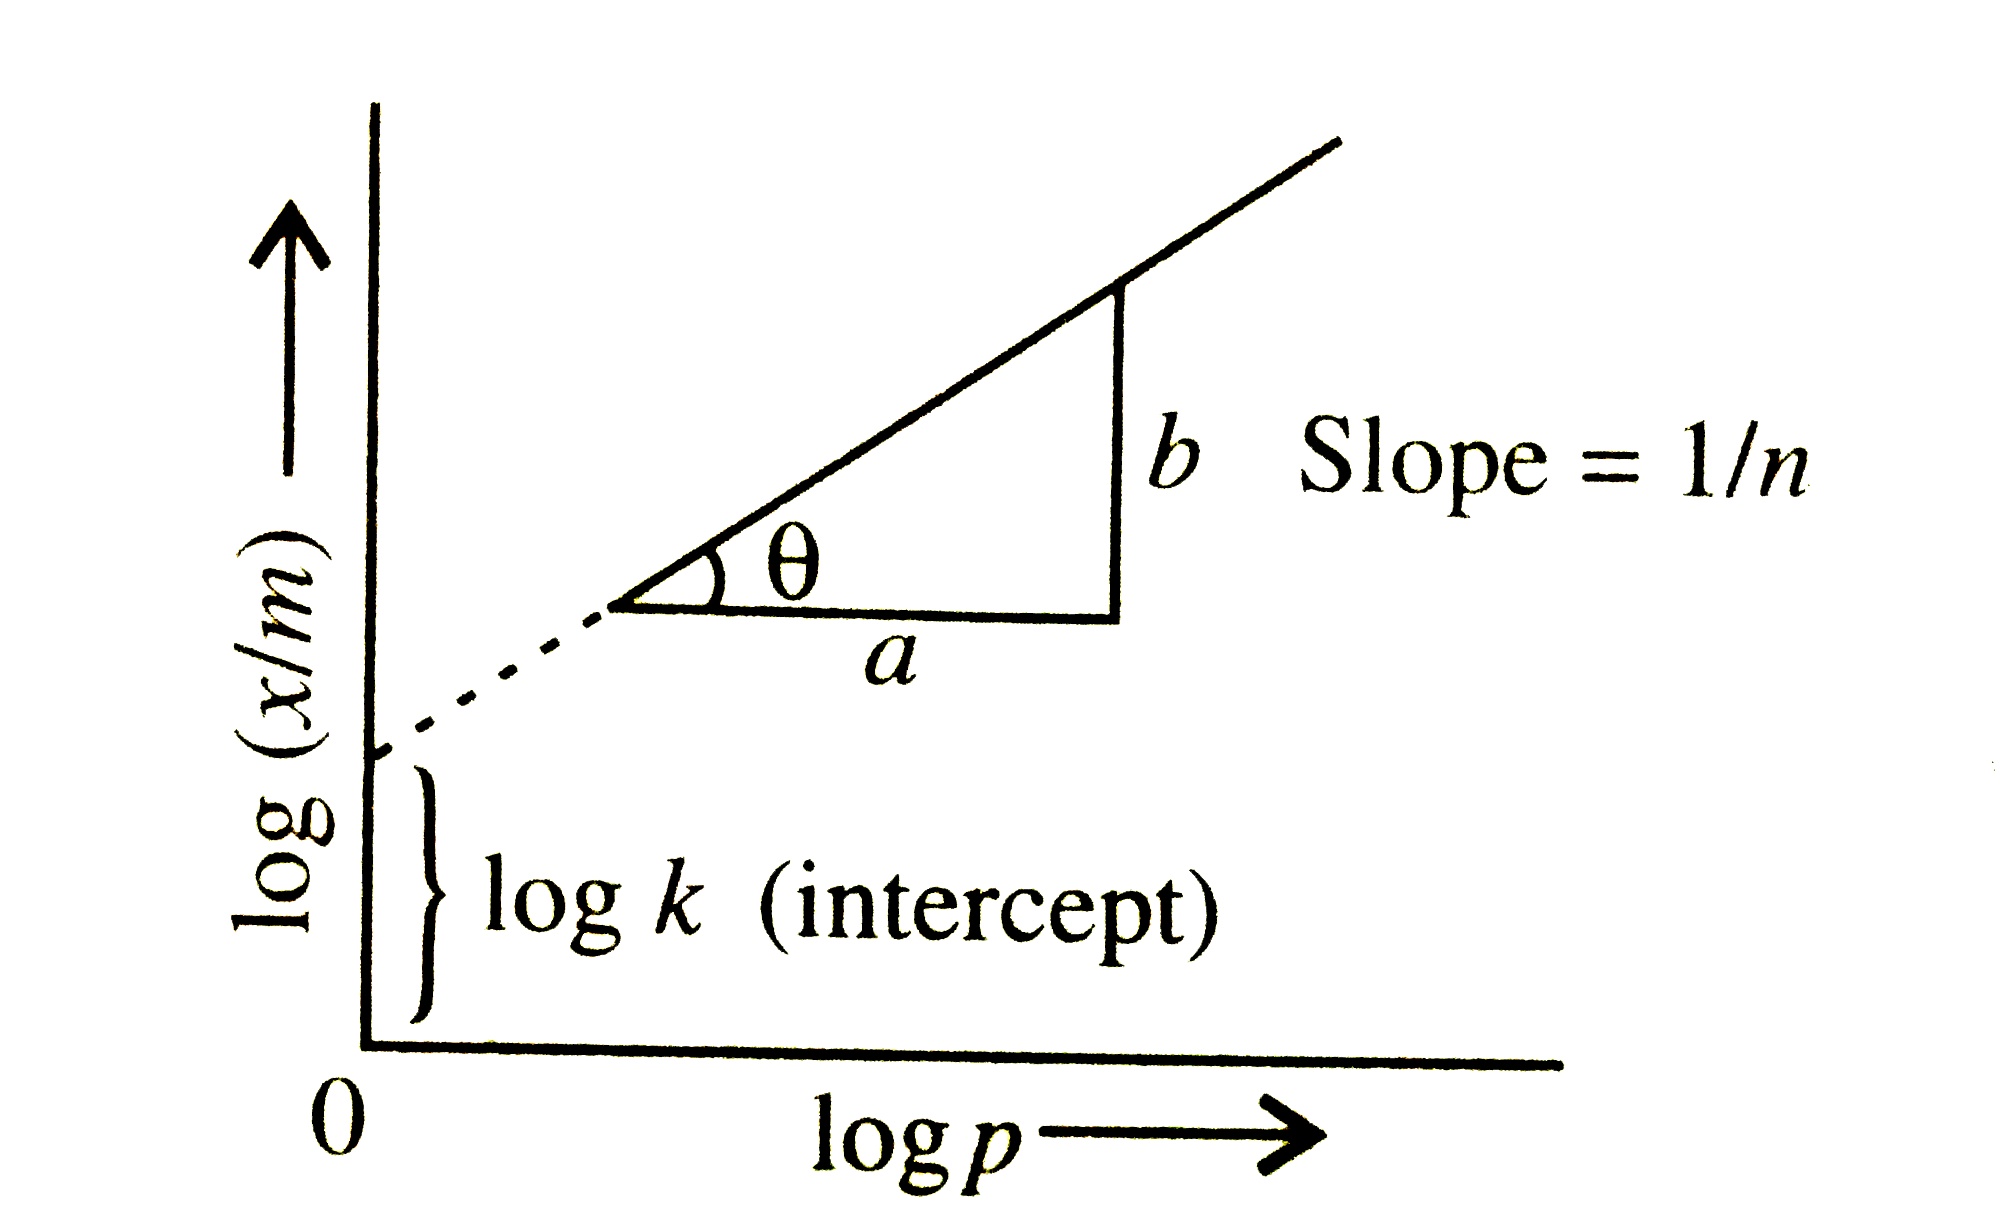
By plotting log x/m on y-axis and log P on x-axis we s hould get
(a) 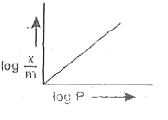
(b) 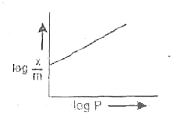
(c) 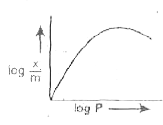
(d) 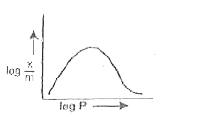
The correct Answer is:B
To solve the question, we need to analyze the relationship between the variables involved in the Freundlich isotherm equation and derive the nature of the graph when plotting log(x/m) against log(P).
1. Understand the Freundlich Isotherm Equation:
The Freundlich isotherm can be expressed as:
xm=k⋅P1n
where:
- x = mass of adsorbate
- m = mass of adsorbent
- P = pressure of the gas
- k and n = constants (with n>1)
2. Take the Logarithm of Both Sides:
We can take the logarithm of both sides of the equation:
log(xm)=log(k)+1nlog(P)
3. Rearranging the Equation:
Rearranging the equation gives us:
log(xm)=log(k)+1nlog(P)
This can be rewritten in the form of a linear equation:
y=mx+c
where:
- y=log(xm)
- x=log(P)
- m=1n (slope)
- c=log(k) (y-intercept)
4. Identify the Nature of the Graph:
The equation y=1nx+log(k) indicates that when we plot log(xm) on the y-axis and log(P) on the x-axis, we will get a straight line. The slope of this line will be 1n, and the y-intercept will be log(k).
Conclusion:
By plotting log(xm) on the y-axis and log(P) on the x-axis, we should get a straight line graph, confirming the linear relationship derived from the Freundlich isotherm equation.
The Freundlich isotherm can be expressed as:
xm=k⋅P1n
where:
- x = mass of adsorbate
- m = mass of adsorbent
- P = pressure of the gas
- k and n = constants (with n>1)
We can take the logarithm of both sides of the equation:
log(xm)=log(k)+1nlog(P)
Rearranging the equation gives us:
log(xm)=log(k)+1nlog(P)
This can be rewritten in the form of a linear equation:
y=mx+c
where:
- y=log(xm)
- x=log(P)
- m=1n (slope)
- c=log(k) (y-intercept)
The equation y=1nx+log(k) indicates that when we plot log(xm) on the y-axis and log(P) on the x-axis, we will get a straight line. The slope of this line will be 1n, and the y-intercept will be log(k).
By plotting log(xm) on the y-axis and log(P) on the x-axis, we should get a straight line graph, confirming the linear relationship derived from the Freundlich isotherm equation.
Topper's Solved these Questions
- SURFACE CHEMISTRY BOOK - AAKASH INSTITUTE ENGLISHCHAPTER - SURFACE CHEMISTRY EXERCISE - Assignment Section - B (Previous year questions)
14 Videos
- SURFACE CHEMISTRY BOOK - AAKASH INSTITUTE ENGLISHCHAPTER - SURFACE CHEMISTRY EXERCISE - Assignment Section - B (Questions asked prior to medical Ent . Exams . 2005)
10 Videos
- SURFACE CHEMISTRY BOOK - AAKASH INSTITUTE ENGLISHCHAPTER - SURFACE CHEMISTRY EXERCISE - Exercise
20 Videos
- STRUCTURE OF ATOM BOOK - AAKASH INSTITUTE ENGLISHCHAPTER - STRUCTURE OF ATOM EXERCISE - ASSIGNMENT ( SECTION -J) Aakash Challengers Questions
12 Videos
- TEST 1BOOK - AAKASH INSTITUTE ENGLISHCHAPTER - TEST 1EXERCISE - EXAMPLE
134 Videos
Similar Questions
For freundlich adsorption isotherm, a plot of log ( x/m) ( y - axis ) and log p (x-axis) gives a straight line . The intercept and slope for the line is 0.4771 and 2, respectively . The mass of gas , adsorbed per gram of adsorbent if the intital pressure is 0.04 atm , is ________ ×10−4 g.
(log 3=0.4771).
View SolutionA graph is plotted between PVm along Y-axis and P along X-axis whre Vm is the molar volume of a real gas Find the intercept along Y-axis .
View SolutionWhen a graph is plotted between log x/m and log p, it is straight line with an angle 45∘ and intercept 0.3010 on y− axis . If initial pressure is 0.3 atm, what wil be the amount of gas adsorbed per gm of adsorbent :
View SolutionWhen a graph is plotted between log x/m and log p, it is straight line with an angle 45∘ and intercept 0.6020 on y-axis.if initial pressure is 0.3 atm, what will be the amount of gas adsorbed per gram of adsorbent :
View SolutionIn a graph of population, on x-axis time and on y-axis population is plotted. A parallel line to x-axis shows:
View SolutionA plot of log (xm) against log P for the adsorption of a gas on a sloid gives a straight a straight line with slope equal to :
View SolutionWe plot the graph having temperature in ∘C on x - axis and in ∘F on y - axis. If the graph is straight line, then the correct statement is
View SolutionA graph is plotted between log (x/m) and log p according to the equation xmkp1/n
Which is the following statements about his graph is not correct ?
View SolutionIf x gram of gas is adsobed by m gram of adsorbent at pressure P the plot of log xm versus log P is linear .the slope of the plot is :
(n and k are constant and n > 1)
View SolutionGraph between log x/m and log P is a straight line at angle of 45∘ with intercept 0.4771 on y-axis. Calculate the amount of gas adsorbed in gram per gram of adsorbent when pressure is 3 atm.
View Solution
