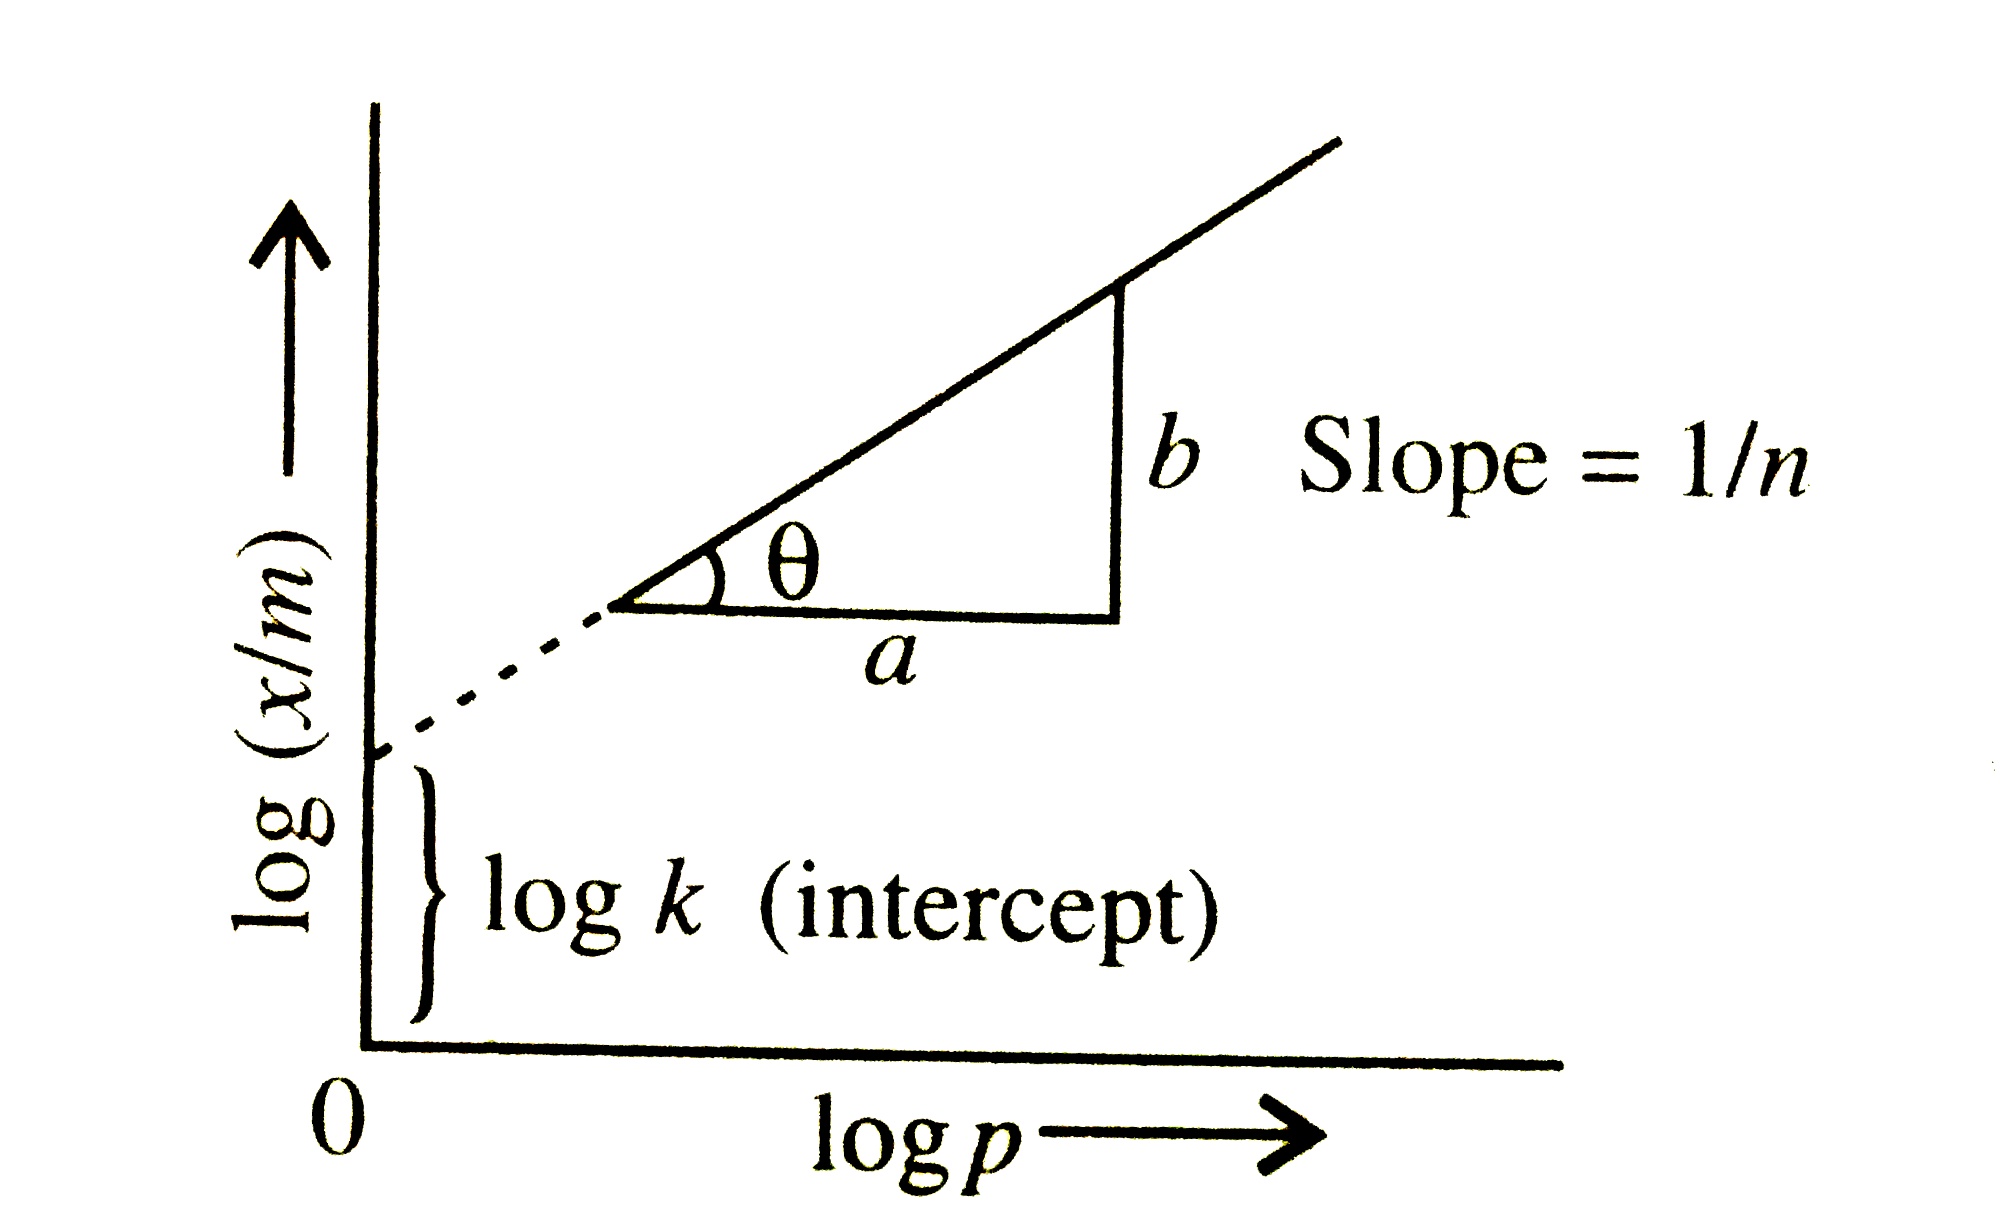
A graph is plotted between log (x/m) and log p according to the equation xmkp1/n

Which is the following statements about his graph is not correct ?
The figure shows Freundlich adsorption isotherm
The figure shows Langmuir adsorption isotherm
The adsorption varies directly with pressure
The factor 1/n can have values between 0 and 1.
The correct Answer is:B
Step by step video & image solution for A graph is plotted between log (x/m) and log p according to the equation (x)/(m) kp^(1//n) Which is the following statements about his graph is not correct ? by Chemistry experts to help you in doubts & scoring excellent marks in Class 12 exams.
Updated on:21/07/2023Topper's Solved these Questions
- SURFACE CHEMISTRYBOOK - NCERT FINGERTPS ENGLISHCHAPTER - SURFACE CHEMISTRYEXERCISE - HOTS
7 Videos
- SURFACE CHEMISTRYBOOK - NCERT FINGERTPS ENGLISHCHAPTER - SURFACE CHEMISTRYEXERCISE - NCERT EXEMPLAR PROBLEMS
25 Videos
- SOLUTIONS BOOK - NCERT FINGERTPS ENGLISHCHAPTER - SOLUTIONS EXERCISE - Assertion And Reason
15 Videos
- THE D- AND F- BLOCK ELEMENTS BOOK - NCERT FINGERTPS ENGLISHCHAPTER - THE D- AND F- BLOCK ELEMENTS EXERCISE - Assertion And Reason
15 Videos
Similar Questions
Which of the following graph between (x/m) vs P is correct?
View SolutionA graph plot between xm and pressure The value of n at point A is
View SolutionWhat is the type of graph between log P and log V at constant temperature?
View SolutionIf a graph is plotted between log(a−x) and t, the slope of the straight line is equal to −0.03. The specific reaction rate will be
View SolutionA graph plotted between logk versus 1/T for calculating activation energy is shown by
View SolutionFor a linear plot of log (x/m) versus log [ in a Freundlich adsorption isotherm, which of the following statements is correct ? (k and n are consists)
View SolutionWhen a graph is plotted between log x/m and log p, it is straight line with an angle 45∘ and intercept 0.3010 on y− axis . If initial pressure is 0.3 atm, what wil be the amount of gas adsorbed per gm of adsorbent :
View SolutionPlot a graph for the equation y=−x2+4x−1.
View SolutionBy plotting log x/m on y-axis and log P on x-axis we s hould get
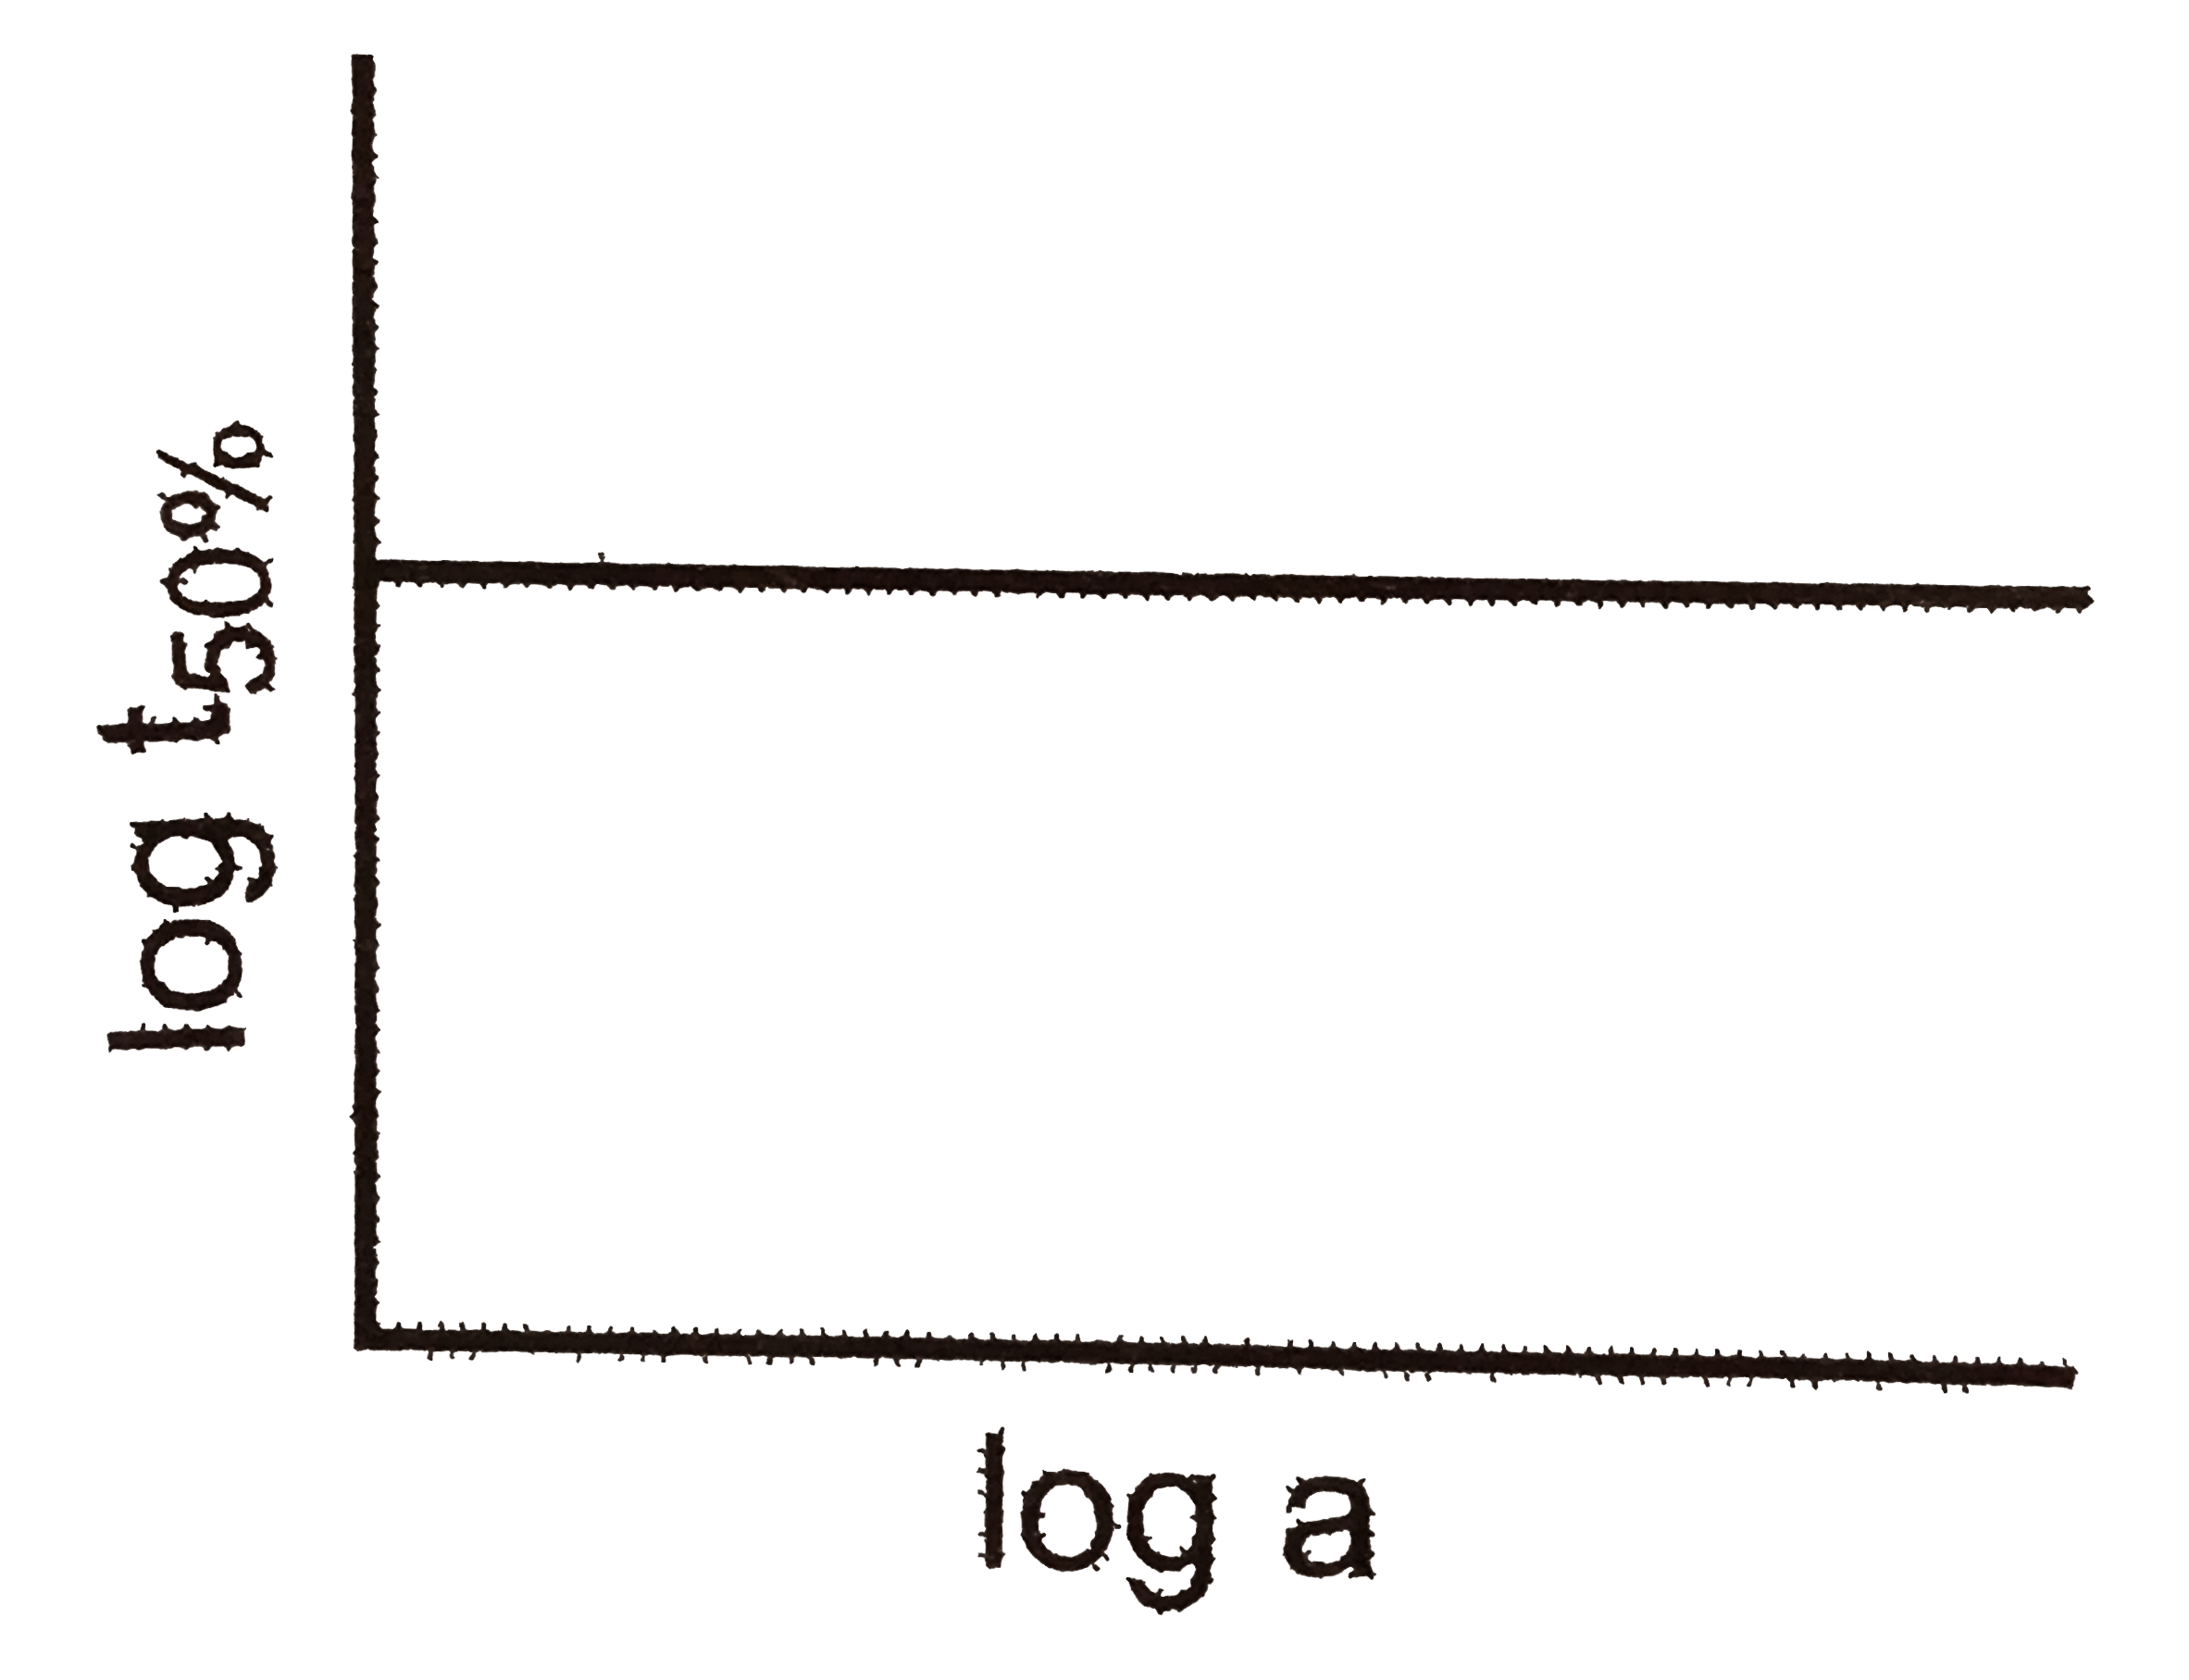
View SolutionA graph plotted between log t50% vs log concentration is a straight line. What conclusion can you draw from this graph?

View Solution
