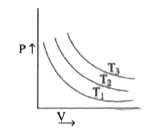
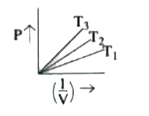
The correct graph and values of temperature in them is given as

&T1>T2
&T1<T2
&T1>T2
&T1<T2
Step by step video & image solution for The correct graph and values of temperature in them is given as by Chemistry experts to help you in doubts & scoring excellent marks in Class 12 exams.
Updated on:21/07/2023Topper's Solved these Questions
- STATES OF MATTERBOOK - AAKASH INSTITUTE ENGLISHCHAPTER - STATES OF MATTEREXERCISE - TRY YOURSELF
34 Videos
- STATES OF MATTERBOOK - AAKASH INSTITUTE ENGLISHCHAPTER - STATES OF MATTEREXERCISE - ASSIGNMENT (SECTION-A)
50 Videos
- STATES OF MATTERBOOK - AAKASH INSTITUTE ENGLISHCHAPTER - STATES OF MATTEREXERCISE - ASSIGNMENT (SECTION-D)
14 Videos
- SOME BASIC CONCEPTS OF CHEMISTRY BOOK - AAKASH INSTITUTE ENGLISHCHAPTER - SOME BASIC CONCEPTS OF CHEMISTRY EXERCISE - ASSIGNMENT SECTION J (Aakash Challenges Questions)
10 Videos
- STRUCTURE OF ATOMBOOK - AAKASH INSTITUTE ENGLISHCHAPTER - STRUCTURE OF ATOMEXERCISE - ASSIGNMENT (SECTION -D) Assertion-Reason Type Questions
15 Videos
Similar Questions
Which is correct graph :
View SolutionChoose the correct answer :
Volume-temperature relationship is given by
View SolutionThe correct graph between the temperature of a hot body kept in cooler surrounding and time is (Assume newton's law of cooling)
View SolutionOut of the given values of temperature, which one is the highest?
View SolutionFrom the graph the correct order of temperature is:

View SolutionWhich is/are correct graph ?
View SolutionFrom the graph the correct order of temperatures is:

View SolutionThe value of critical temperature in terms of van der Waals' constants a and b is given by
View SolutionThe value of critical temperature in terms of van der Waals' constants a and b is given by
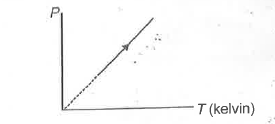
View SolutionThe graph of pressure and temperature for an ideal gas is as shown in figure. The given process is

View Solution
