The force versus position (F-x) graph of a particle of mass 2 kg is shown in the figure. If at x = 0 velocity of particle is 2 m/s then velocity of the particle at x = 8 m will be 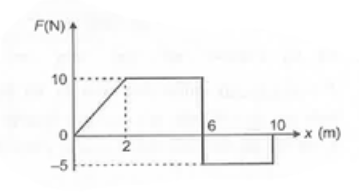
2√11ms
√22ms
2√22ms
4√11ms
The correct Answer is:D
Step by step video & image solution for The force versus position (F-x) graph of a particle of mass 2 kg is shown in the figure. If at x = 0 velocity of particle is 2 m/s then velocity of the particle at x = 8 m will be by Physics experts to help you in doubts & scoring excellent marks in Class 12 exams.
Updated on:21/07/2023Similar Questions
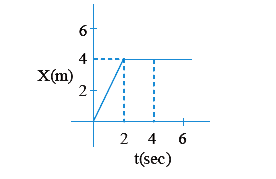
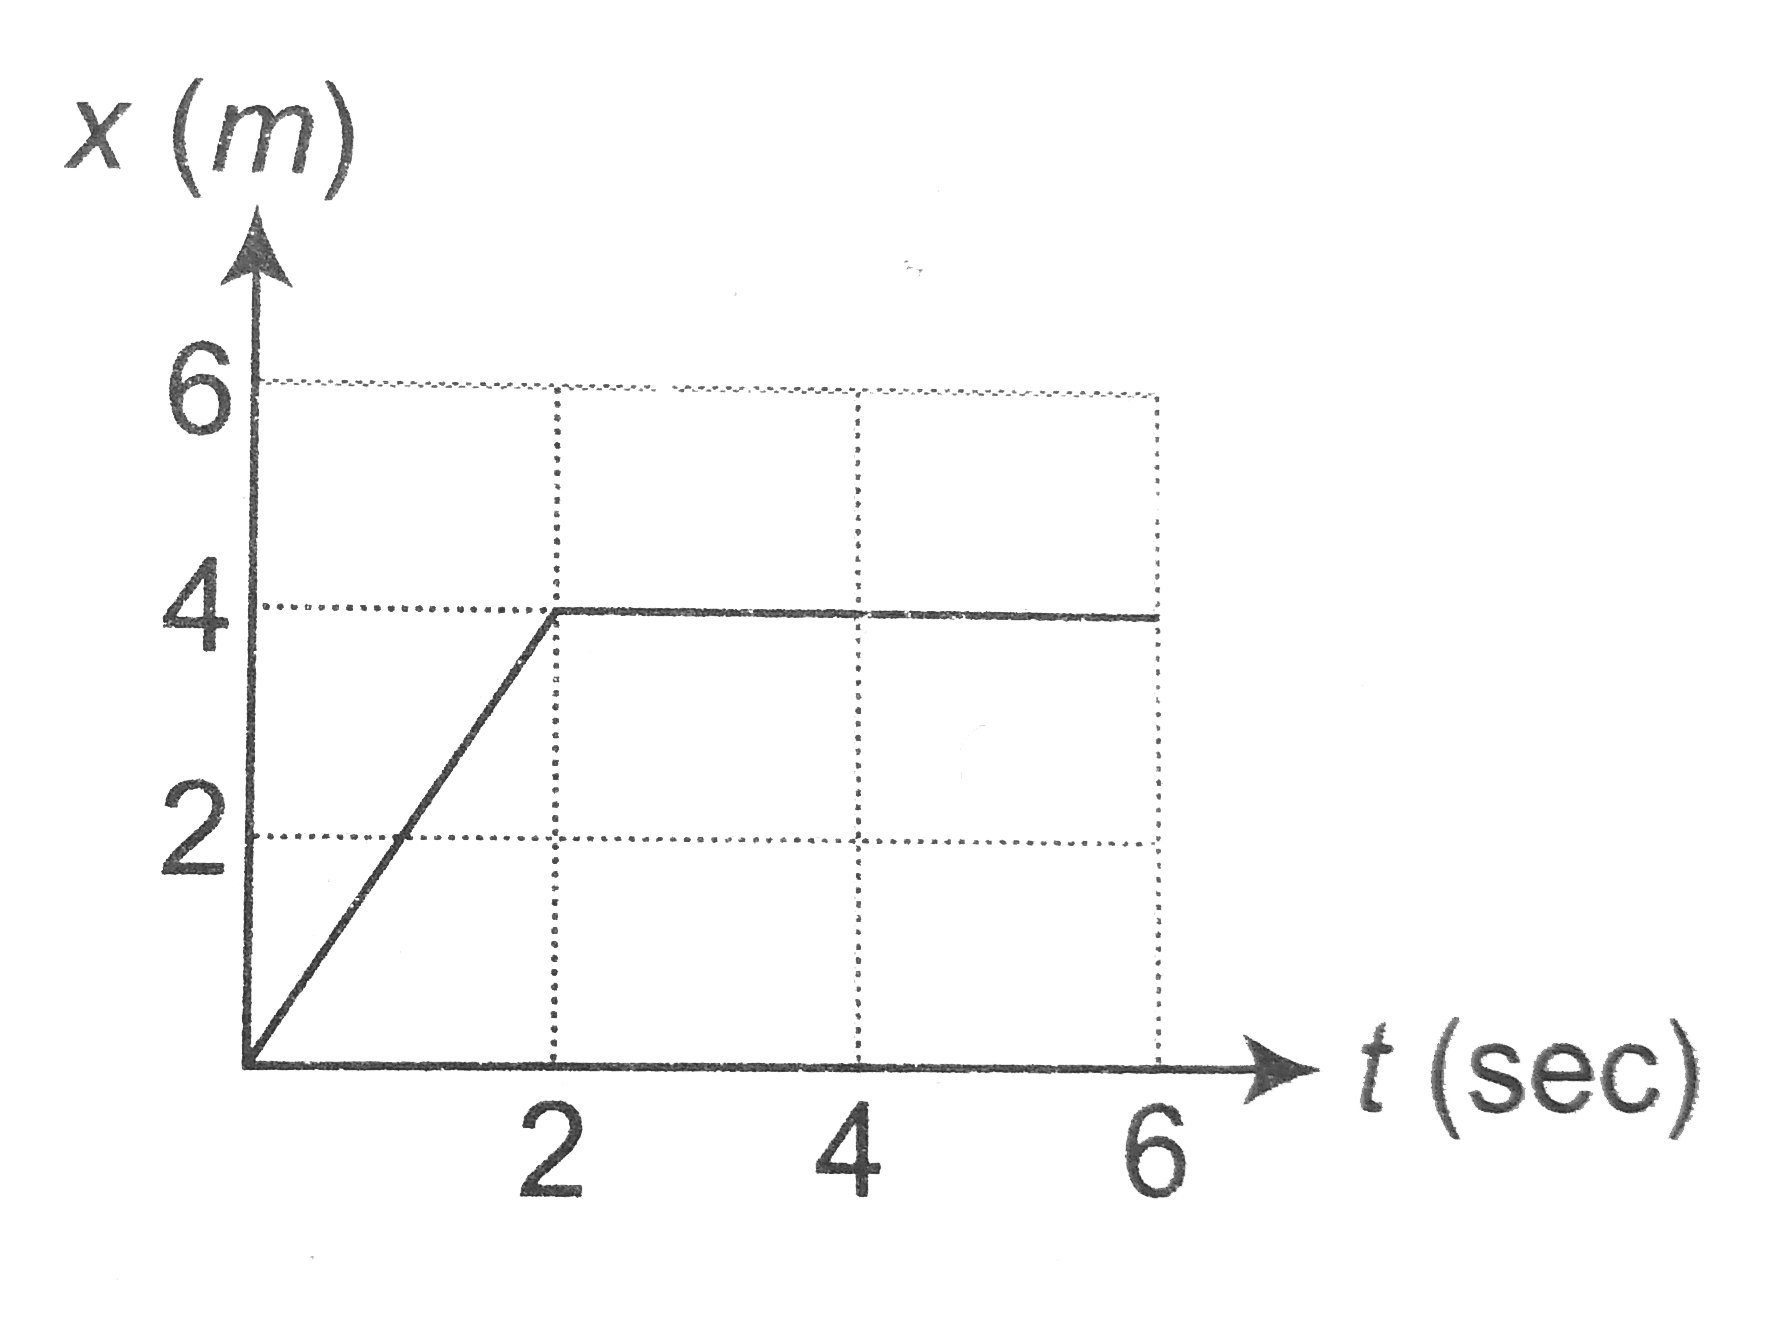
In the figure, the position time graph of a particle of mass 0.1 kg is shown. The impulse at t=2 second is :
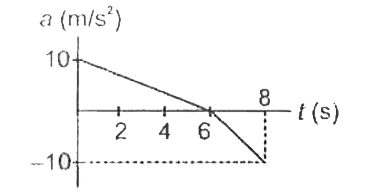
View SolutionThe acceleration - time graph for a particle moving along x - axis is shown in figure, If the initial velocity of particle is −5m/s, the velocity at t = 8 s is
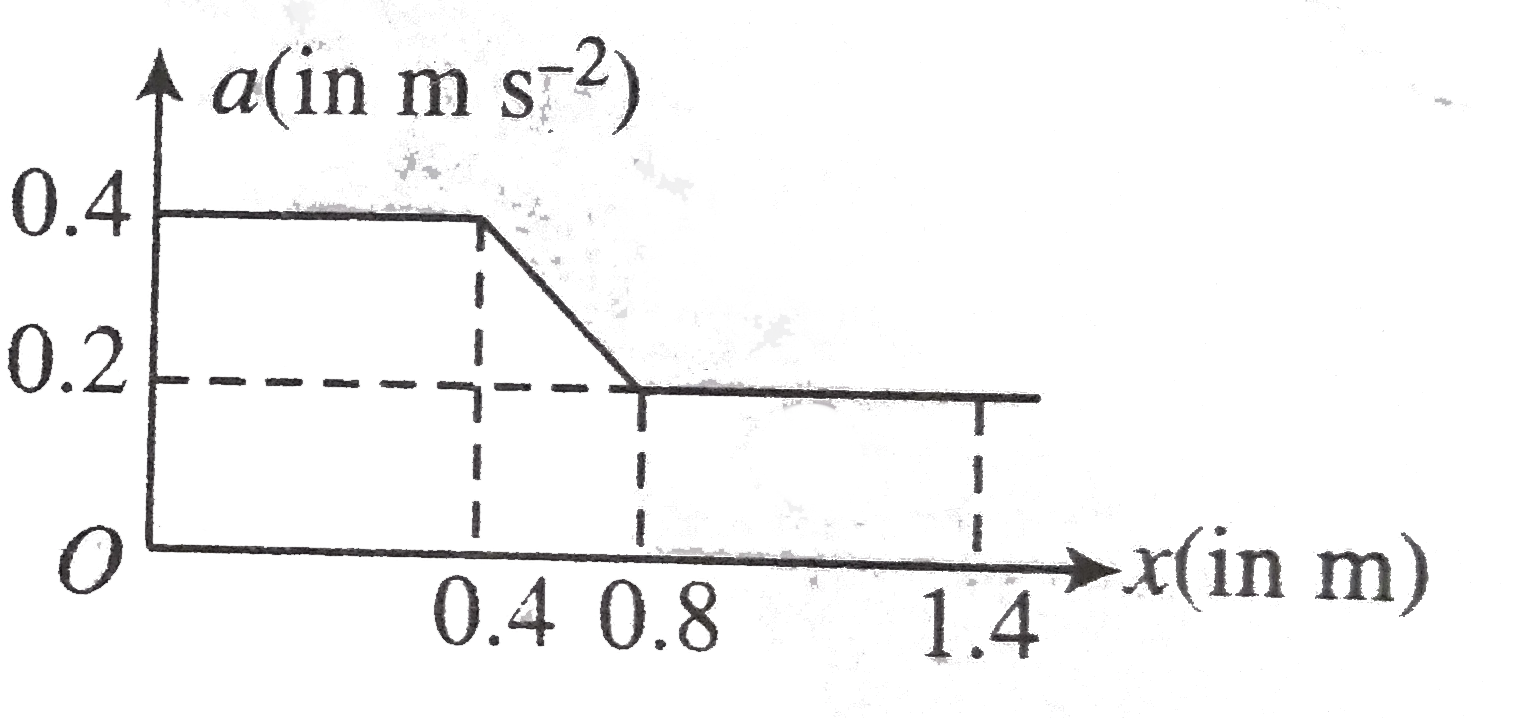
View SolutionThe acceleration of a particle which moves along the positive x-axis varies with its position as shown in figure. If the velocity of the particle is 0.8ms−1 at x = 0, then velocity of the particle at x=1.4m is (∈ms−1).
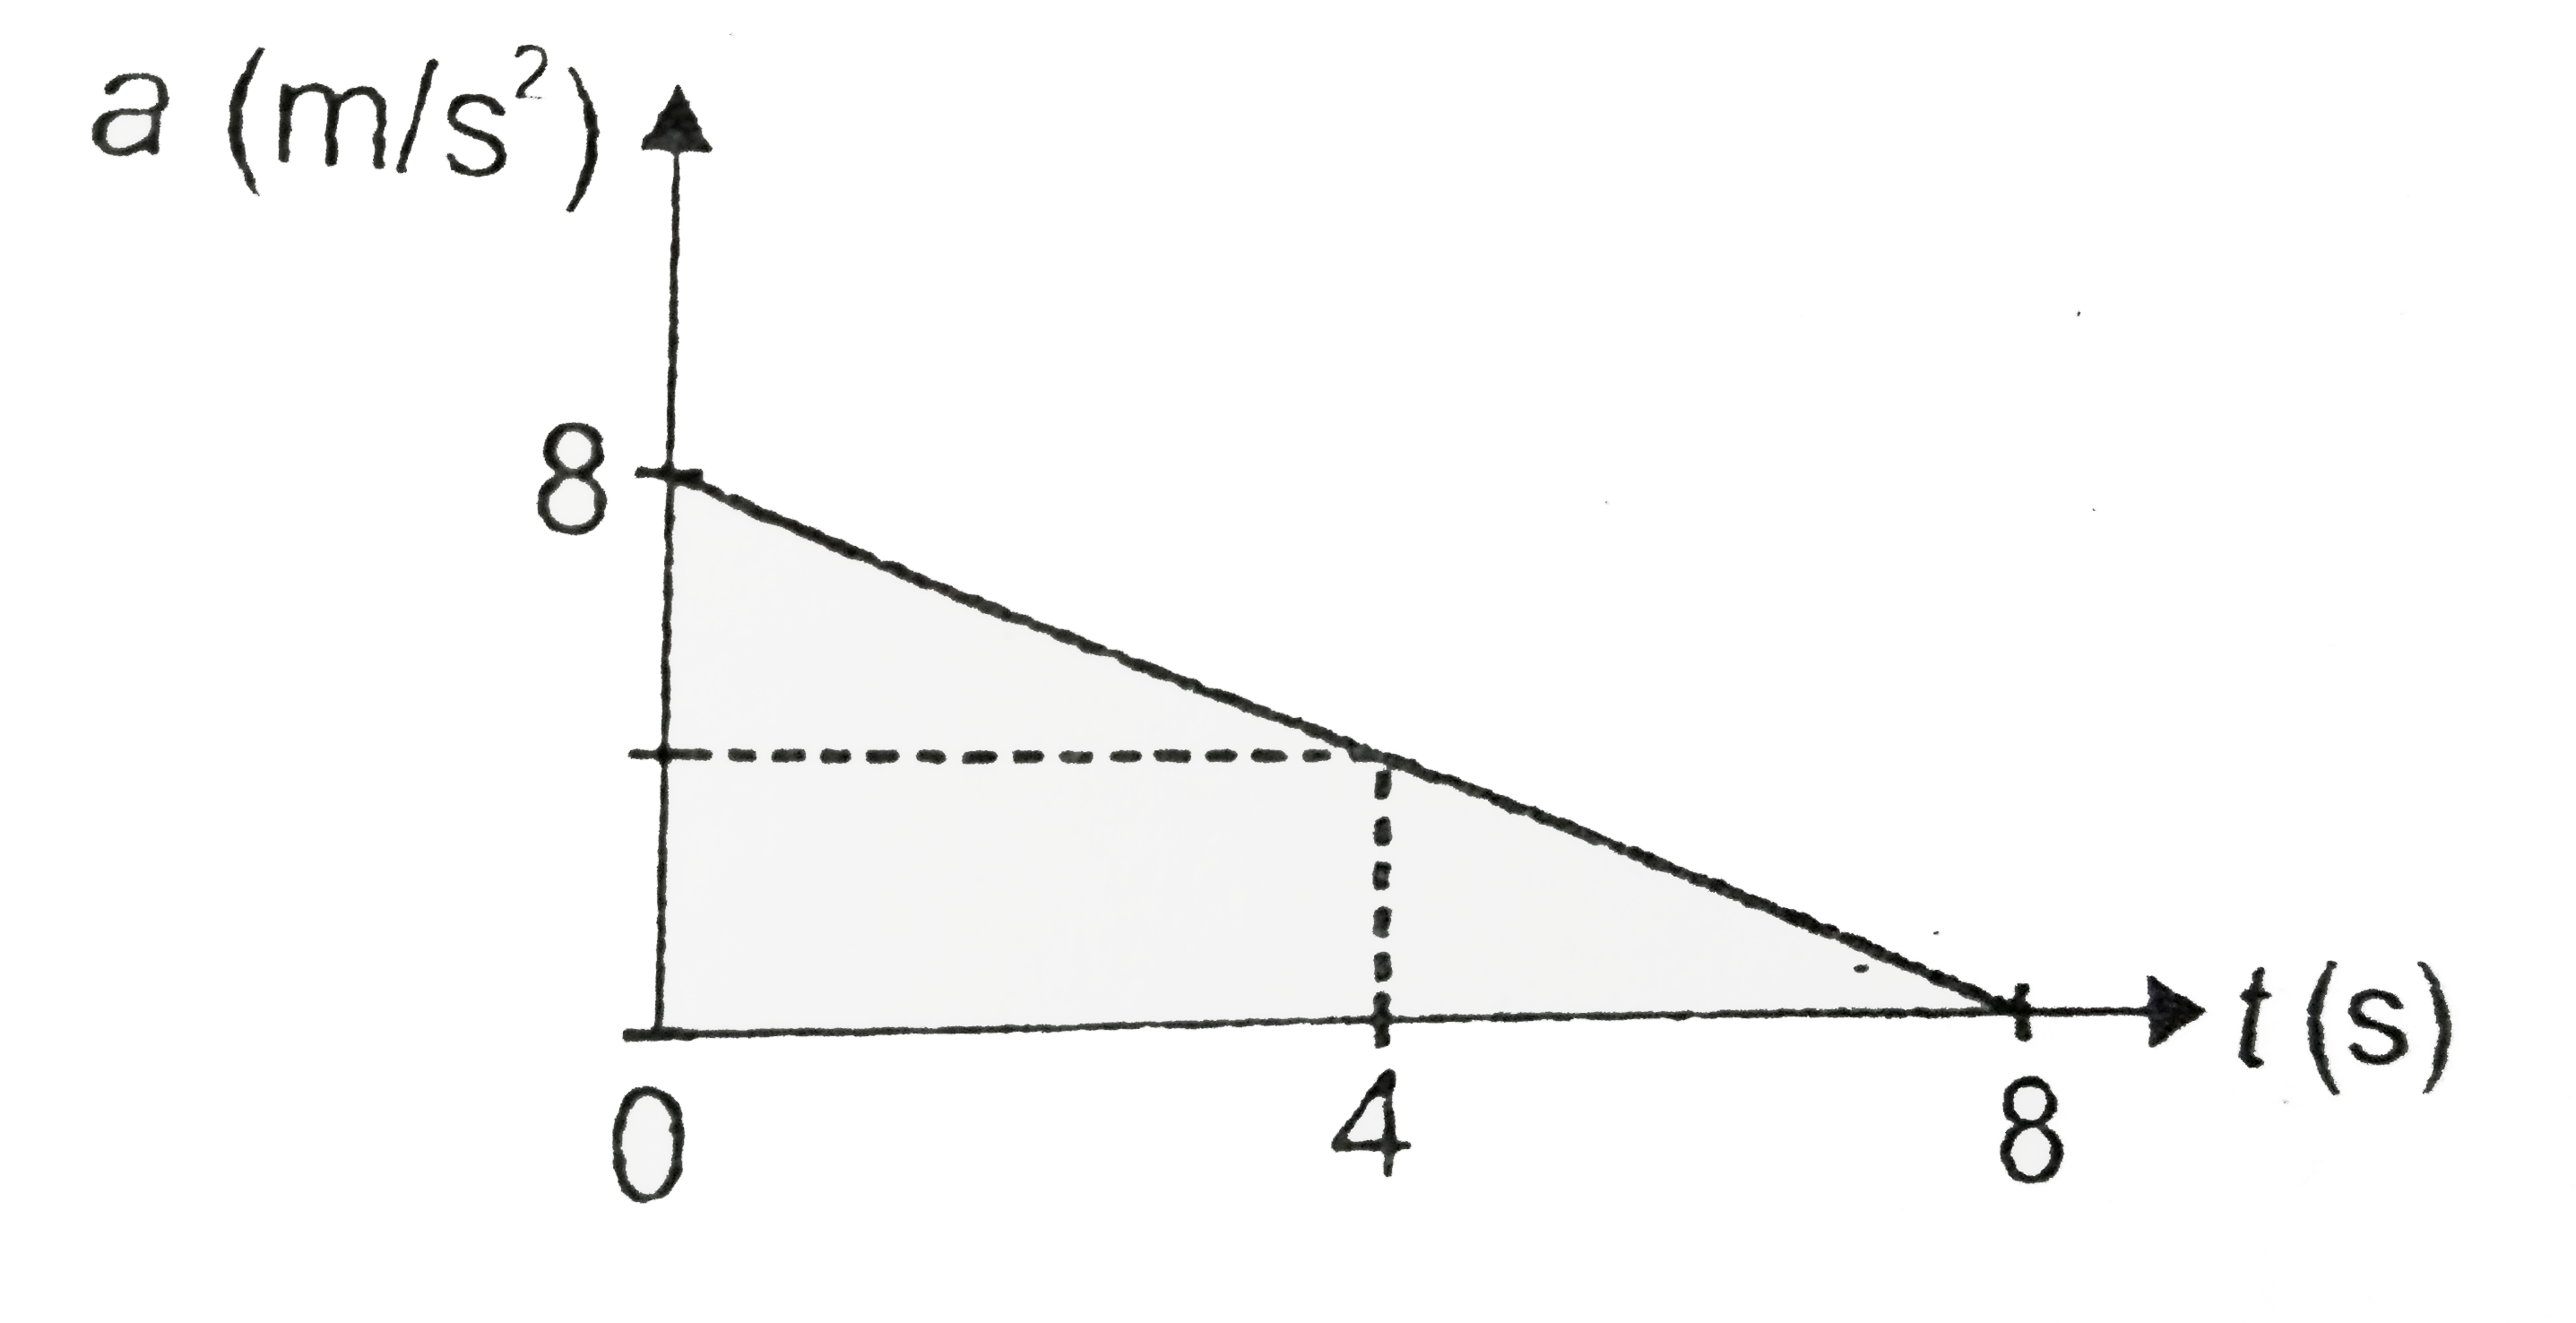
View SolutionThe acceleration-time graph of a particle moving along x-axis is shown in the figure. If the particle starts with velocity 3 m/s at t = 0, find the velocity of particle at t = 4 s.
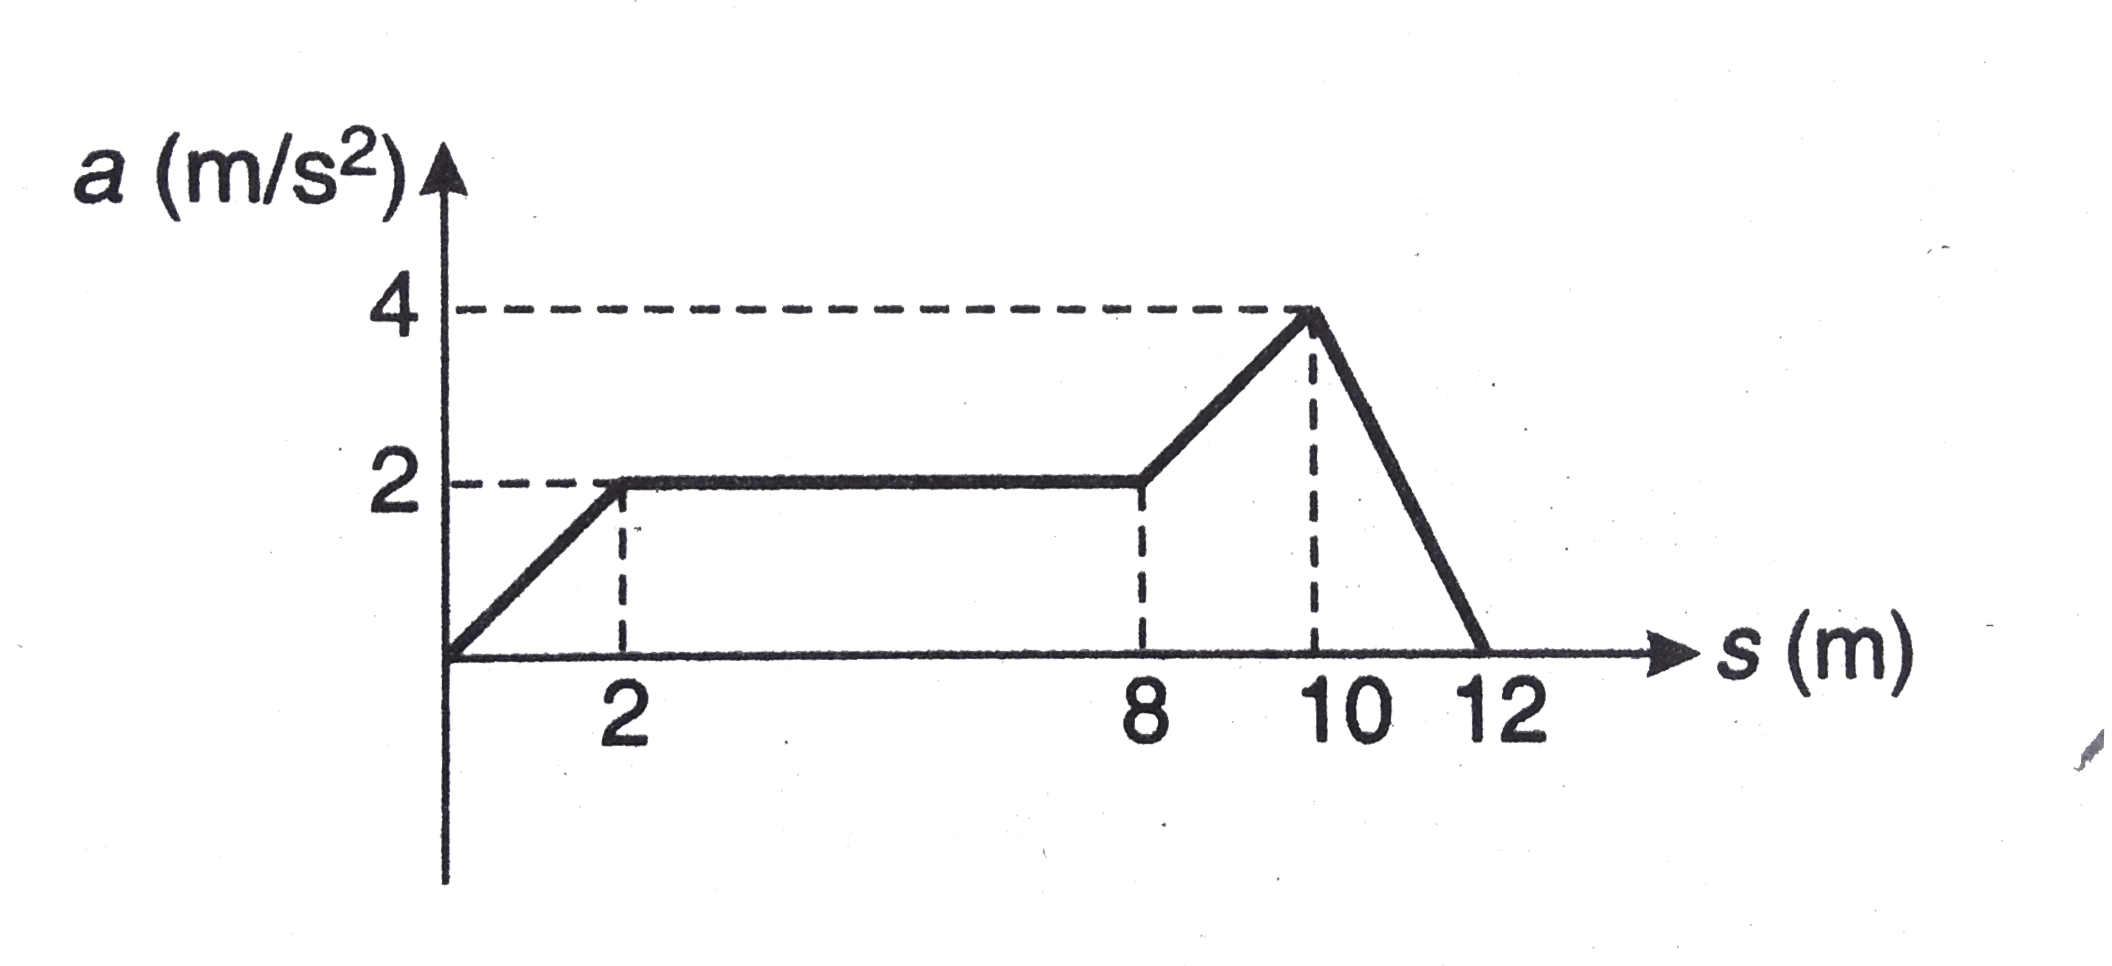
View SolutionThe acceleration-displacement graph of a particle moving in a straight line is as shown in figure, initial velocity of particle is zero. Find the velocity of the particle when displacement of the particle is s=12m.
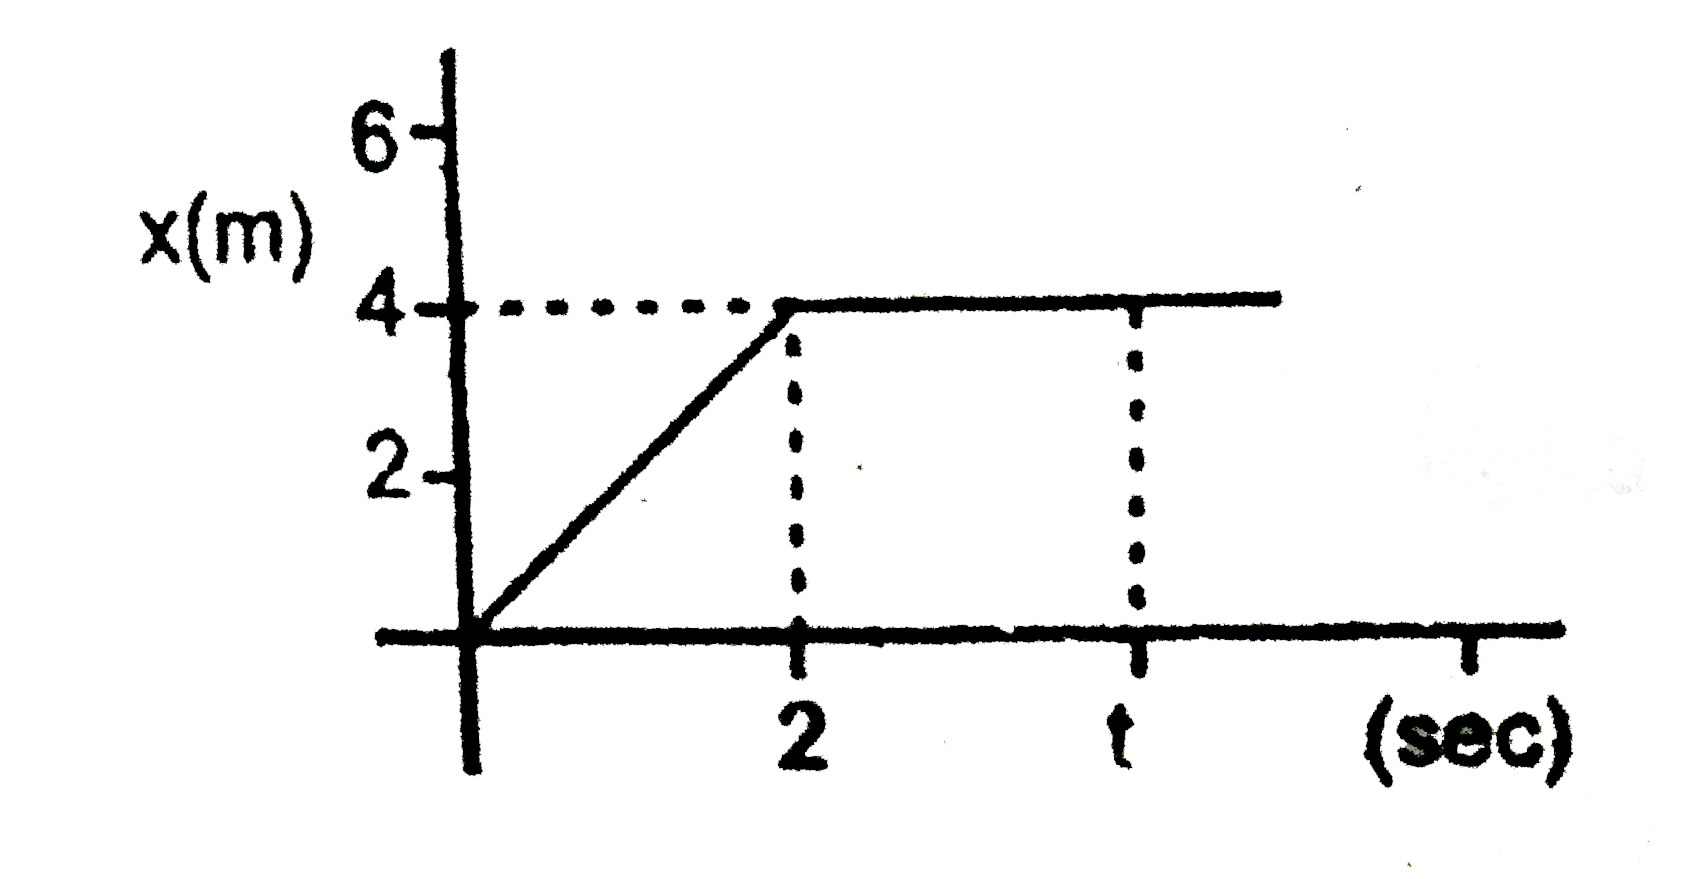
View SolutionIn the figure given below, the position time graph of a particle of mass 0.1kg is shown. The impulse at t=2 sec is
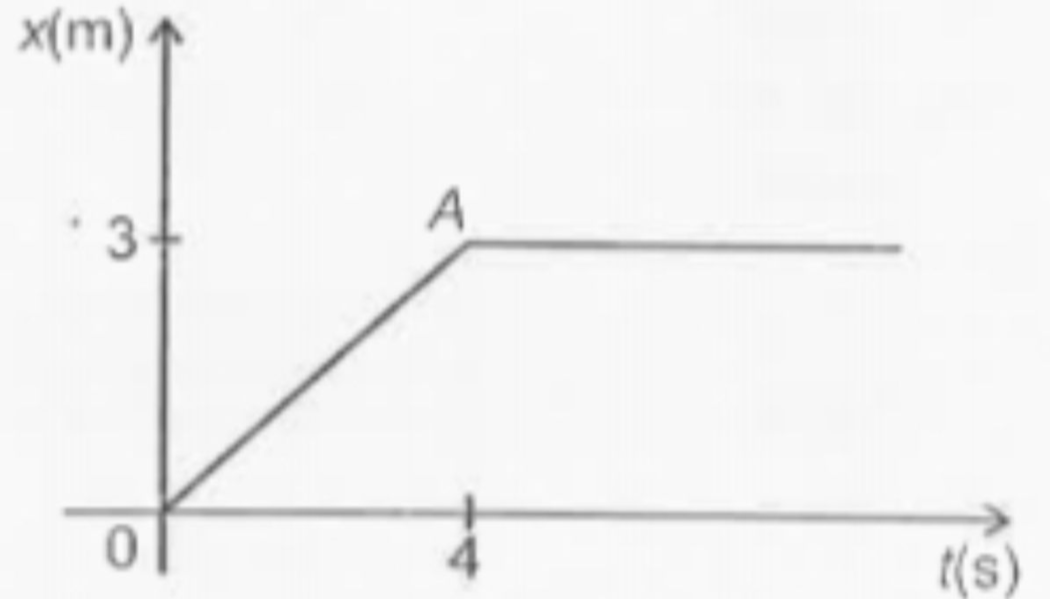
View SolutionThe figure shows the position time graph of a particle of mass 40 kg. What is the force acting on the particle of 0<t<4 s
View SolutionIn the figure given below, the position-time graph of a particle of mass 0.1kg is shown. The impuslse at t=2 sec is
View SolutionThe acceleration-time graph of a particle moving in a straight line is as shown in figure. The velocity of the particle at time t=0 is 2m/s. The velocity after 2 seconds will be
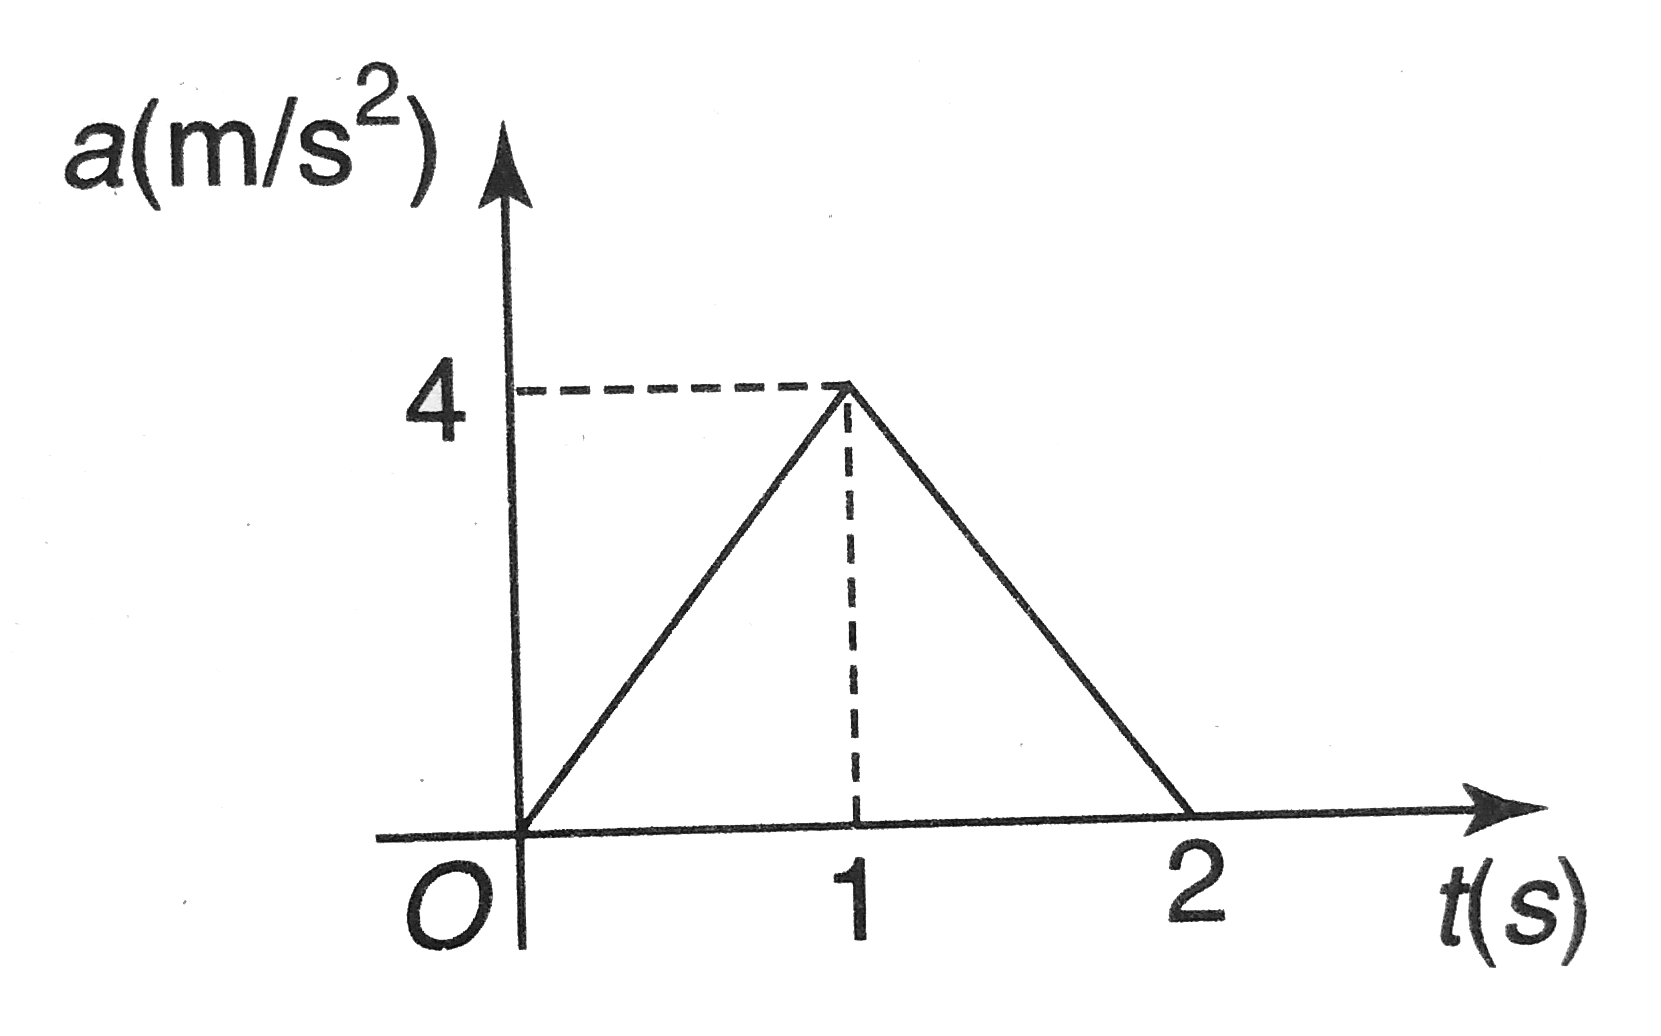
View SolutionThe acceleration-time graph of a particle moving in a straight line is as shown in figure. The velocity of the particle at time t=0 is 2m/s. The velocity after 2 seconds will be

View Solution