which of the following volume temperature (V−T) graph represent carnot engine cycle ABCDA?
_PHY_E05_036_Q01.png)
_PHY_E05_036_Q02.png)
_PHY_E05_036_Q03.png)
_PHY_E05_036_Q04.png)
To determine which volume-temperature (V-T) graph represents the Carnot engine cycle ABCDA, we need to analyze the processes involved in the cycle step by step.
1. Understanding the Carnot Cycle:
The Carnot cycle consists of four processes:
- Isothermal Expansion (A to B)
- Adiabatic Expansion (B to C)
- Isothermal Compression (C to D)
- Adiabatic Compression (D to A)
2. Process A to B - Isothermal Expansion:
During this process, the gas absorbs heat at a constant high temperature (T_H). The volume increases while the temperature remains constant. On a V-T graph, this will appear as a horizontal line moving from point A to point B.
3. Process B to C - Adiabatic Expansion:
In this phase, the gas expands without heat exchange (adiabatically). The temperature decreases while the volume increases. On the V-T graph, this will be represented as a downward slope from point B to point C.
4. Process C to D - Isothermal Compression:
Here, the gas releases heat at a constant low temperature (T_C). The volume decreases while the temperature remains constant. On the V-T graph, this will appear as another horizontal line moving from point C to point D.
5. Process D to A - Adiabatic Compression:
In this final phase, the gas is compressed adiabatically, meaning no heat is exchanged. The temperature increases while the volume decreases. On the V-T graph, this will be represented as an upward slope from point D to point A.
6. Combining the Processes:
Putting all these processes together, the V-T graph for the Carnot cycle will consist of:
- A horizontal line from A to B (isothermal expansion)
- A downward slope from B to C (adiabatic expansion)
- A horizontal line from C to D (isothermal compression)
- An upward slope from D to A (adiabatic compression)
7. Identifying the Correct Graph:
We need to look for a graph that matches this description. The correct graph will have two horizontal lines (for isothermal processes) and two sloped lines (for adiabatic processes) that reflect the changes in volume and temperature as described.
Conclusion:
After analyzing the options, the correct volume-temperature graph representing the Carnot engine cycle ABCDA is the one that matches the described pattern of the four processes.
The Carnot cycle consists of four processes:
- Isothermal Expansion (A to B)
- Adiabatic Expansion (B to C)
- Isothermal Compression (C to D)
- Adiabatic Compression (D to A)
During this process, the gas absorbs heat at a constant high temperature (T_H). The volume increases while the temperature remains constant. On a V-T graph, this will appear as a horizontal line moving from point A to point B.
In this phase, the gas expands without heat exchange (adiabatically). The temperature decreases while the volume increases. On the V-T graph, this will be represented as a downward slope from point B to point C.
Here, the gas releases heat at a constant low temperature (T_C). The volume decreases while the temperature remains constant. On the V-T graph, this will appear as another horizontal line moving from point C to point D.
In this final phase, the gas is compressed adiabatically, meaning no heat is exchanged. The temperature increases while the volume decreases. On the V-T graph, this will be represented as an upward slope from point D to point A.
Putting all these processes together, the V-T graph for the Carnot cycle will consist of:
- A horizontal line from A to B (isothermal expansion)
- A downward slope from B to C (adiabatic expansion)
- A horizontal line from C to D (isothermal compression)
- An upward slope from D to A (adiabatic compression)
We need to look for a graph that matches this description. The correct graph will have two horizontal lines (for isothermal processes) and two sloped lines (for adiabatic processes) that reflect the changes in volume and temperature as described.
After analyzing the options, the correct volume-temperature graph representing the Carnot engine cycle ABCDA is the one that matches the described pattern of the four processes.
Similar Questions
Knowledge Check
Which of the following x-t graphs does not represent periodic motion?
A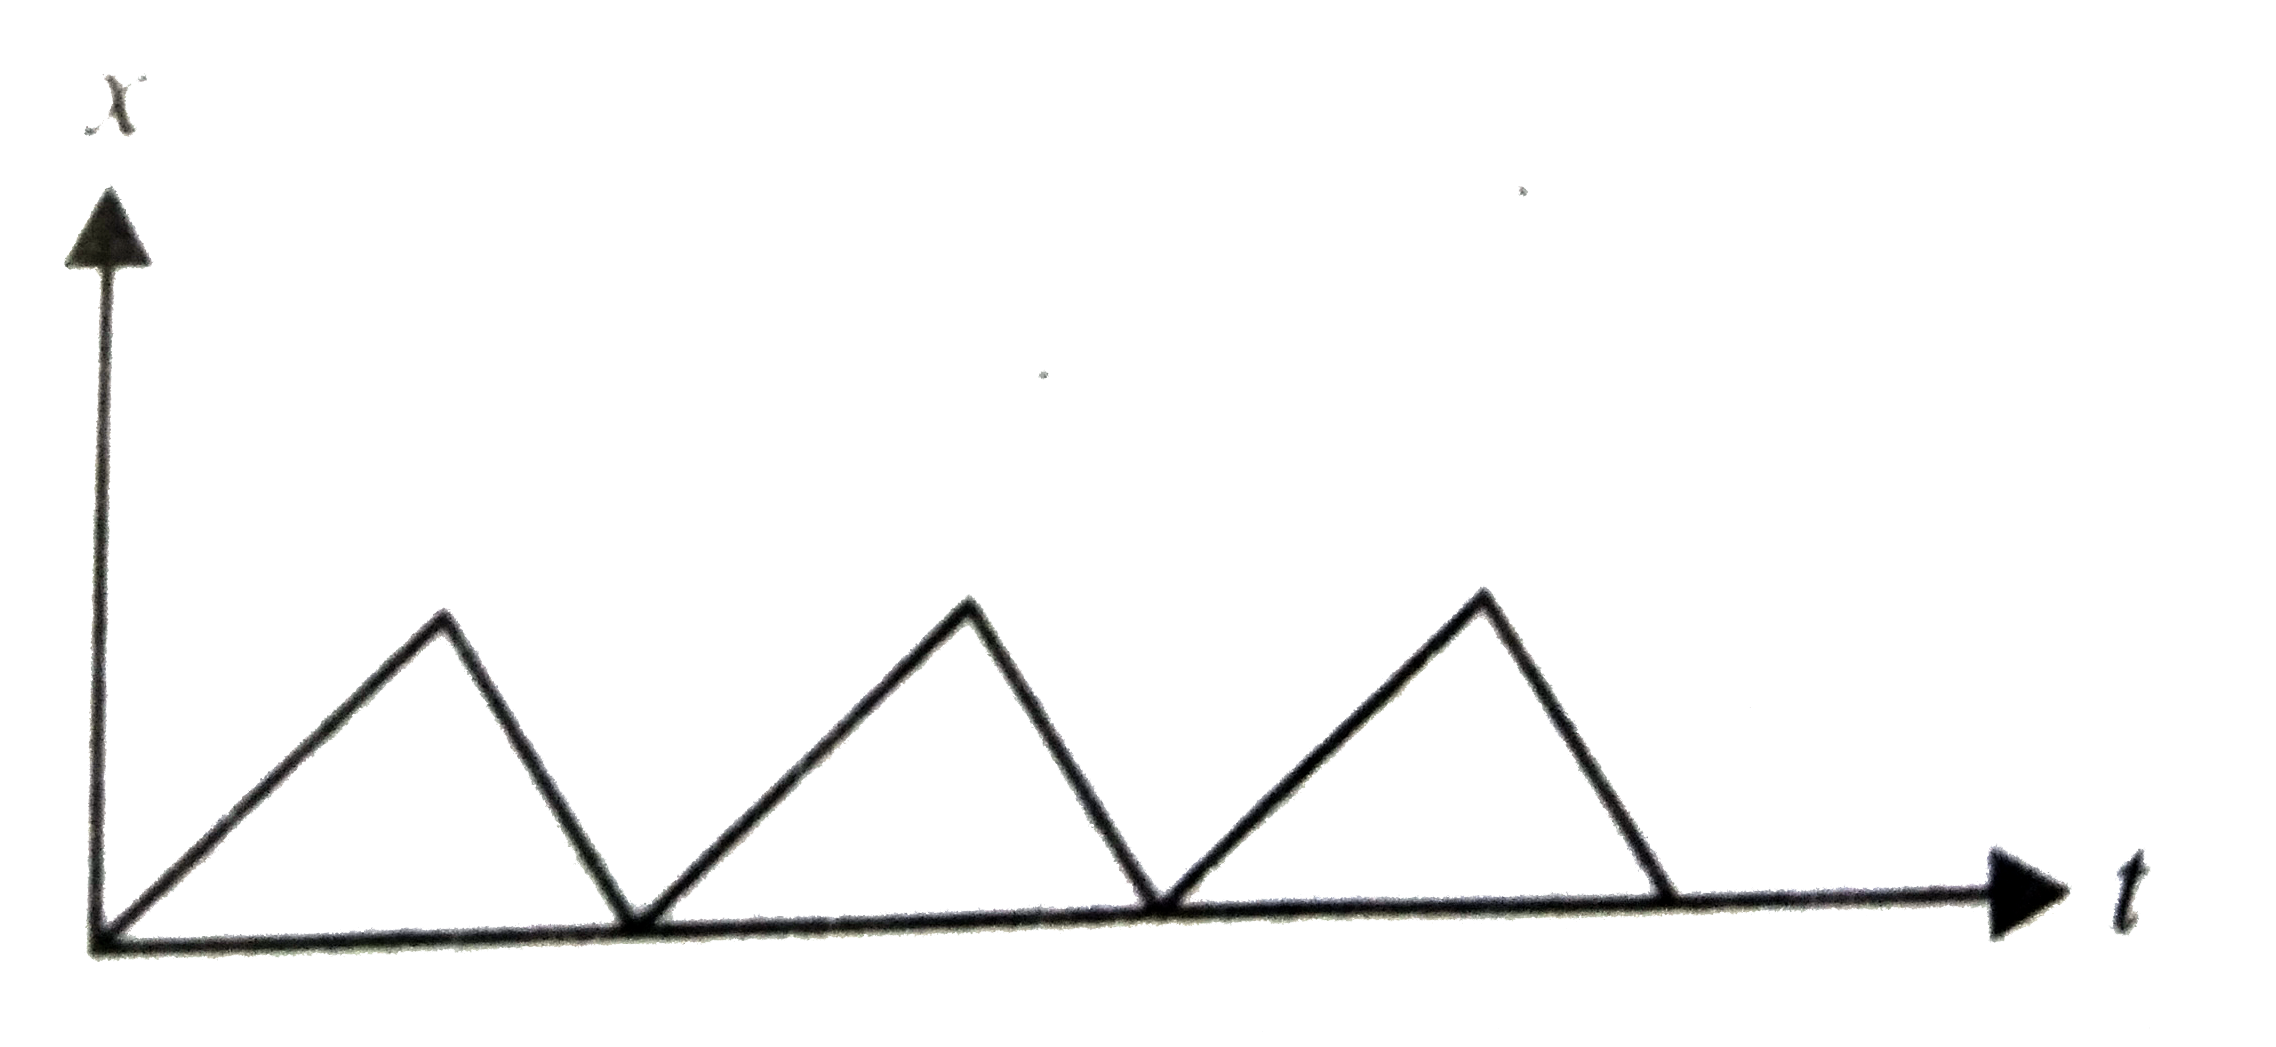 B
B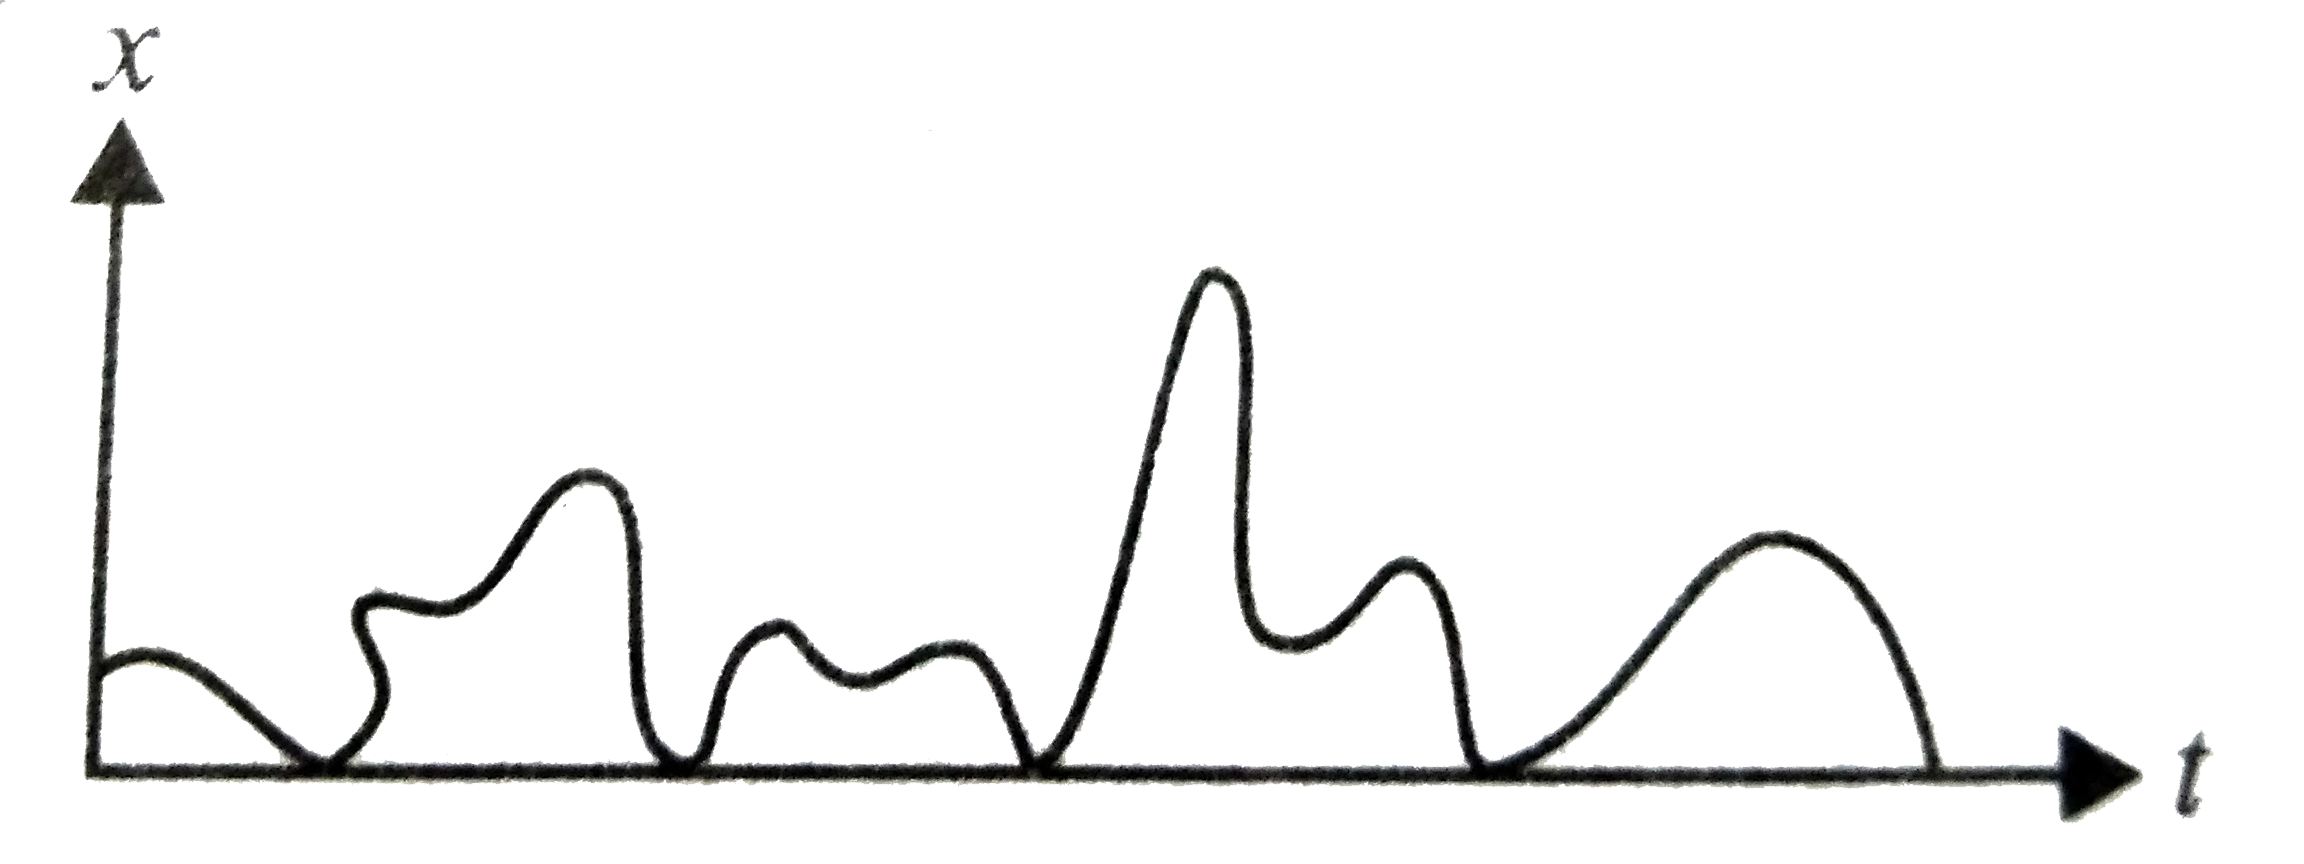 C
C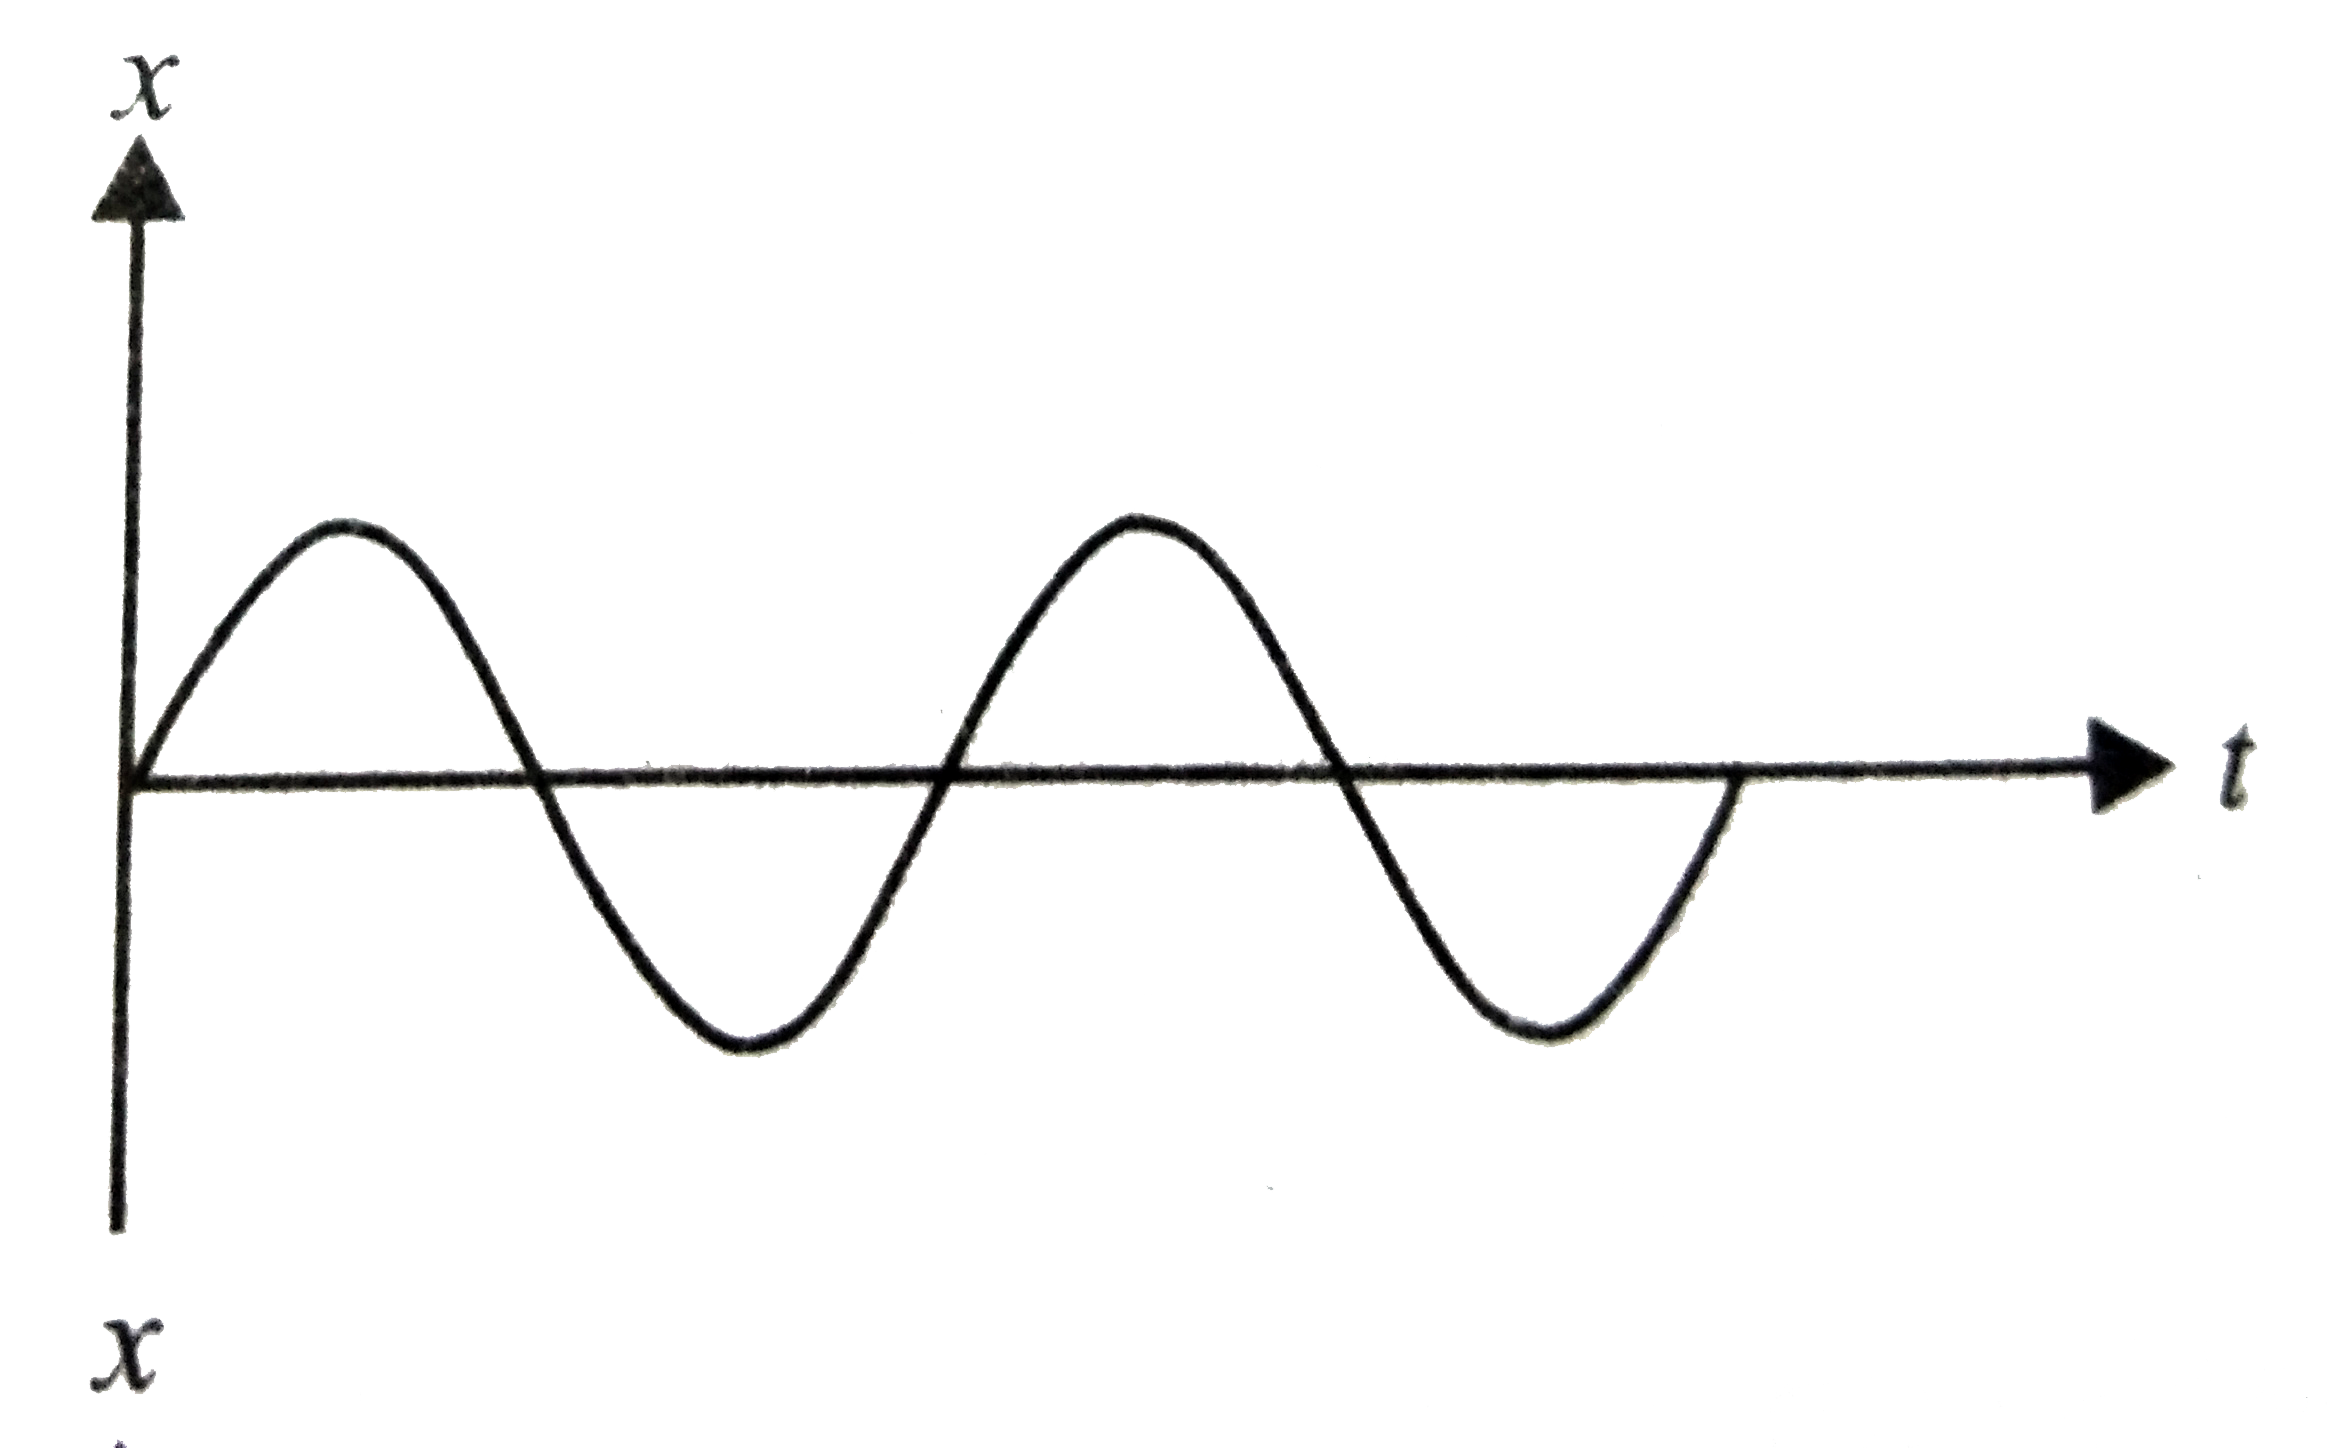 D
D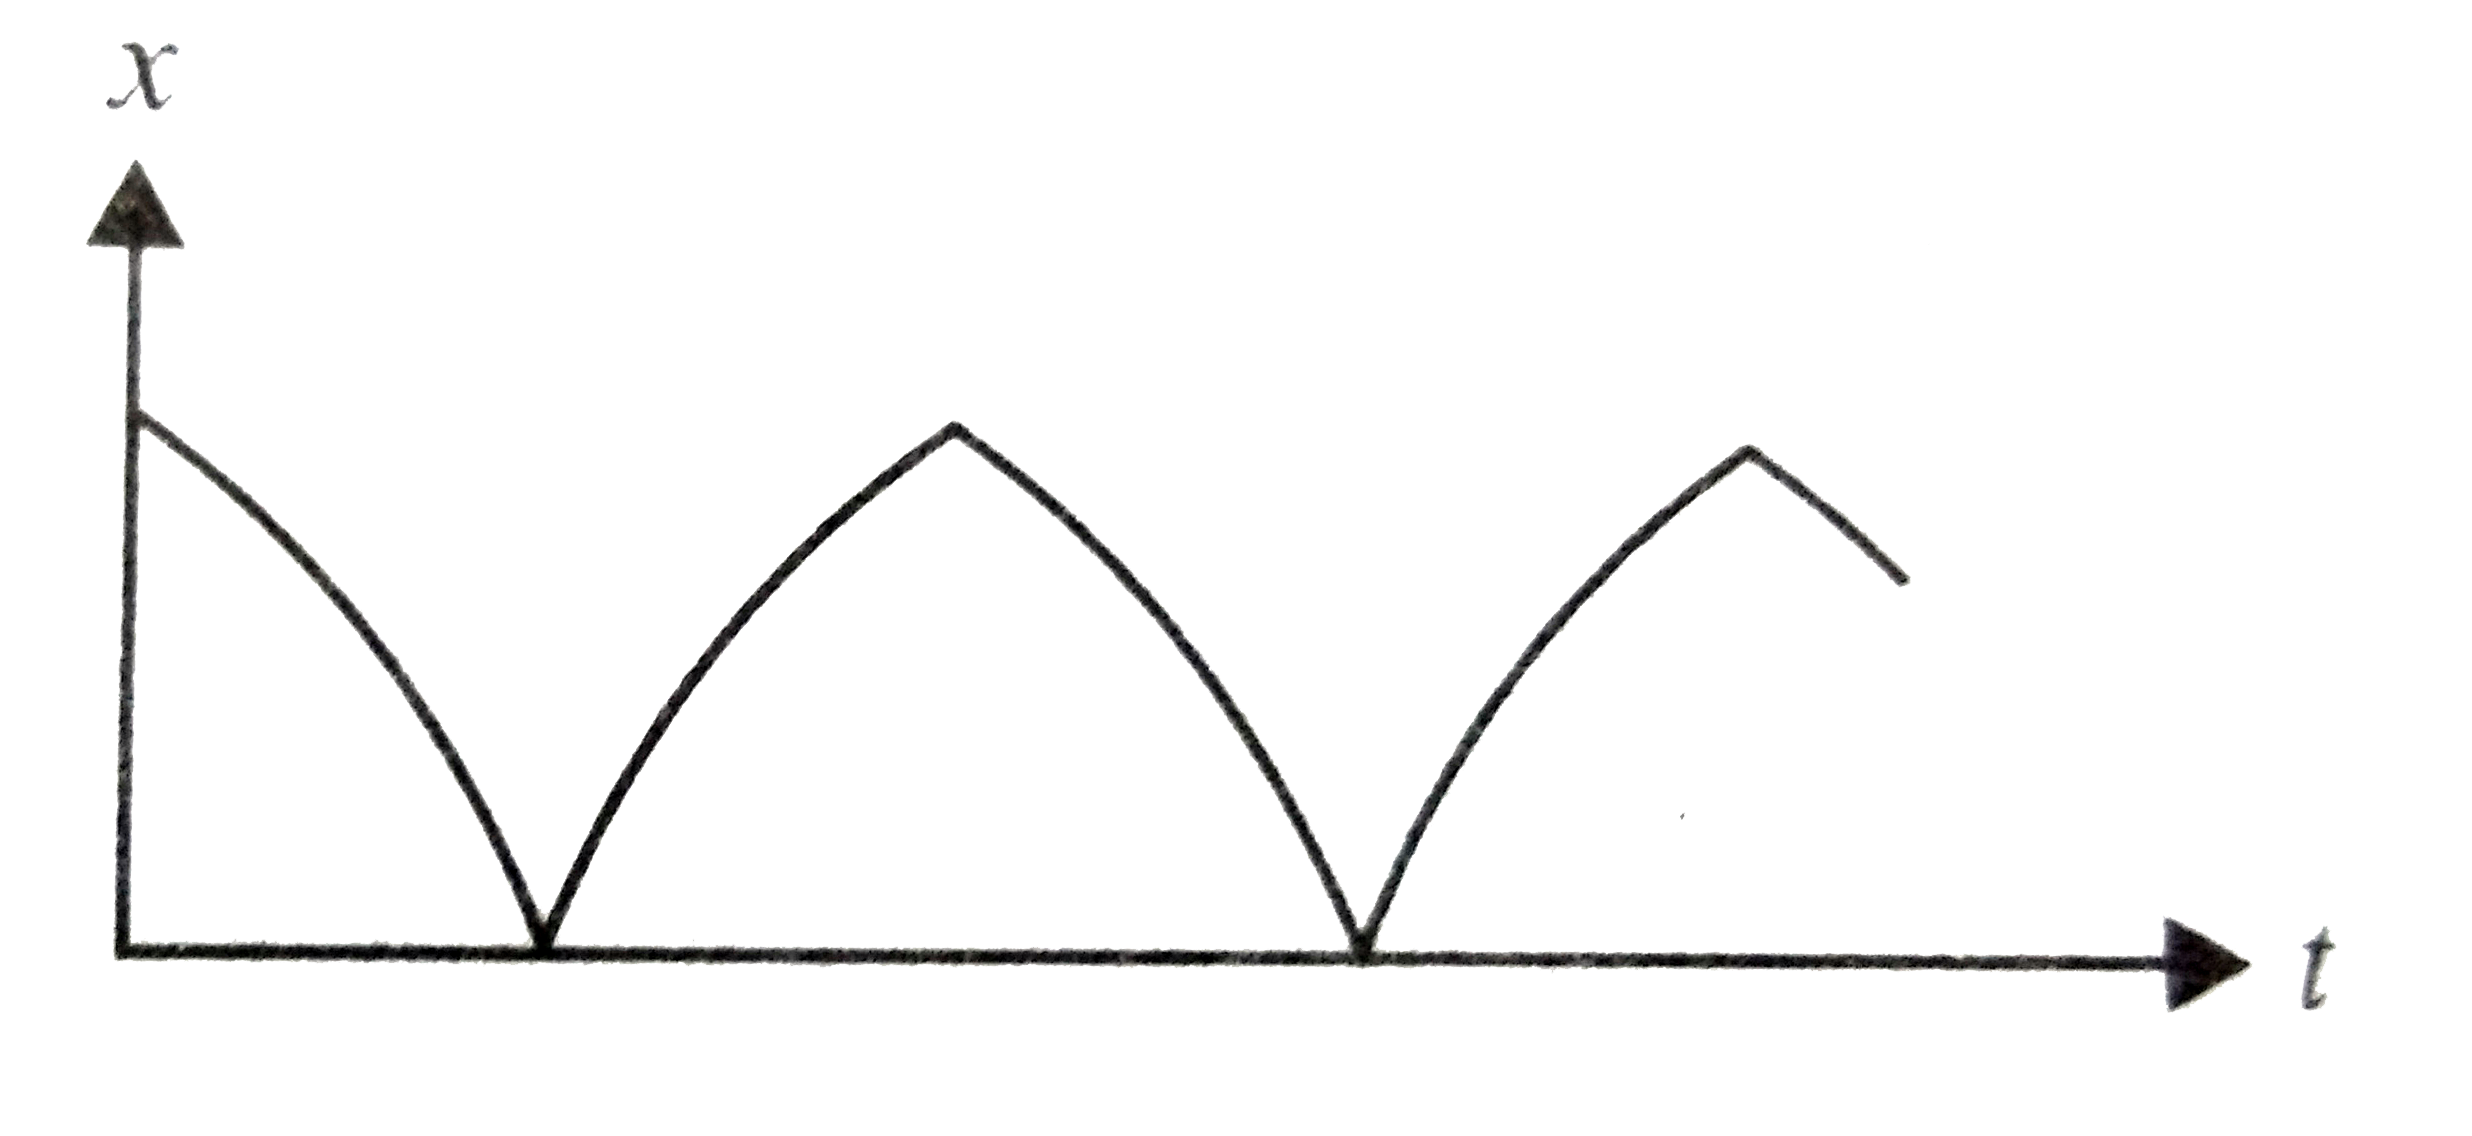
Which of the following I-V graph represents ohmic conductors?
A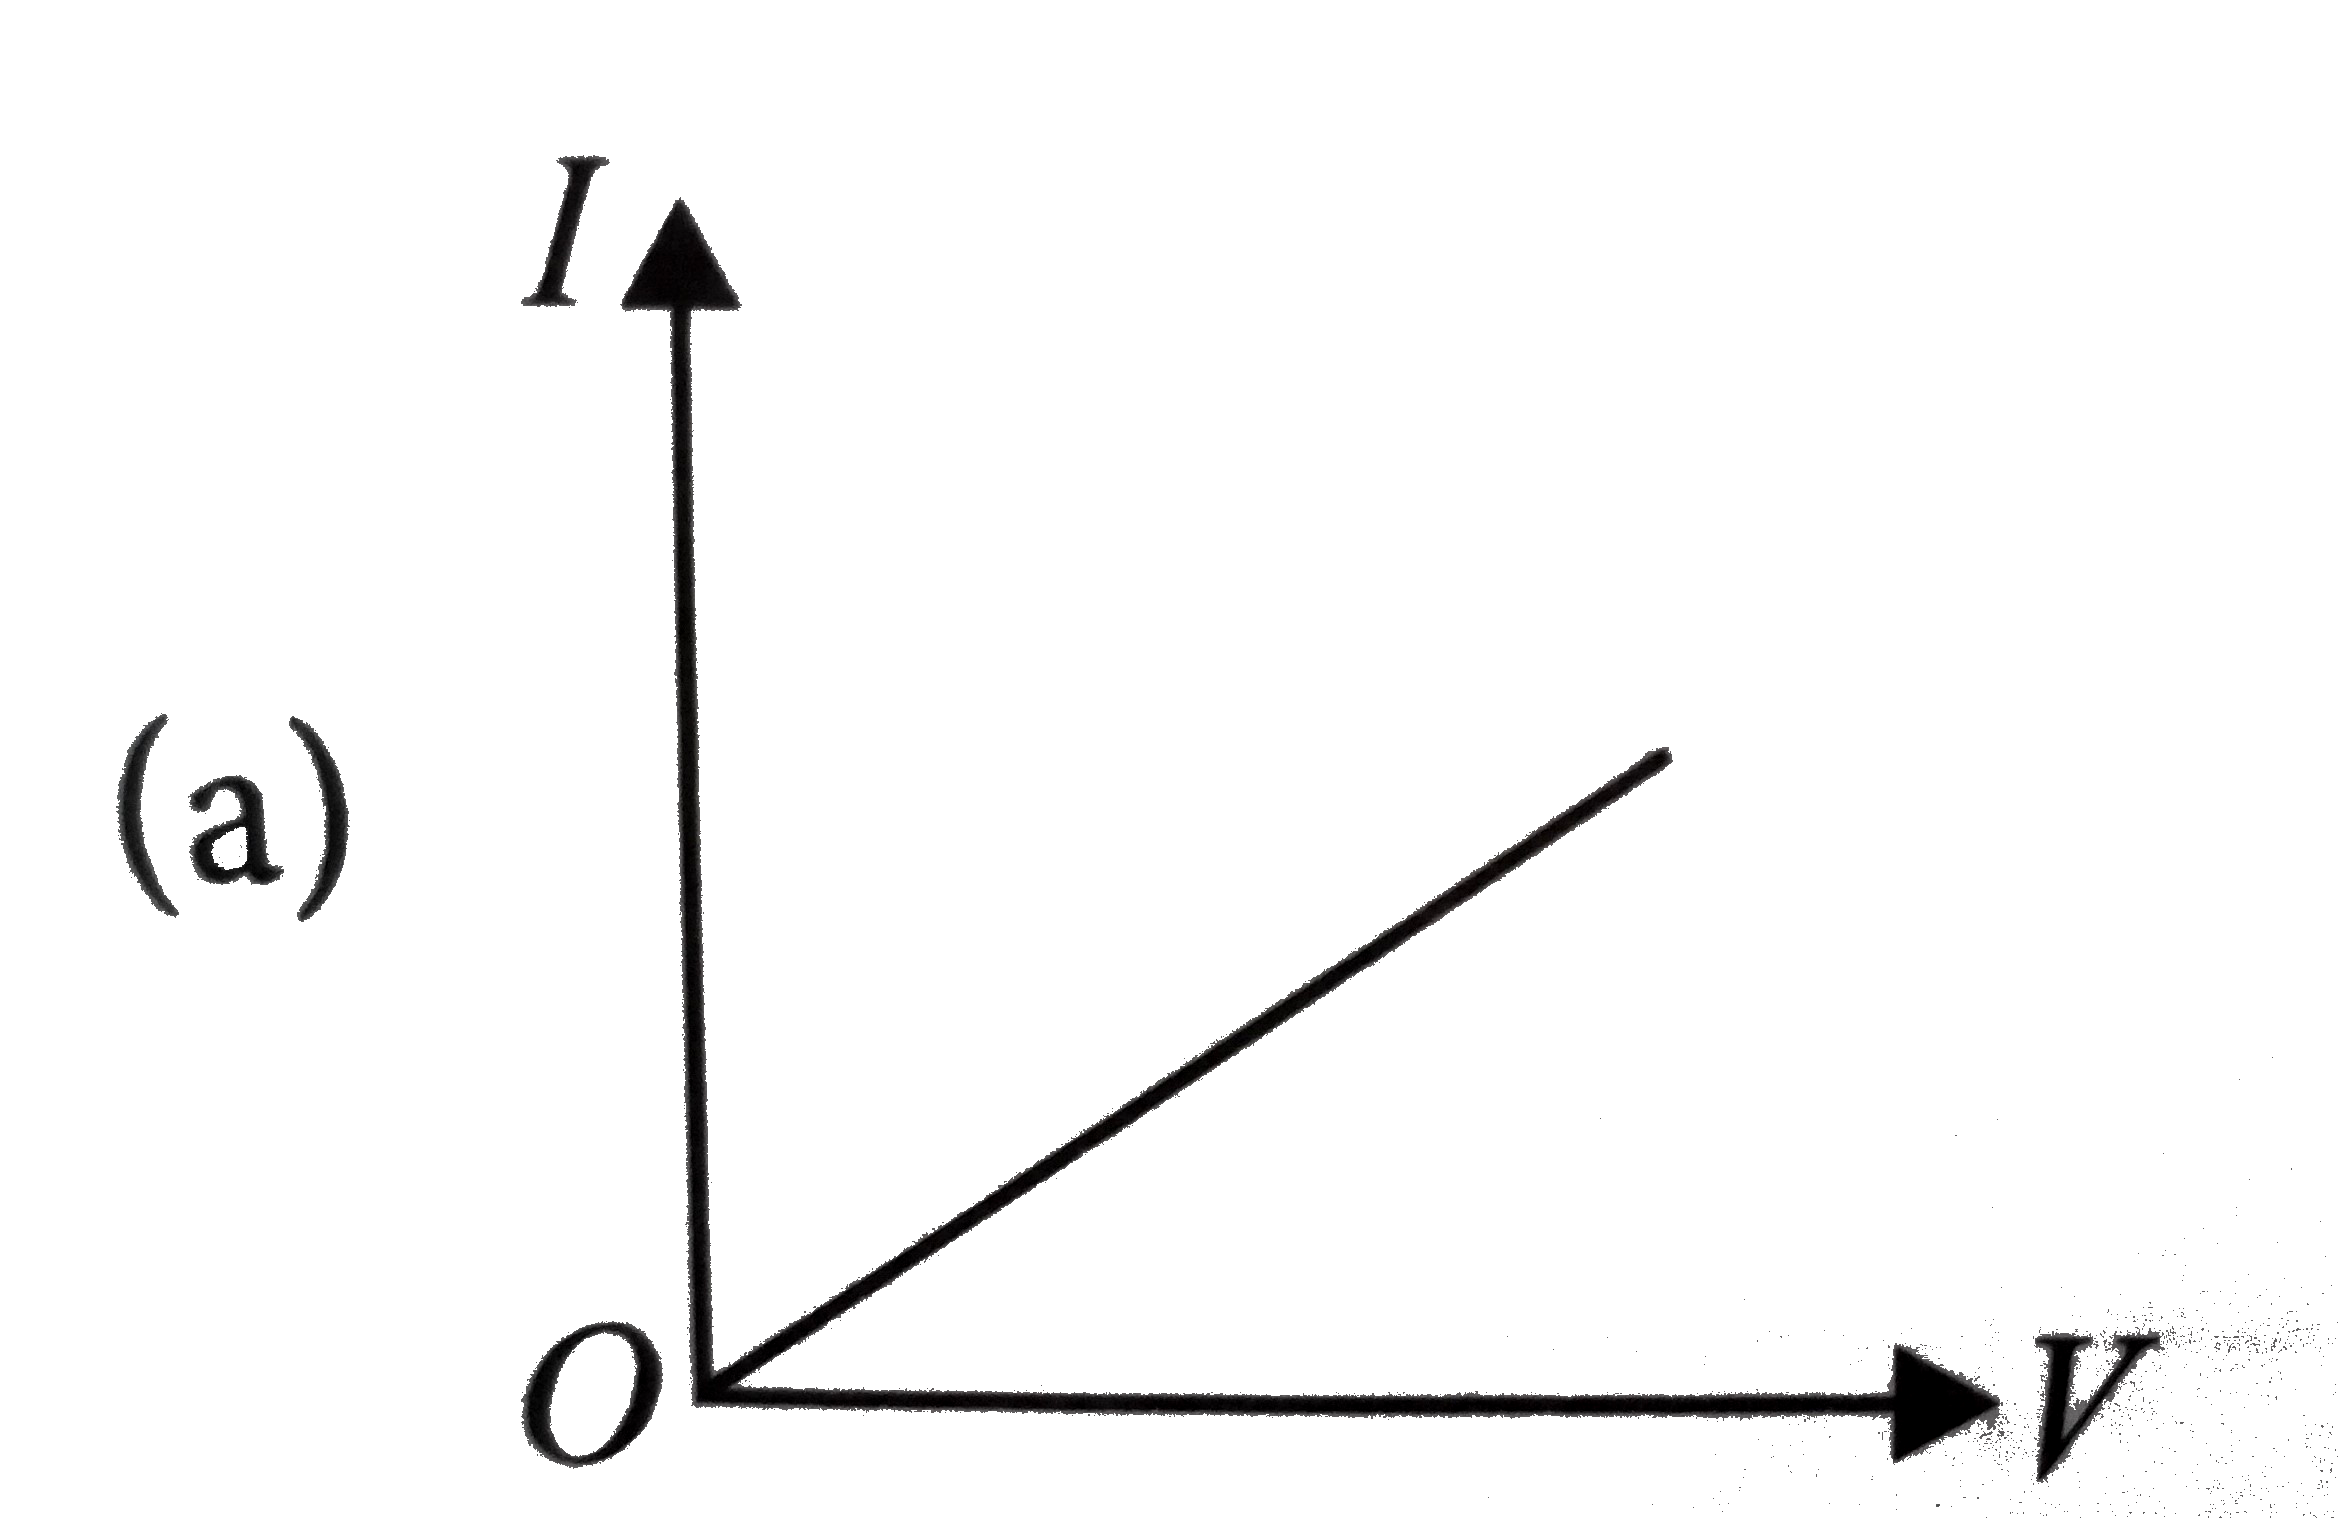 B
B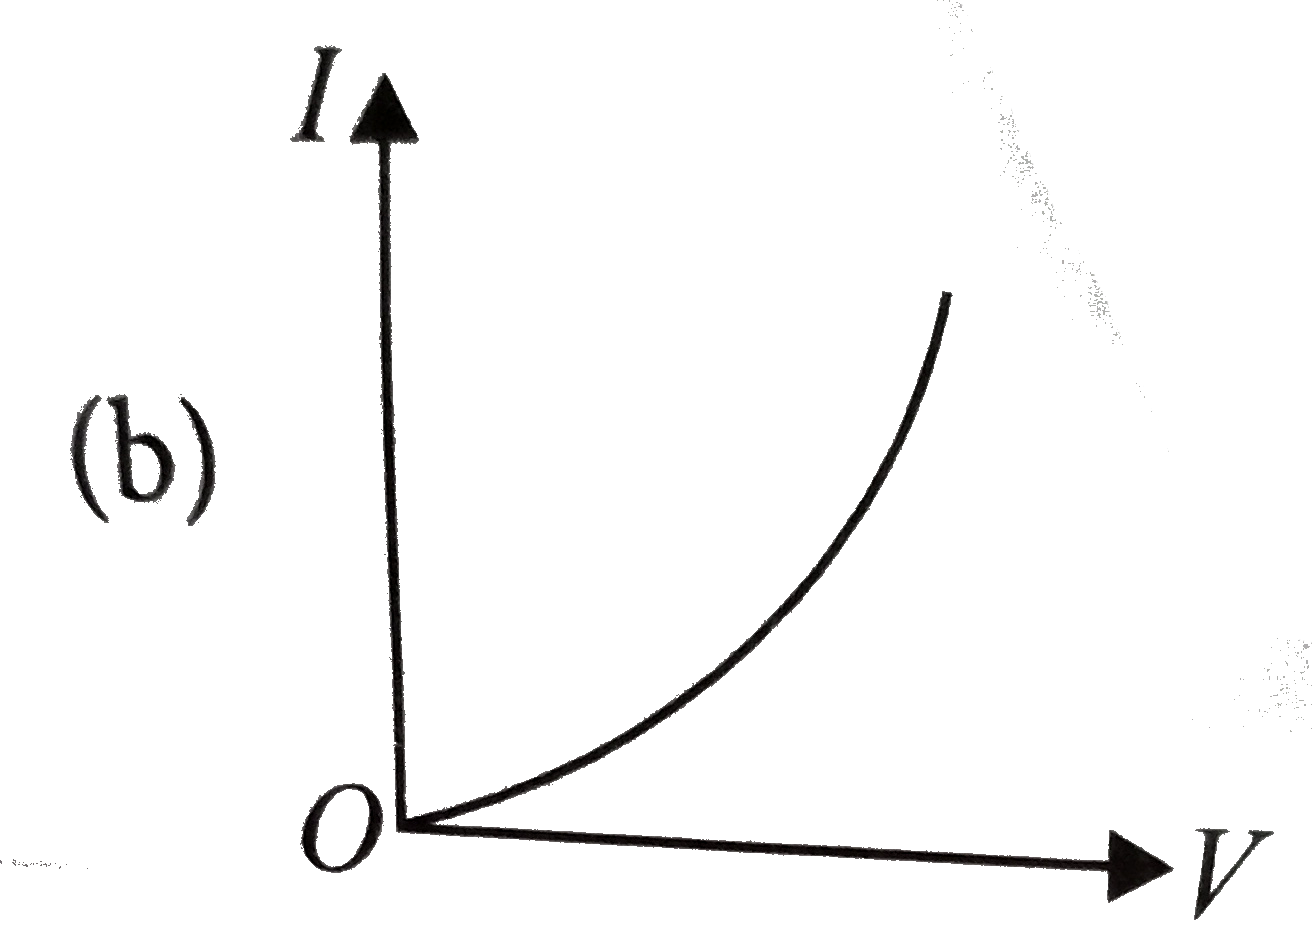 C
C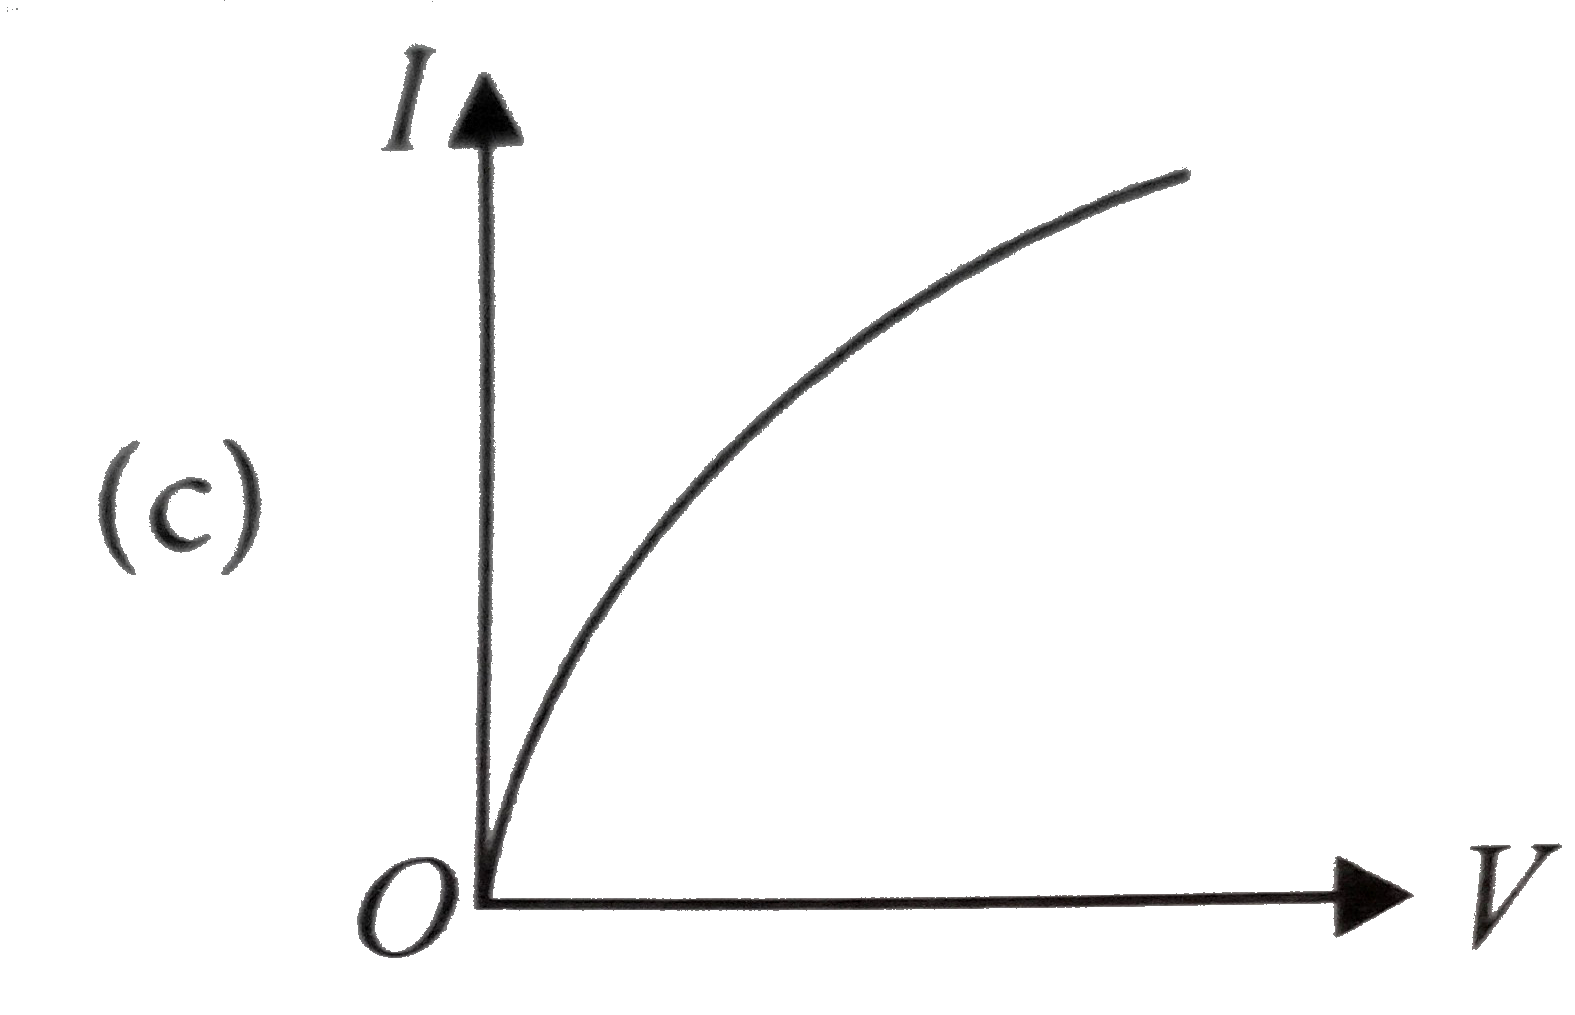 D
D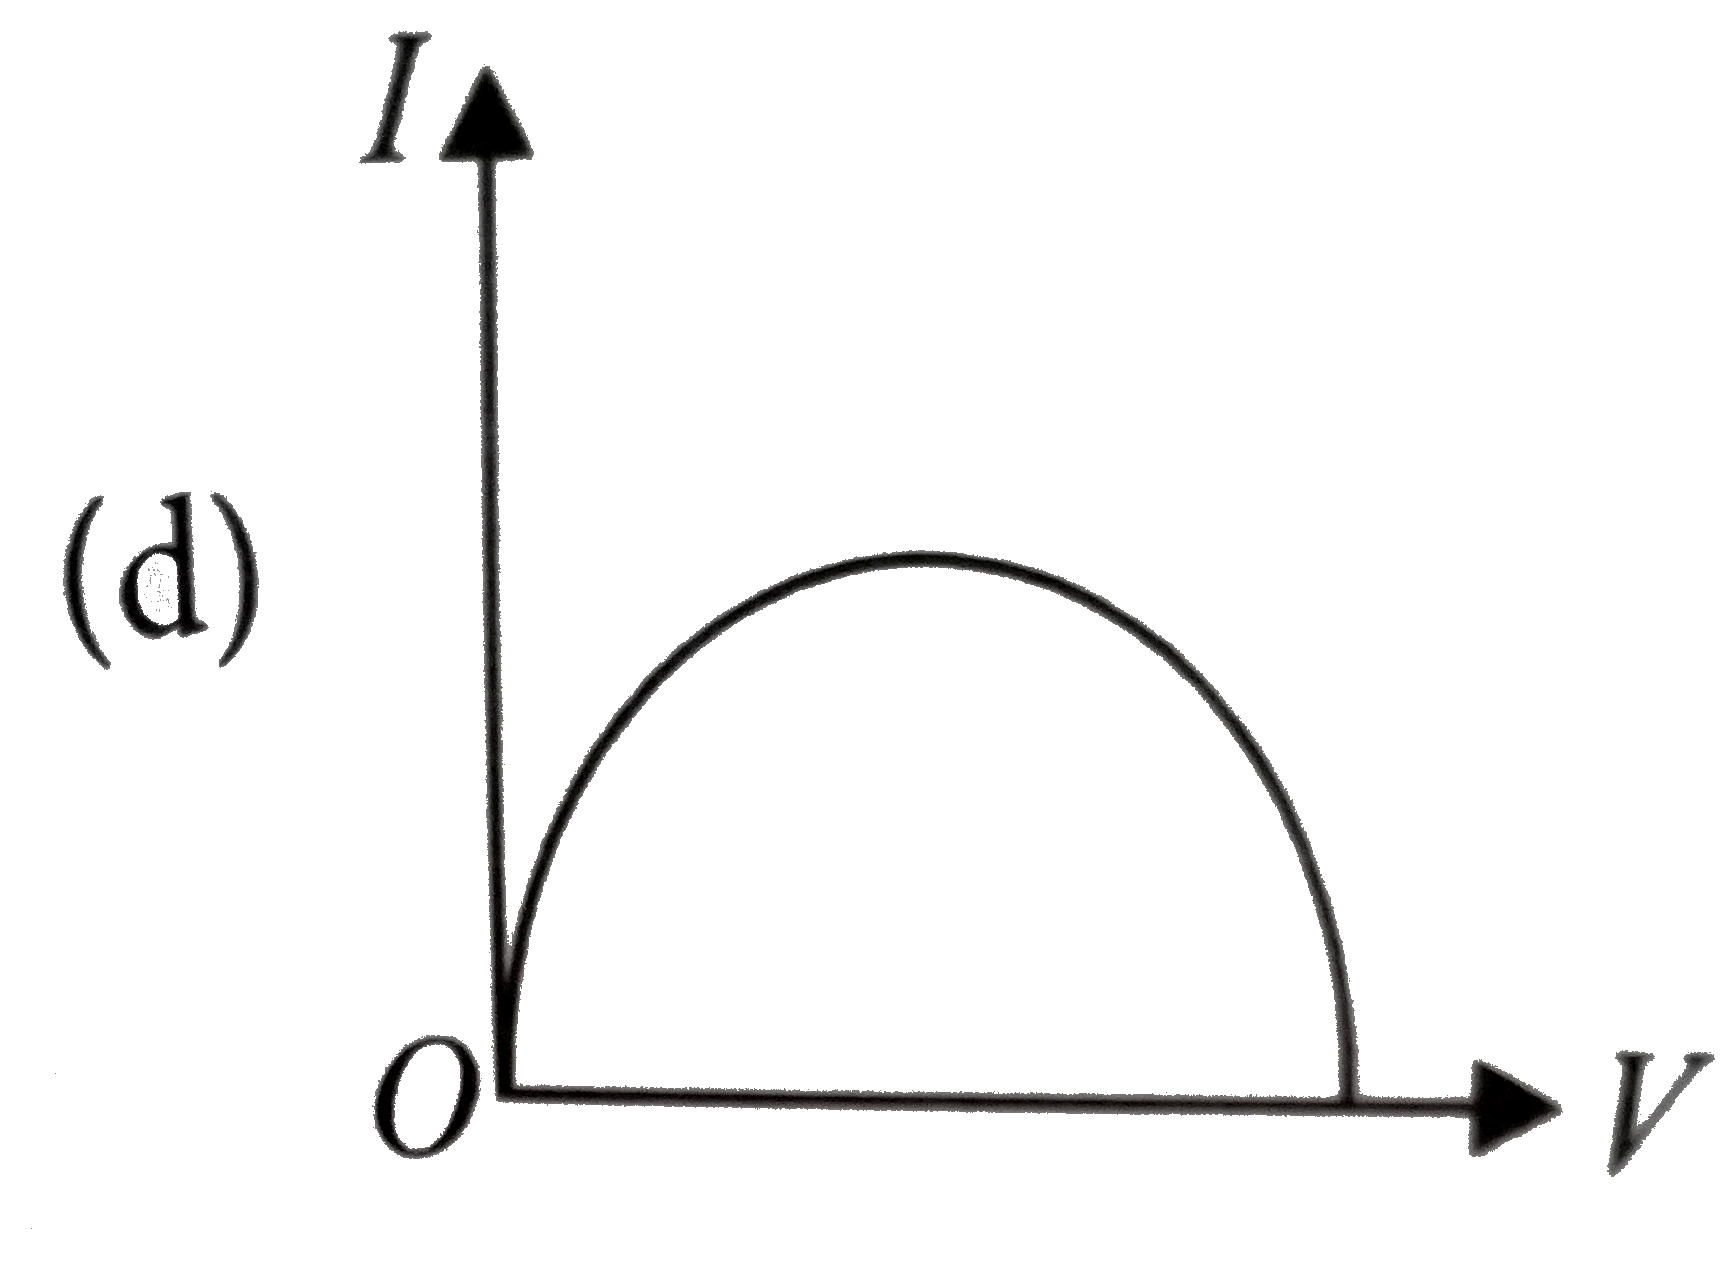
Which of the following P-V diagram represent the graph of isometric process?
A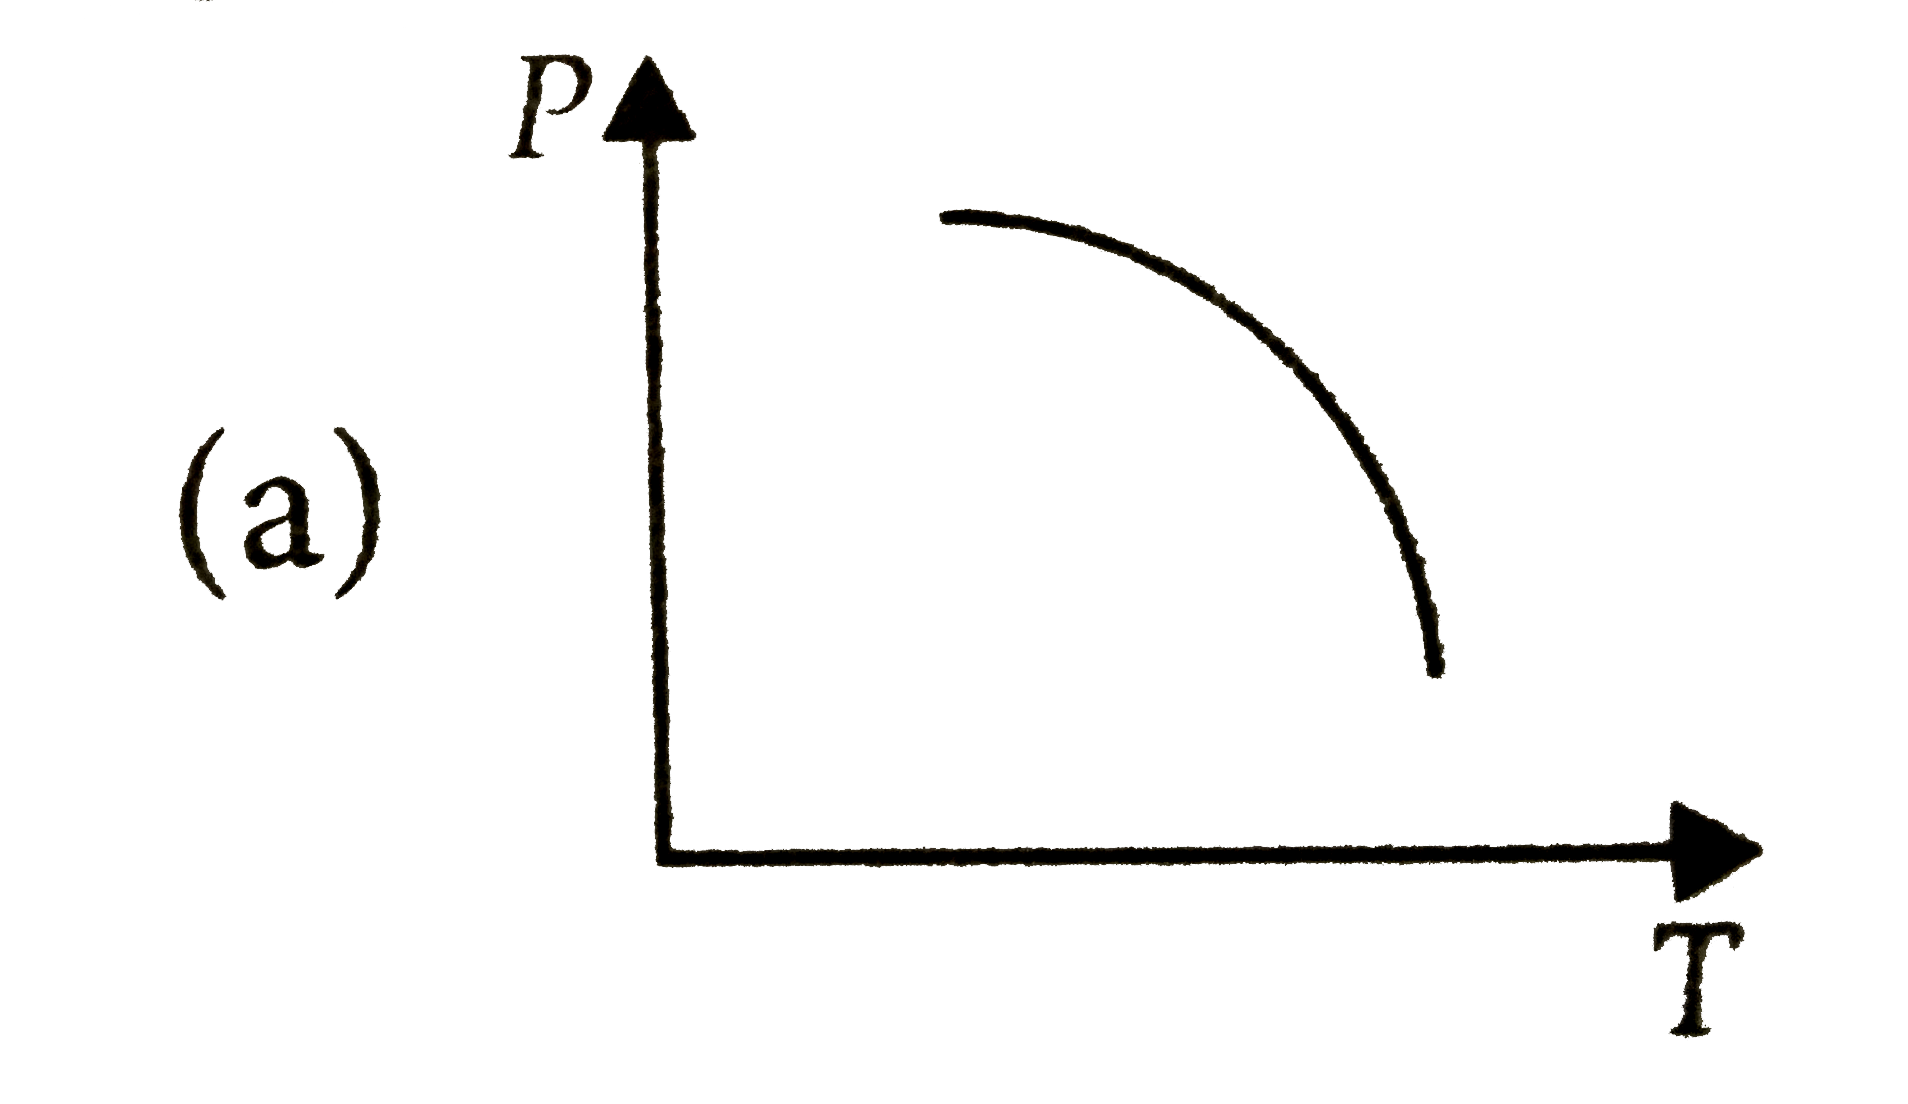 B
B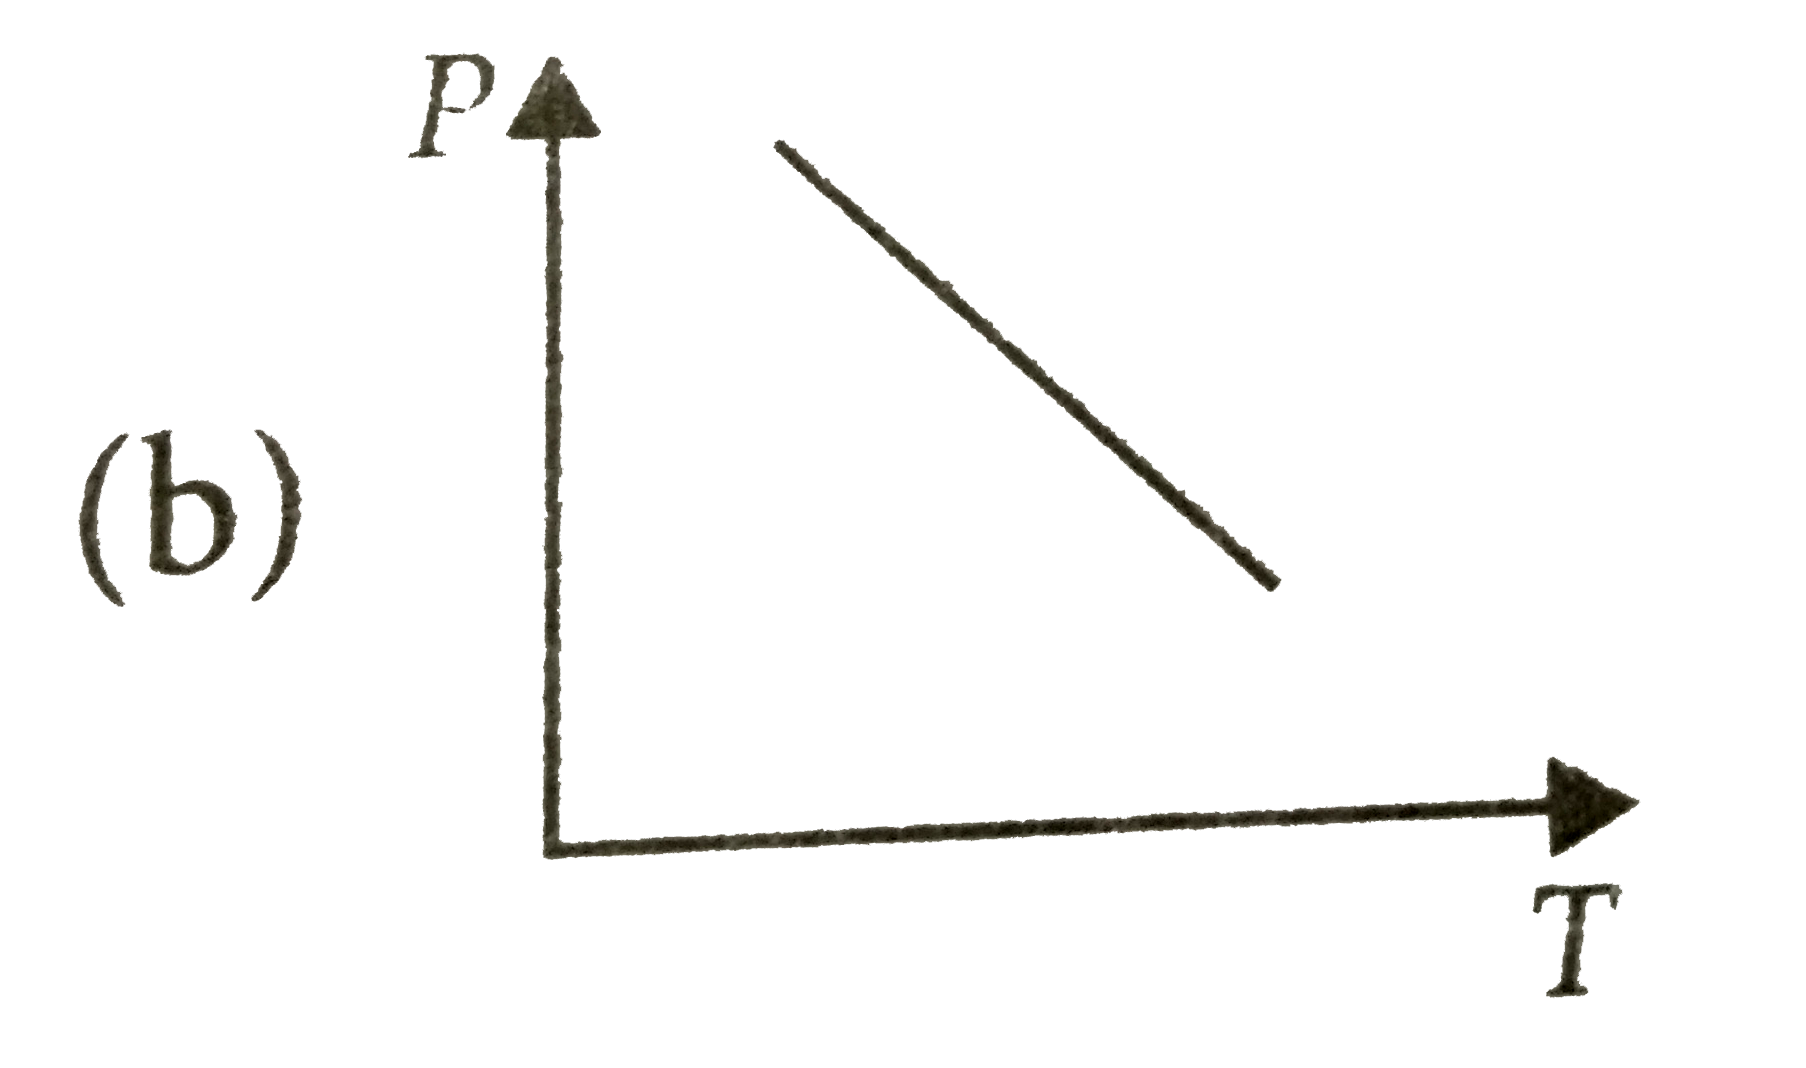 C
C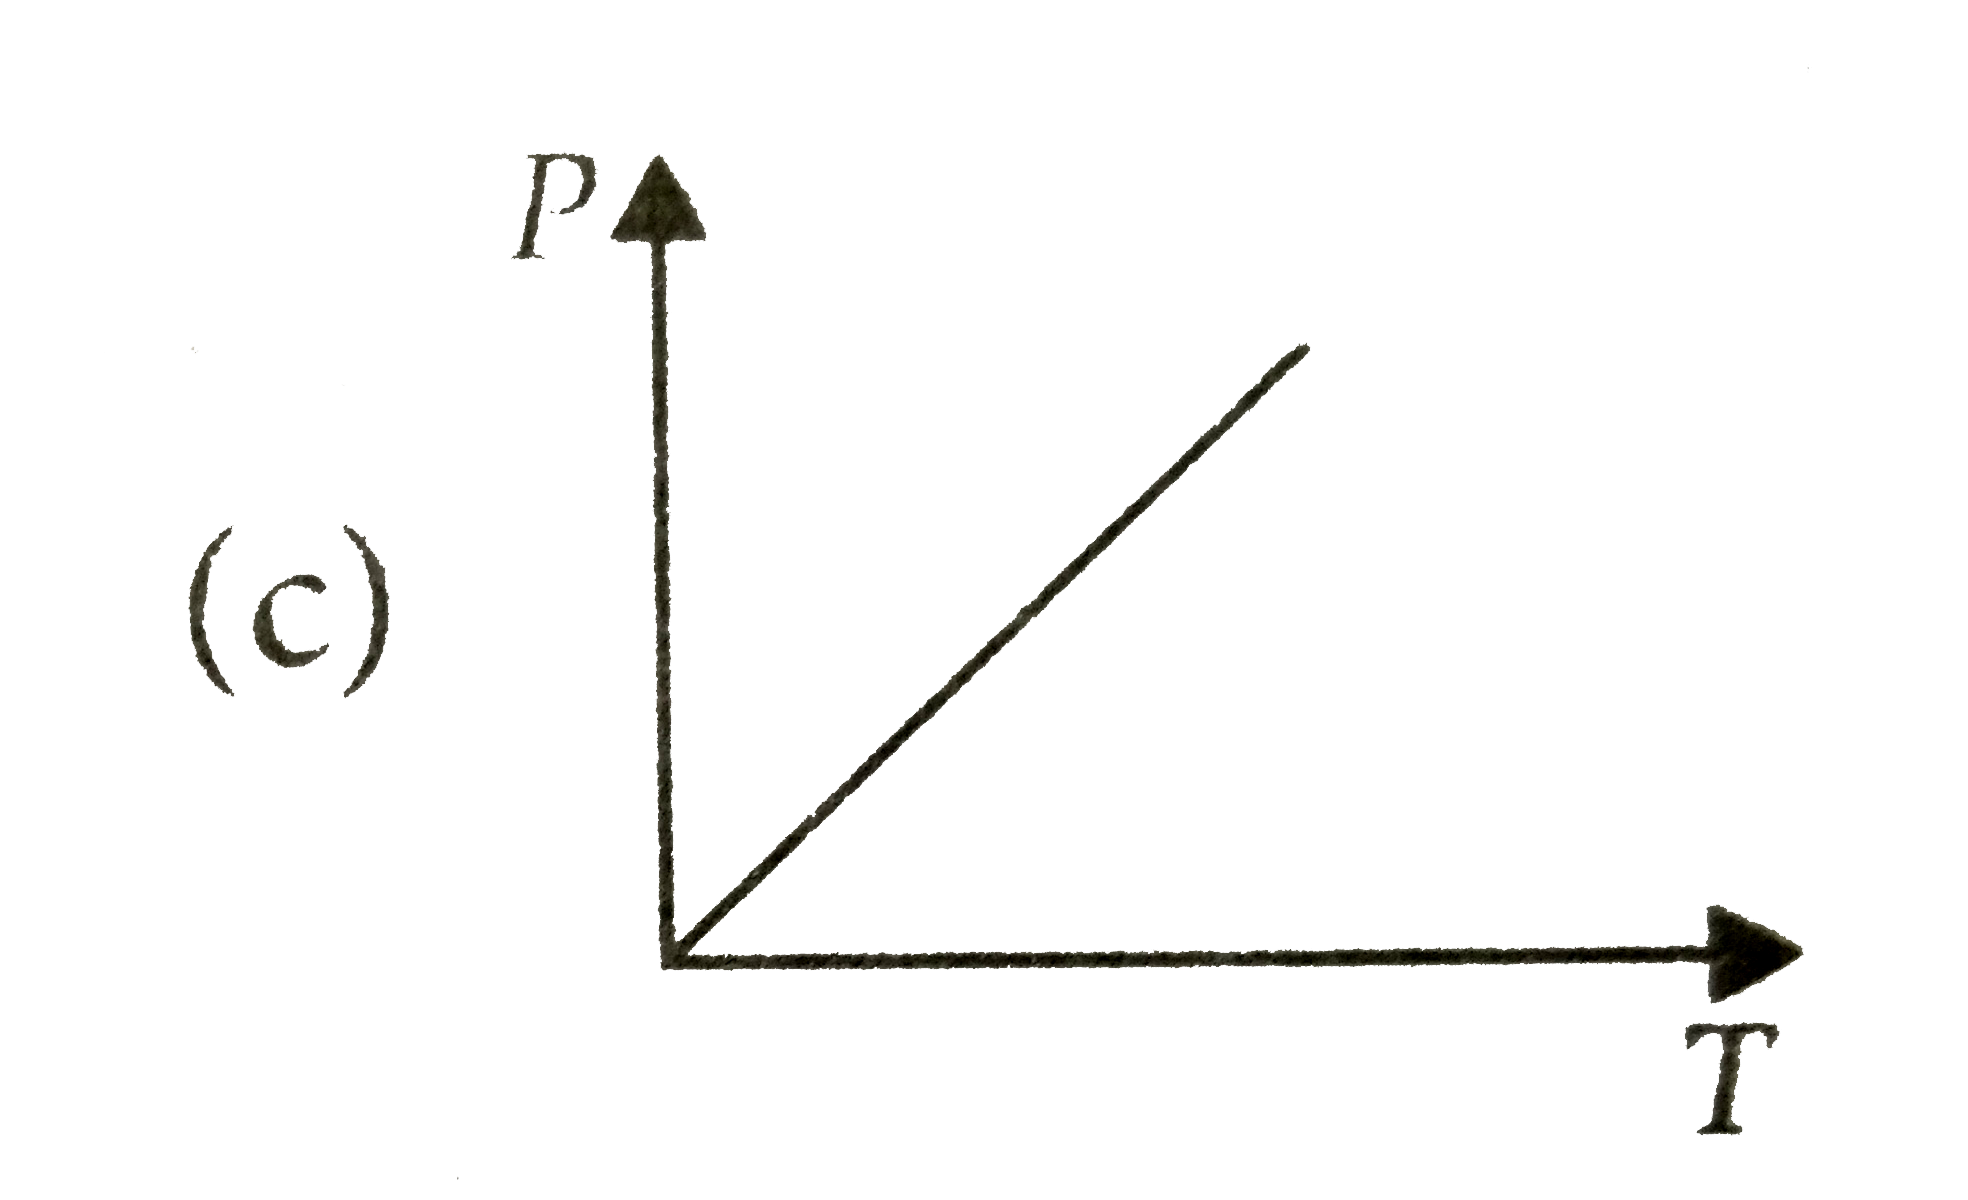 D
D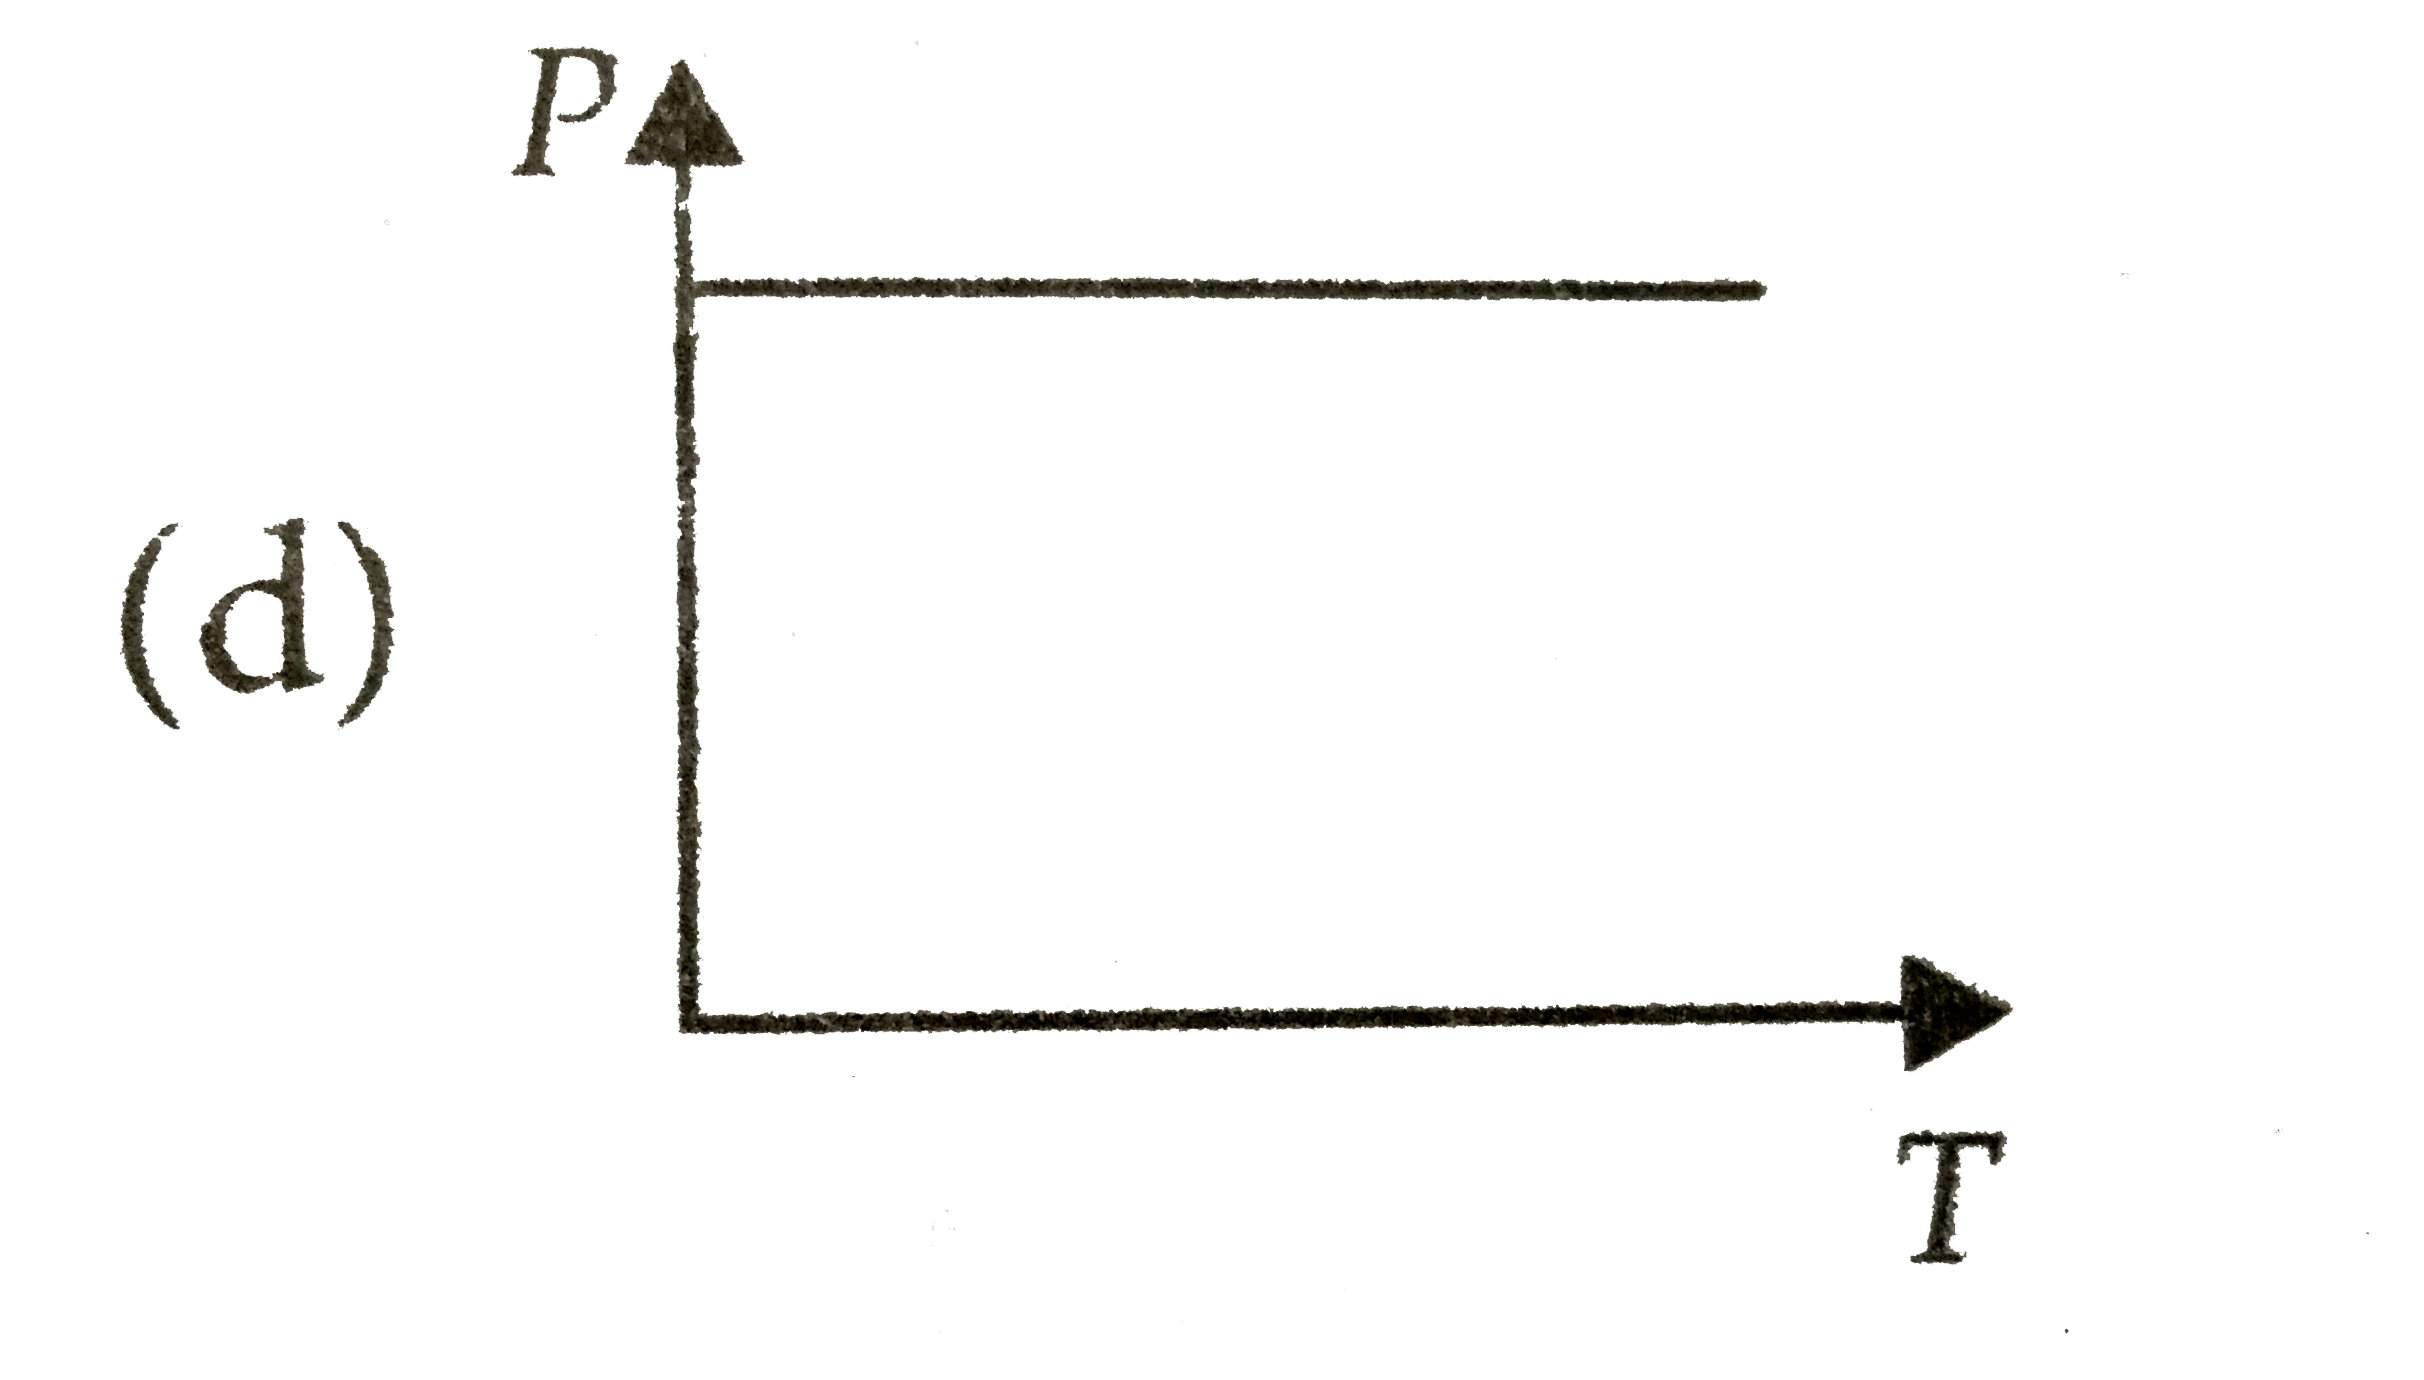
Which of the following volume-temperature (V−T) plots represents the behaviour of 1mole of an ideal gas at the atmospheric pressure?
View SolutionWhich of the following volume-temperature (V−I) plots represents the behaviour of 1mole of an ideal gas at the atmospheric pressure?
View SolutionThe graph shown the variation with times t of the velocity v of an object . Which one of the following graphs best represents the variation of acceleration a of the object with time t?

View SolutionTen moles of an ideal gas are filled in a closed vessel. The vessel has cylinder and piston type arrangement and pressure of the gas remains constant at 0.821 atm. Which of the following graph represents correct variation of log V vs log T?
(V = Volume in litre and T = temperature in Kelvin)
View SolutionWhich of the following graph represents the variation of resistivity (ρ) with temperature (T) for copper?
View Solution

