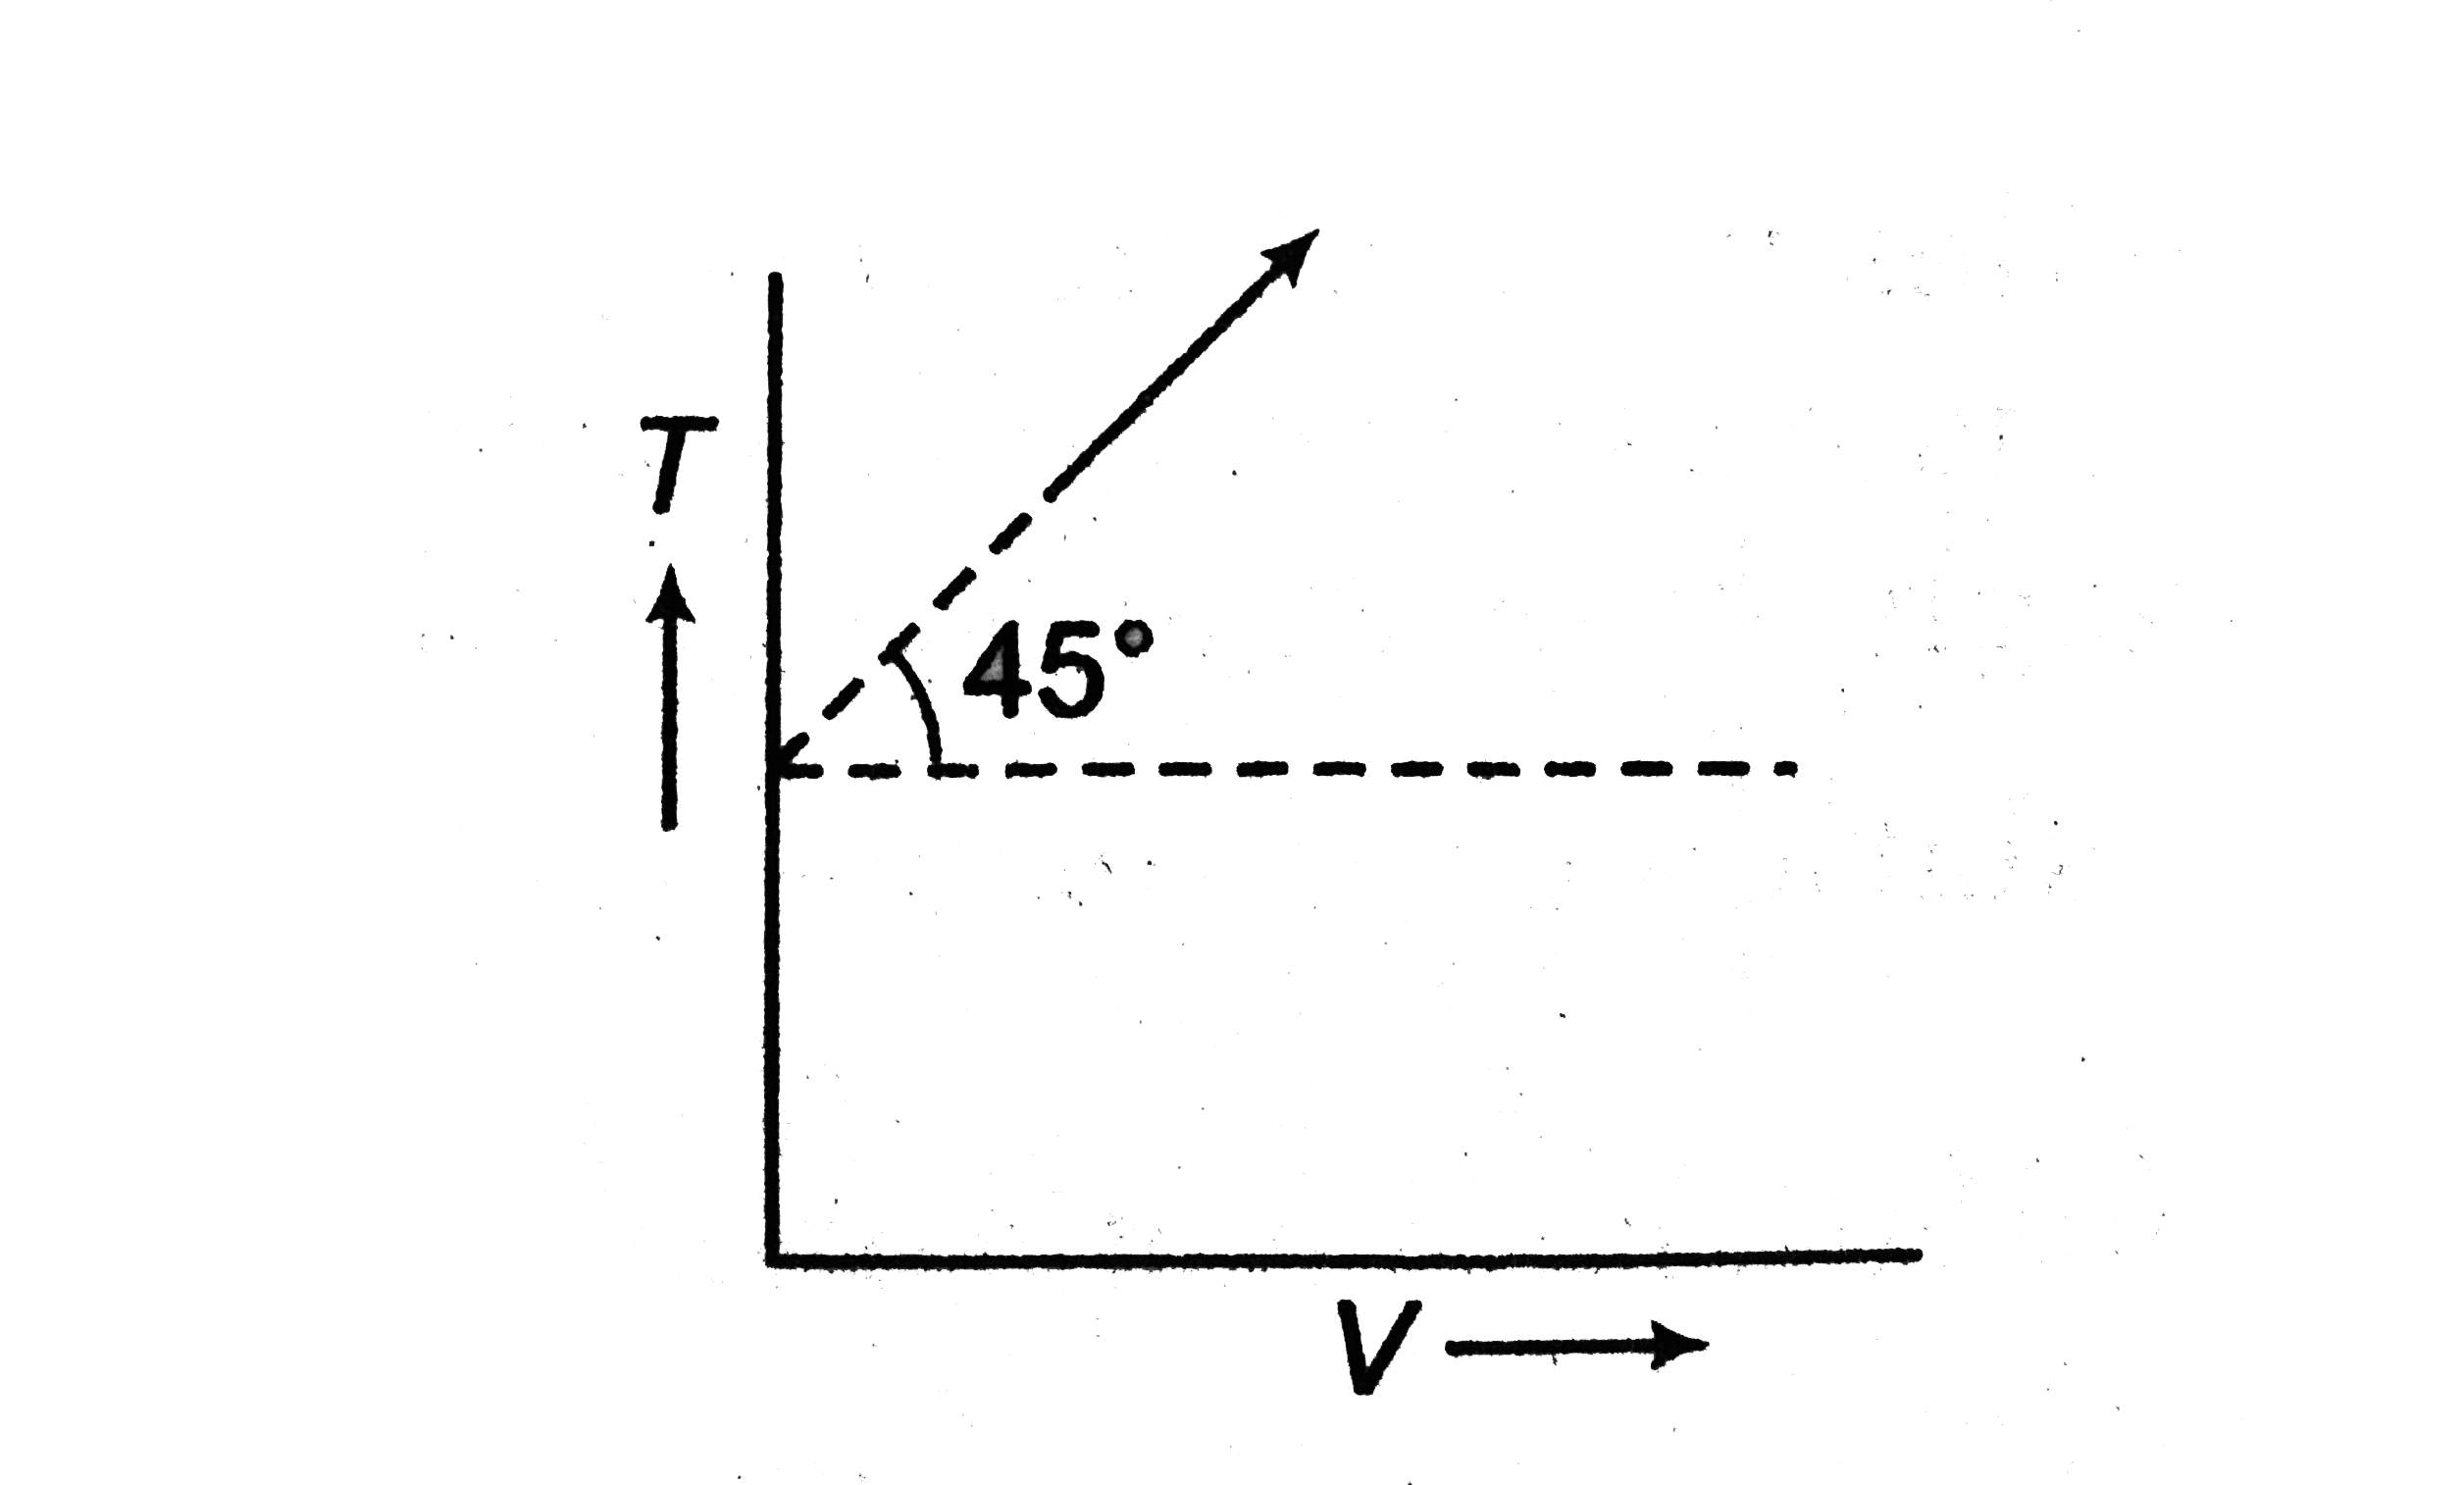
which of the following volume-temperature (V−T) curve best represents an isobaric process for a fixed mass of gas?
To determine which volume-temperature (V-T) curve best represents an isobaric process for a fixed mass of gas, we can follow these steps:
Step 1: Understand the Isobaric Process
An isobaric process is one in which the pressure (P) remains constant while the volume (V) and temperature (T) of the gas can change. According to the ideal gas law, PV=nRT, if the pressure is constant, we can express the relationship between volume and temperature.
Step 2: Analyze the Ideal Gas Law
From the ideal gas law, if pressure (P) is constant, we can rearrange the equation to show that volume is directly proportional to temperature:
V∝T
This means that as the temperature increases, the volume also increases, and vice versa.
Step 3: Identify the Characteristics of the V-T Curve
Since V is directly proportional to T in an isobaric process, the V-T curve will be a straight line that slopes upwards. This indicates that for every increase in temperature, there is a corresponding increase in volume.
Step 4: Evaluate the Given Options
Now, we need to evaluate the provided options (A, B, C, D) for their V-T characteristics:
- Look for a graph that shows a straight line with a positive slope, indicating that volume increases with temperature.
Step 5: Select the Correct Option
Upon examining the options, we find that:
- Option B shows a straight line that rises as volume increases with temperature. This matches our expectation for an isobaric process.
Conclusion
Thus, the correct answer is Option B, as it best represents an isobaric process for a fixed mass of gas.
---
An isobaric process is one in which the pressure (P) remains constant while the volume (V) and temperature (T) of the gas can change. According to the ideal gas law, PV=nRT, if the pressure is constant, we can express the relationship between volume and temperature.
From the ideal gas law, if pressure (P) is constant, we can rearrange the equation to show that volume is directly proportional to temperature:
V∝T
This means that as the temperature increases, the volume also increases, and vice versa.
Since V is directly proportional to T in an isobaric process, the V-T curve will be a straight line that slopes upwards. This indicates that for every increase in temperature, there is a corresponding increase in volume.
Now, we need to evaluate the provided options (A, B, C, D) for their V-T characteristics:
- Look for a graph that shows a straight line with a positive slope, indicating that volume increases with temperature.
Upon examining the options, we find that:
- Option B shows a straight line that rises as volume increases with temperature. This matches our expectation for an isobaric process.
Thus, the correct answer is Option B, as it best represents an isobaric process for a fixed mass of gas.
Similar Questions
which of the following volume temperature (V−T) graph represent carnot engine cycle ABCDA?
View SolutionWhich of the following volume-temperature (V−T) plots represents the behaviour of 1mole of an ideal gas at the atmospheric pressure?
View SolutionWhich of the following volume-temperature (V−I) plots represents the behaviour of 1mole of an ideal gas at the atmospheric pressure?
View SolutionWhich of the following volume (V) –temperature (T) plots represents the behaviour of one mole of an ideal gas at one atmospheric pressure?

View SolutionWhich of the following P-V curve best represents. As isothermal process?
View SolutionWhich of the following is a V-T curve for isobaric process?
View SolutionDraw at P-T curve for isobaric process.
View SolutionDraw at P-T curve for isobaric process.
View SolutionThe given curve represents the variation of temperatue as a function of volume for one mole of an ideal gas. Which of the following curves best represents the variation of pressure as a function of volume ?
 .
.
View SolutionThe given curve represents the variation of temperatue as a function of volume for one mole of an ideal gas. Which of the following curves best represents the variation of pressure as a function of volume ?
 .
.
View Solution
