Which of the following volume (V) –temperature (T) plots represents the behaviour of one mole of an ideal gas at one atmospheric pressure?

The correct Answer is:C
p V = n R T ⇒VT=nRp⇒VT= constant 
Topper's Solved these Questions
- STATES OF MATTERBOOK - VMC MODULES ENGLISHCHAPTER - STATES OF MATTEREXERCISE - ILLUSTRATION
30 Videos
- STATES OF MATTERBOOK - VMC MODULES ENGLISHCHAPTER - STATES OF MATTEREXERCISE - SOLVED EXAMPLES
20 Videos
- STATES OF MATTERBOOK - VMC MODULES ENGLISHCHAPTER - STATES OF MATTEREXERCISE - JEE-Main ( ARCHIVE )
17 Videos
- STATES OF MATTERBOOK - VMC MODULES ENGLISHCHAPTER - STATES OF MATTEREXERCISE - IMPECCABLE
50 Videos
- STOICHIOMETRY - IBOOK - VMC MODULES ENGLISHCHAPTER - STOICHIOMETRY - IEXERCISE - JEE Advanced (Archive)
31 Videos
Similar Questions
Knowledge Check
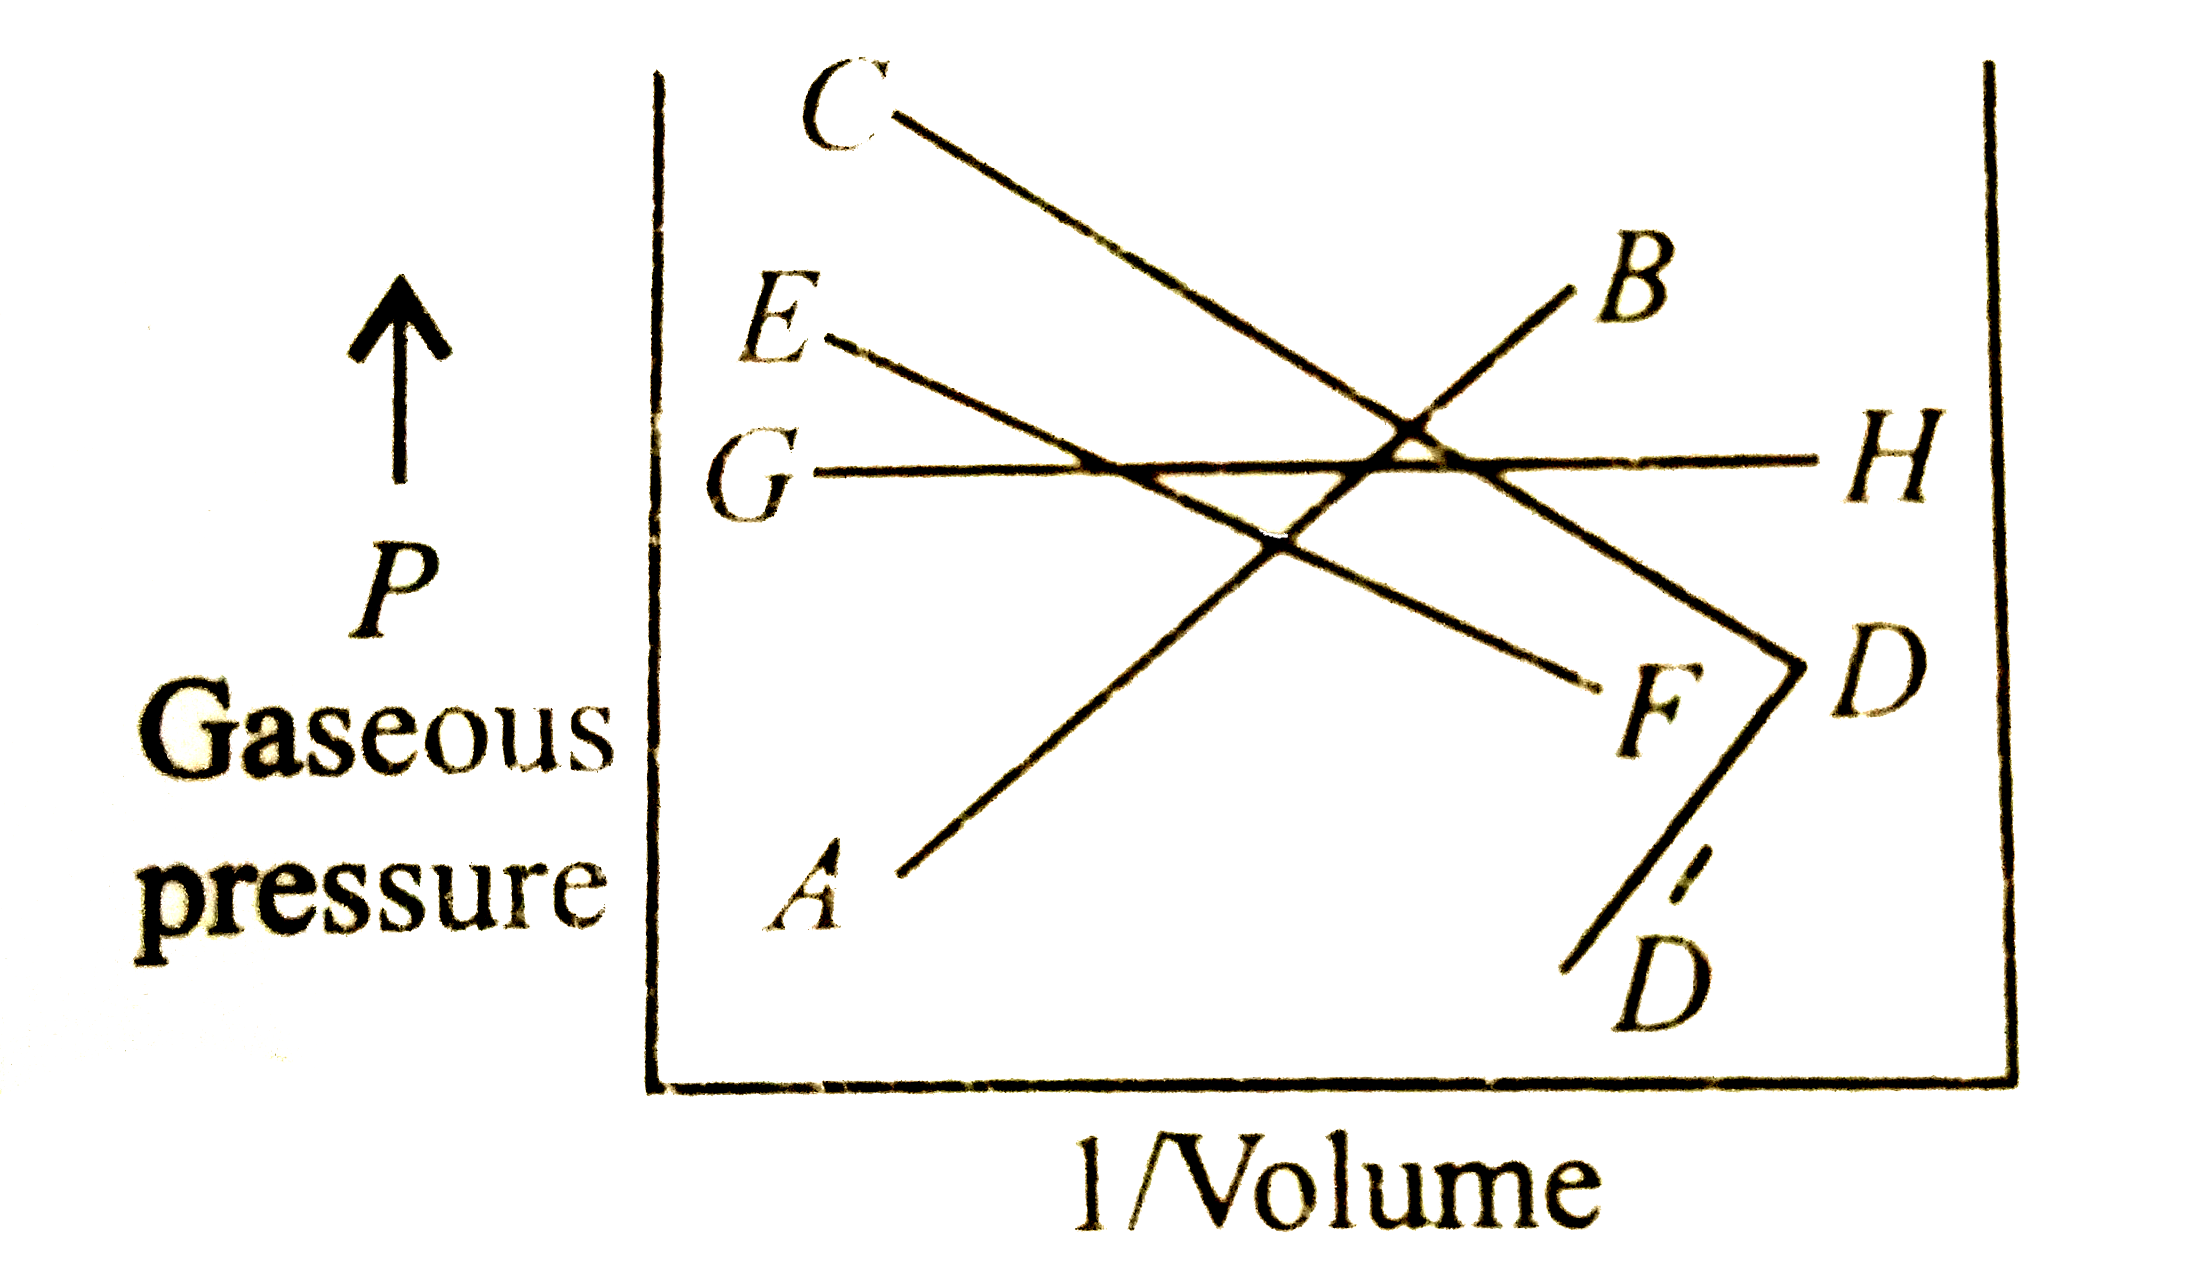
Which of the following graphs represent the behaviour of an ideal gas ?
A1.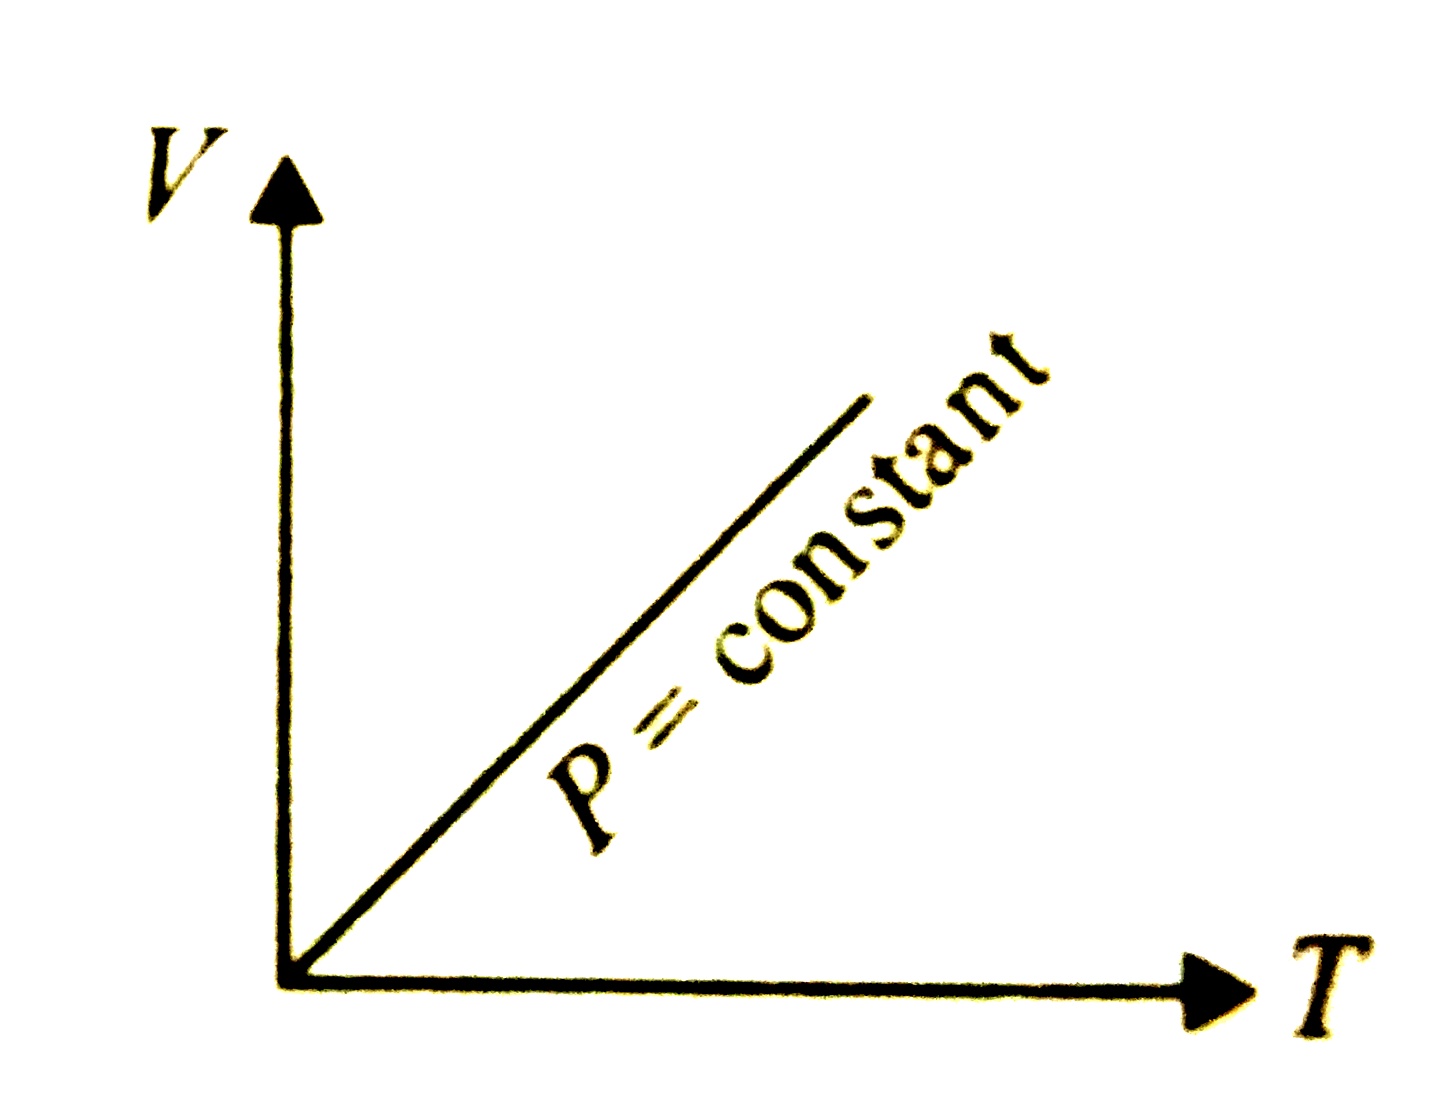 B2.
B2.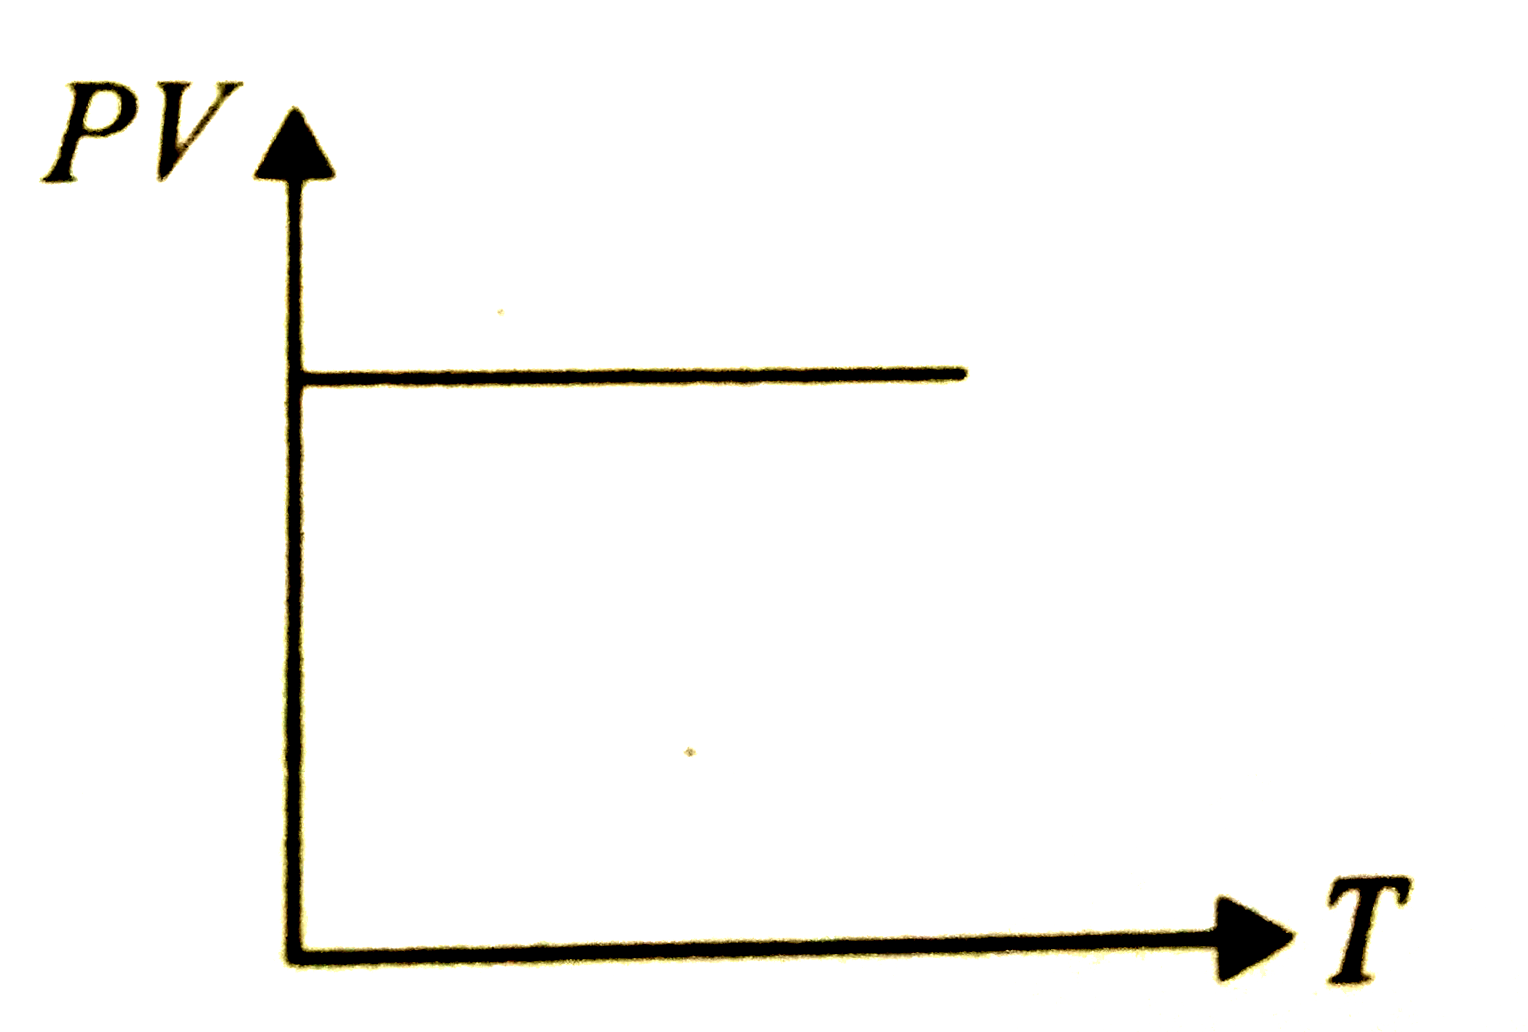 C3.
C3.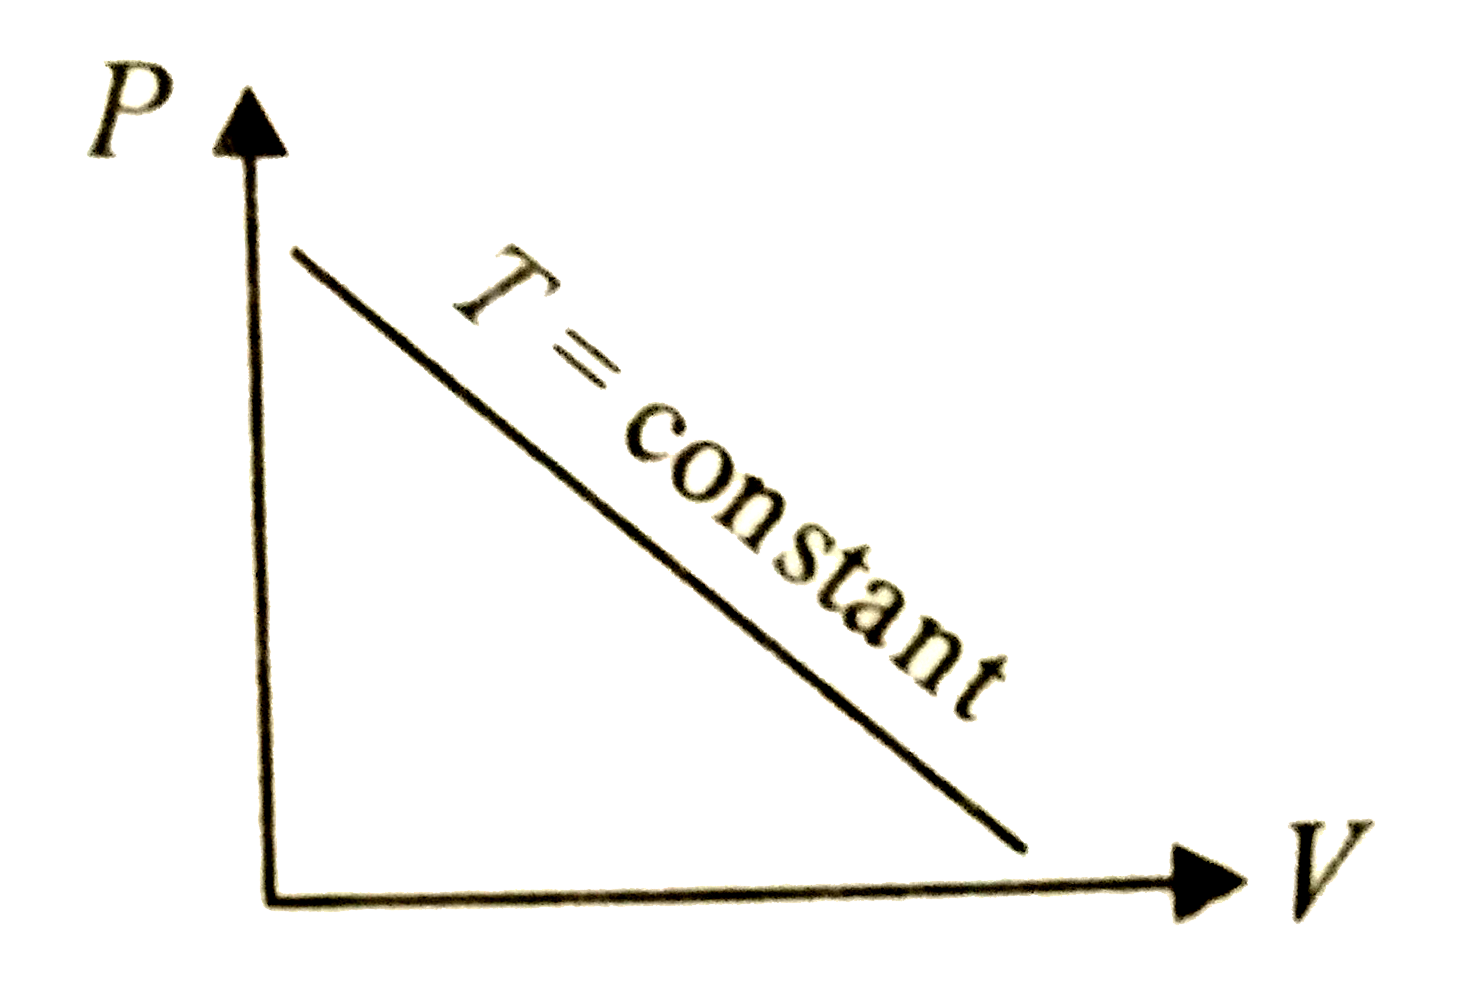 D4.
D4.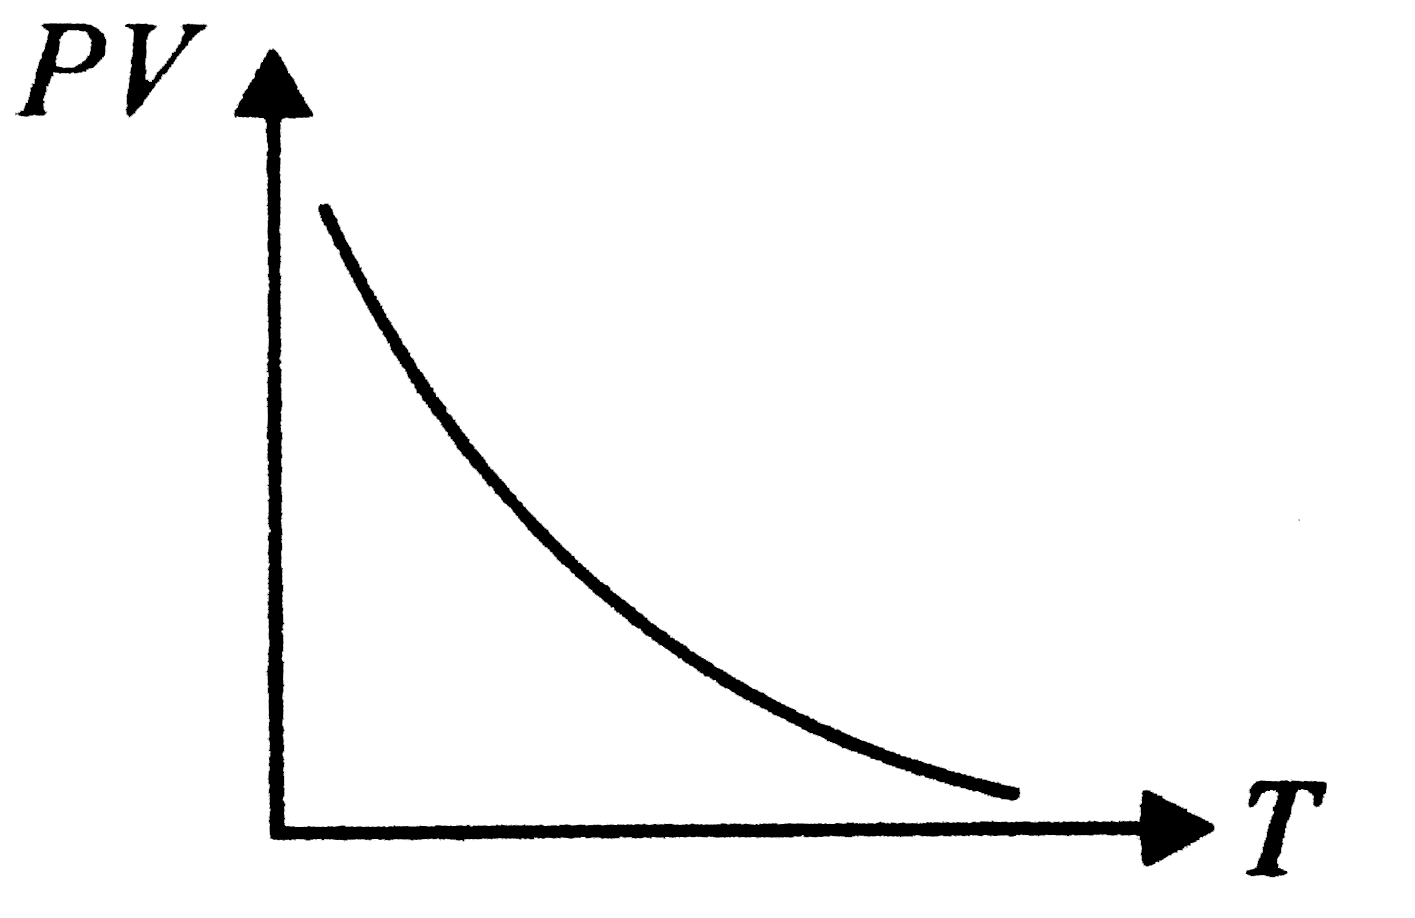
which of the following volume-temperature (V−T) curve best represents an isobaric process for a fixed mass of gas?
View SolutionIf both the temperature and the volume of an ideal gas are doubled, the pressure
View SolutionWhich of the following is a correct plot of the volume of fixed amount of ideal gas as a function of temperature (at constant pressure)
View SolutionWhich one of the given pressure versus volume plots represents Boyle's law ?
View SolutionIf one mole of gas doubles its volume at temperature T isothermally then work done by the gas is
View SolutionThe given curve represents the variation of temperature as a function of volume for one mole of an ideal gas. Which of the following curves best represents the variation of pressure as a function of volume?
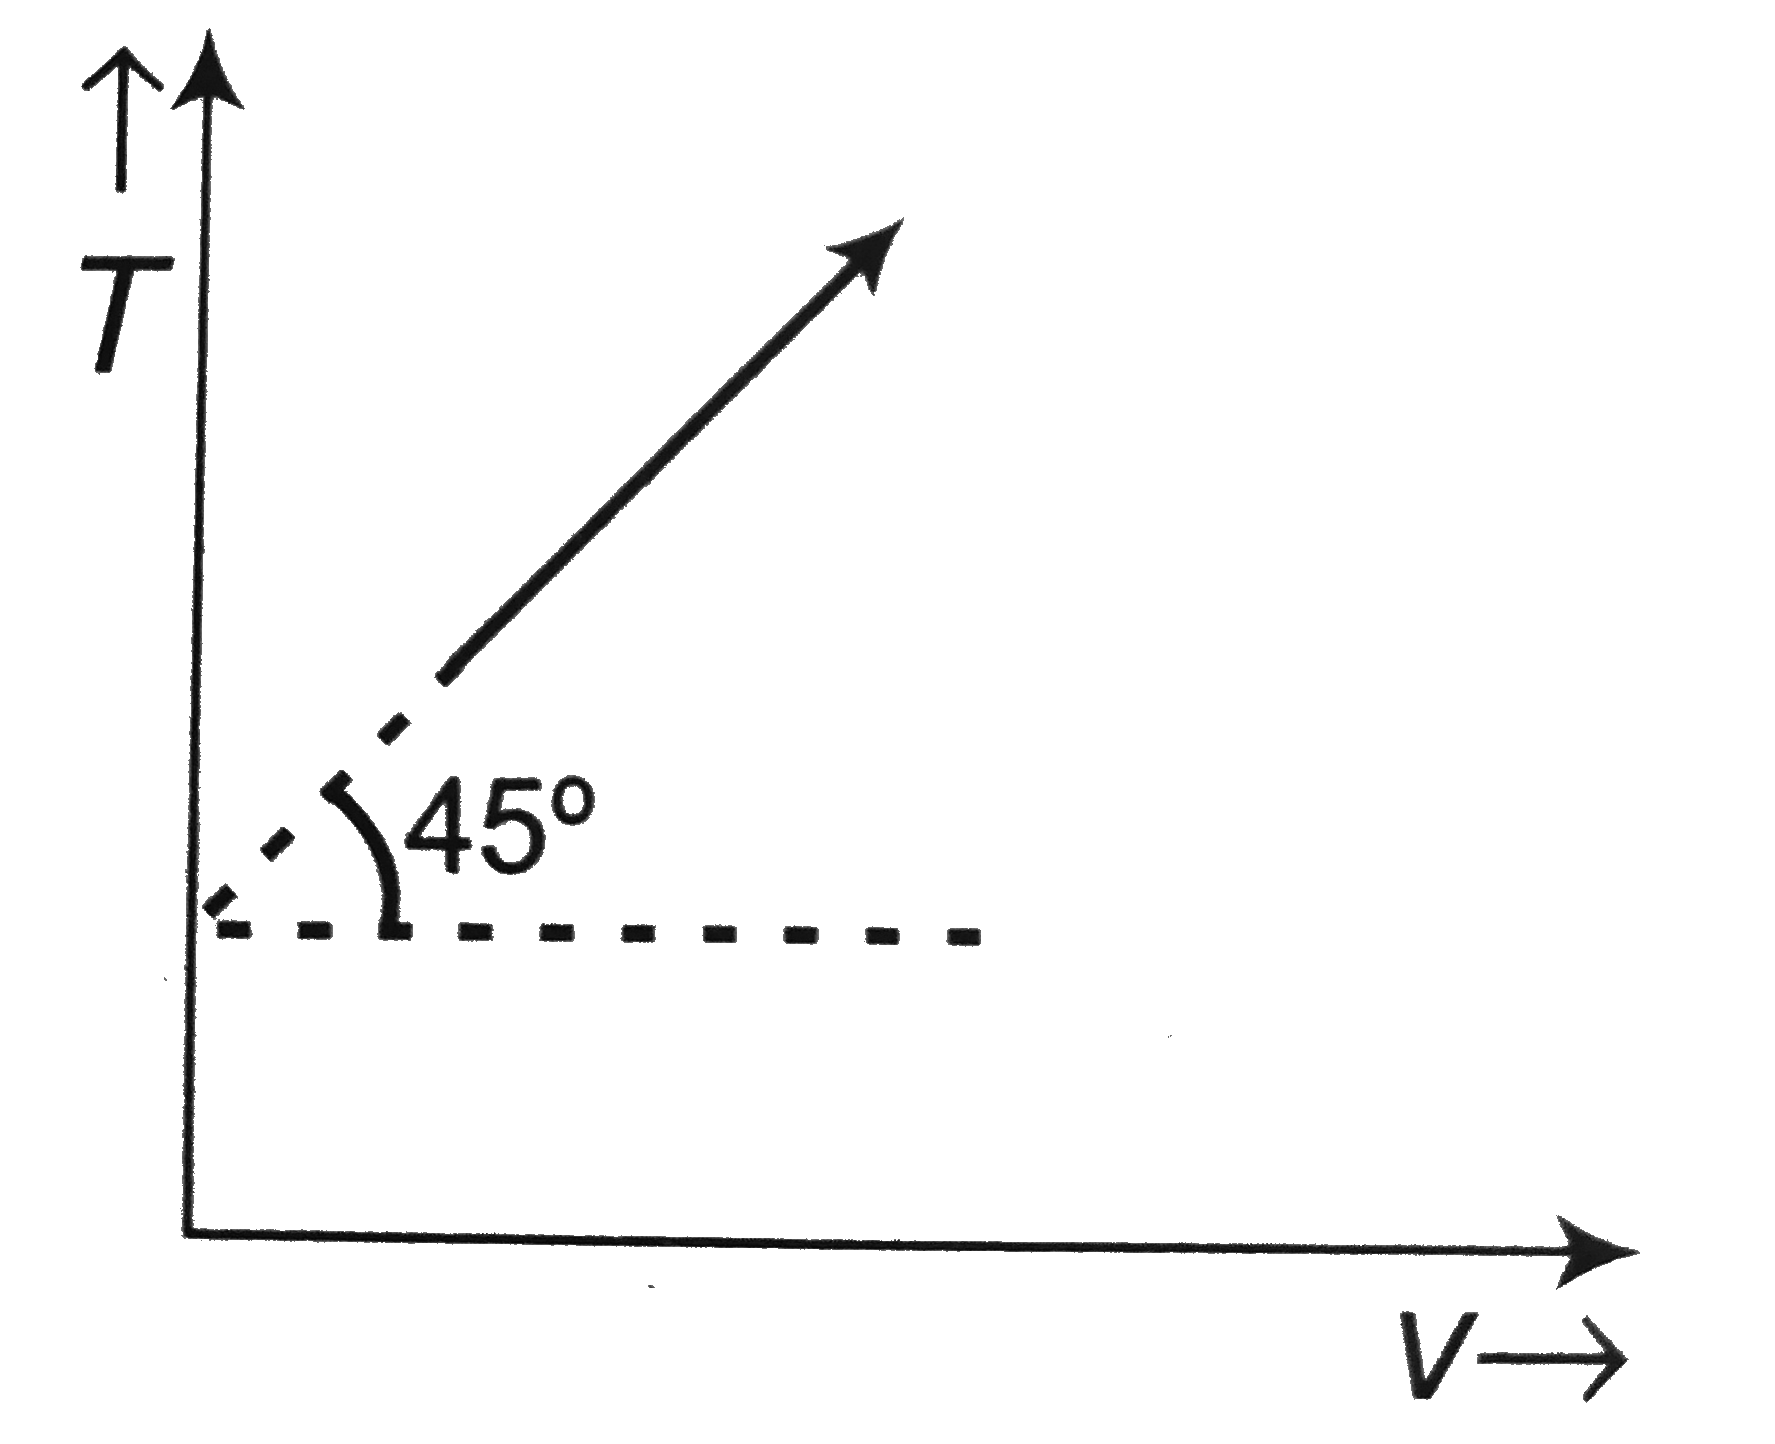
View SolutionThe given curve represents the variation of temperature as a function of volume for one mole of an ideal gas. Which of the following curves best represents the variation of pressure as a function of volume?

View Solution
