The given curve shows enzymatic activity with relation to three conditions (pH, temperature & substrate concentration) What do the two axes (x & y) represent? 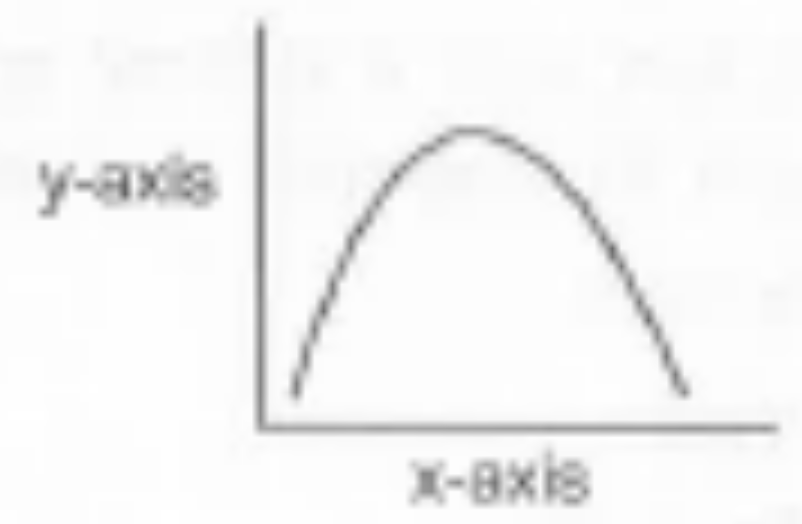
Step by step video & image solution for The given curve shows enzymatic activity with relation to three conditions (pH, temperature & substrate concentration) What do the two axes (x & y) represent? by Biology experts to help you in doubts & scoring excellent marks in Class 12 exams.
Updated on:21/07/2023Topper's Solved these Questions
Similar Questions
The curve given below show enzymatic activity with relation to three conditions (pH, temperature and substrate concentration)
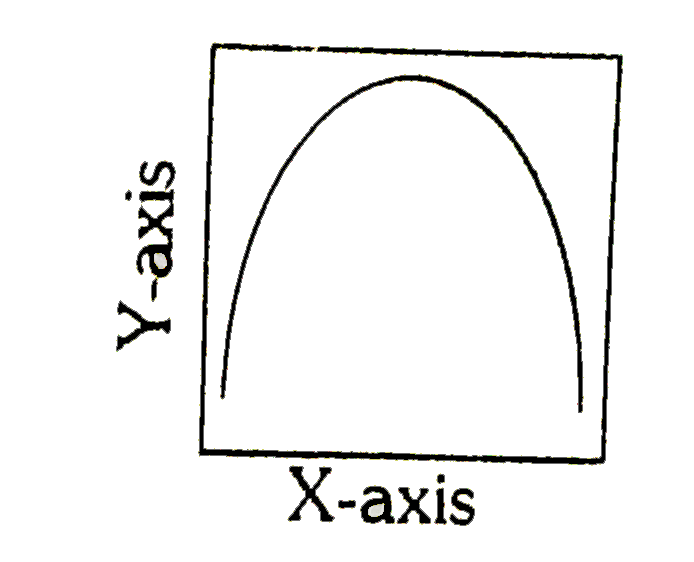
What do the two axises (x and y) represent
View SolutionThe curve given below show enzymatic activity with relation to three conditions (pH, temperature and substrate concentration)

What do the two axises (x and y) represent
View Solution
Knowledge Check
Which of the following graphs shows the relationship between the rate of an enzymatic activity and substrate concentration (S) ?
A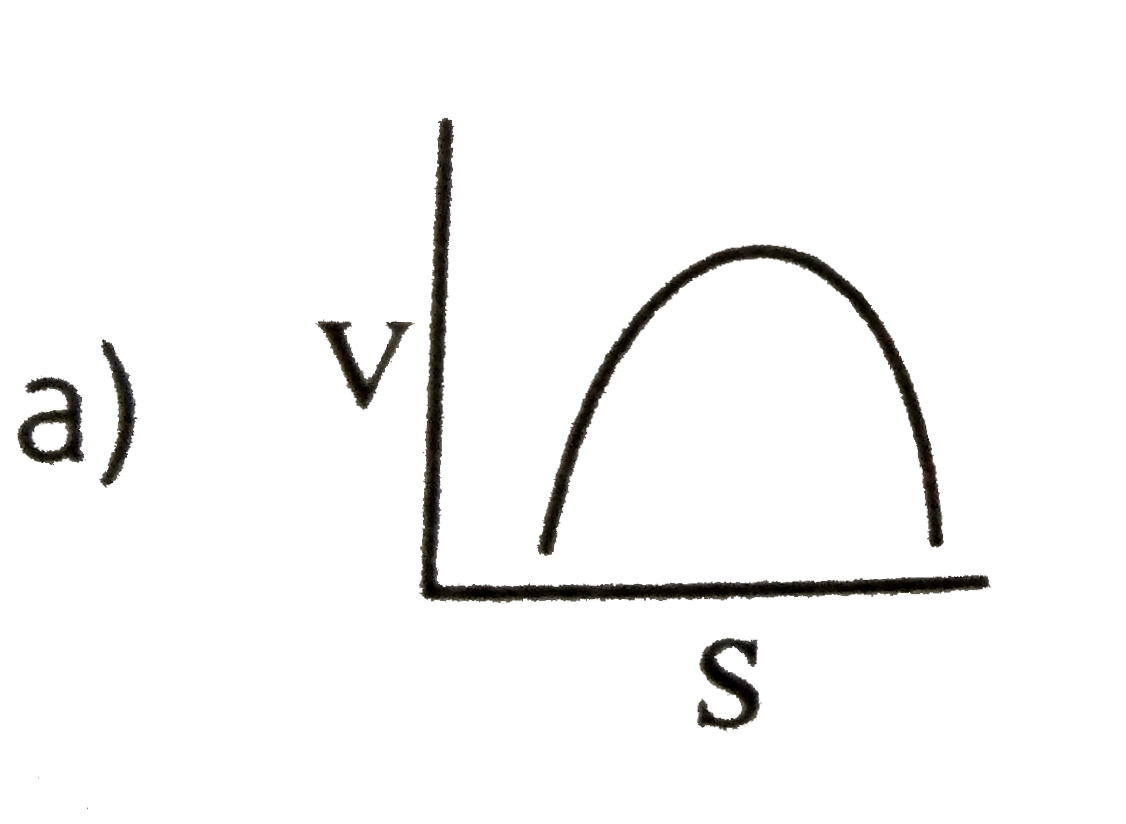 B
B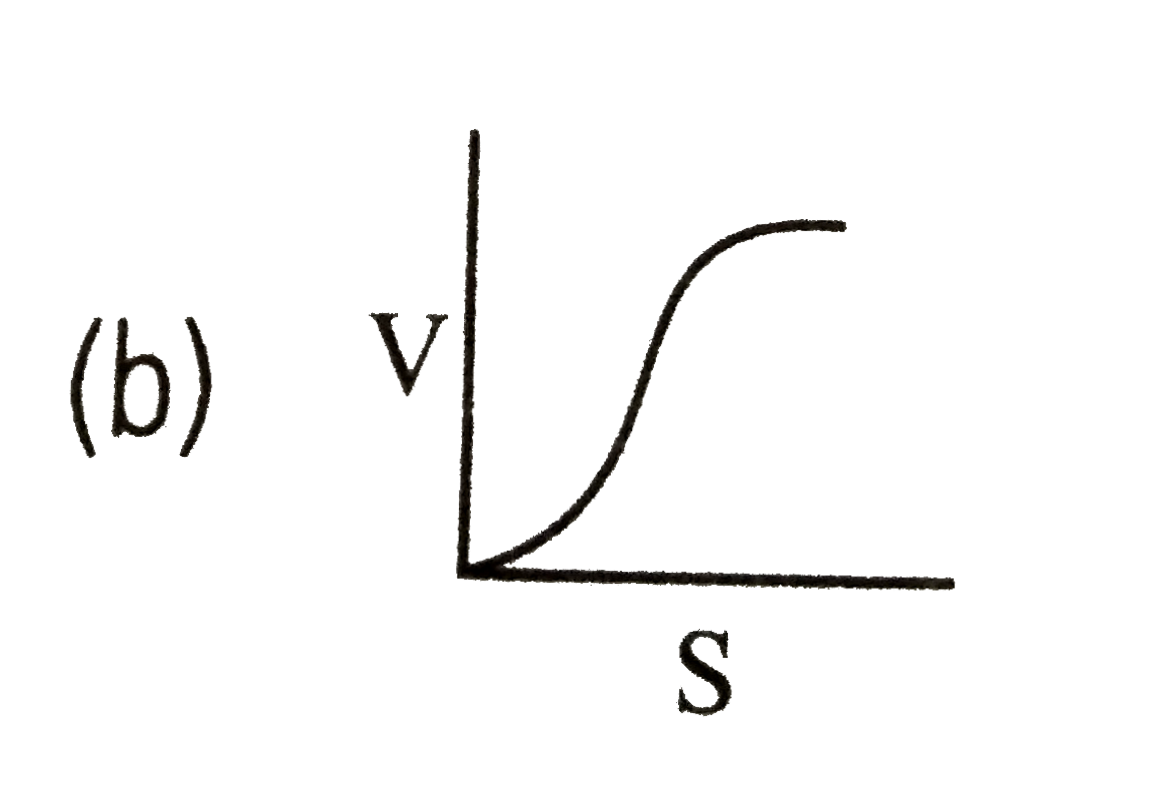 C
C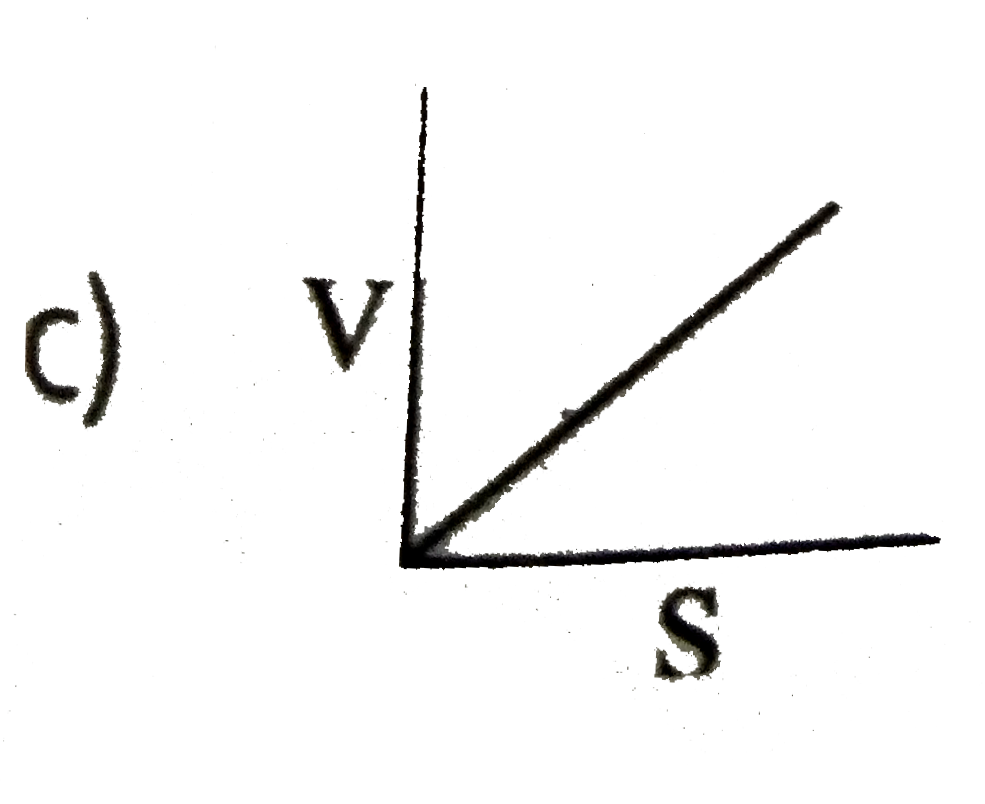 D
D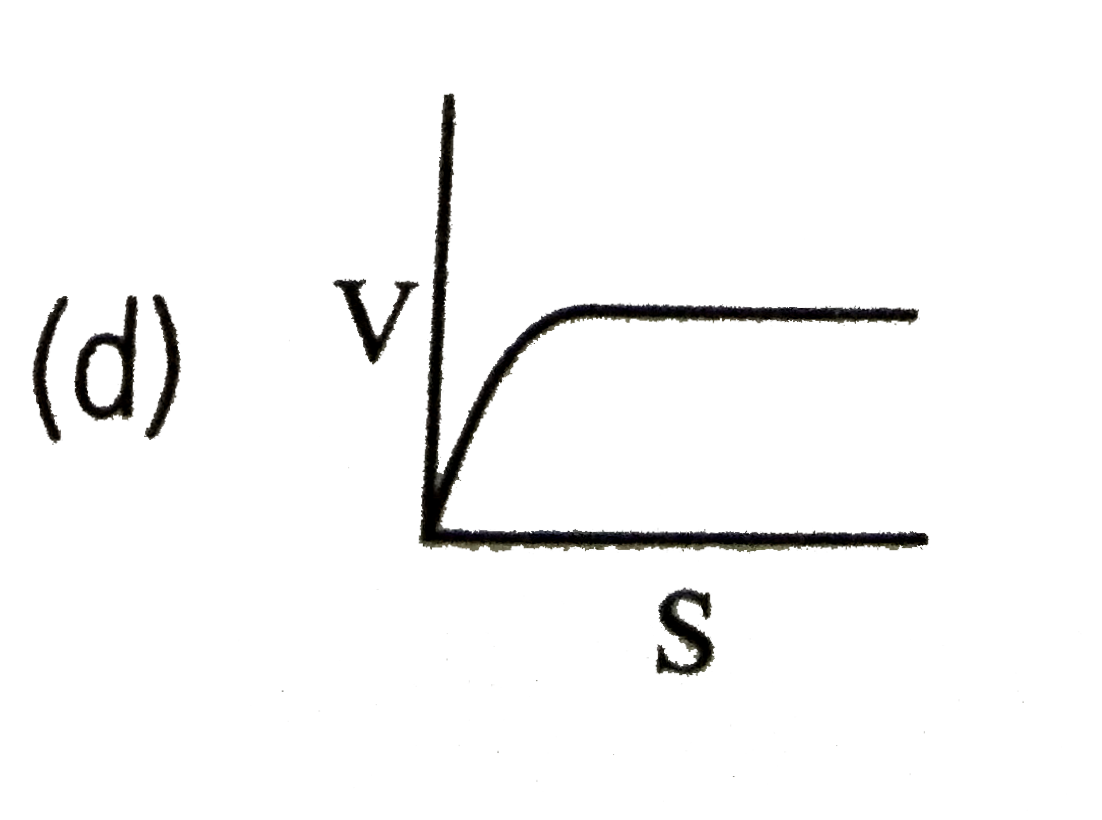
The given diagram shows a blood capillary in close contact with structure Y. The relative concentration (in units) of carbon dioxide (CO2) and oxygen (O2) are given at three different sites.
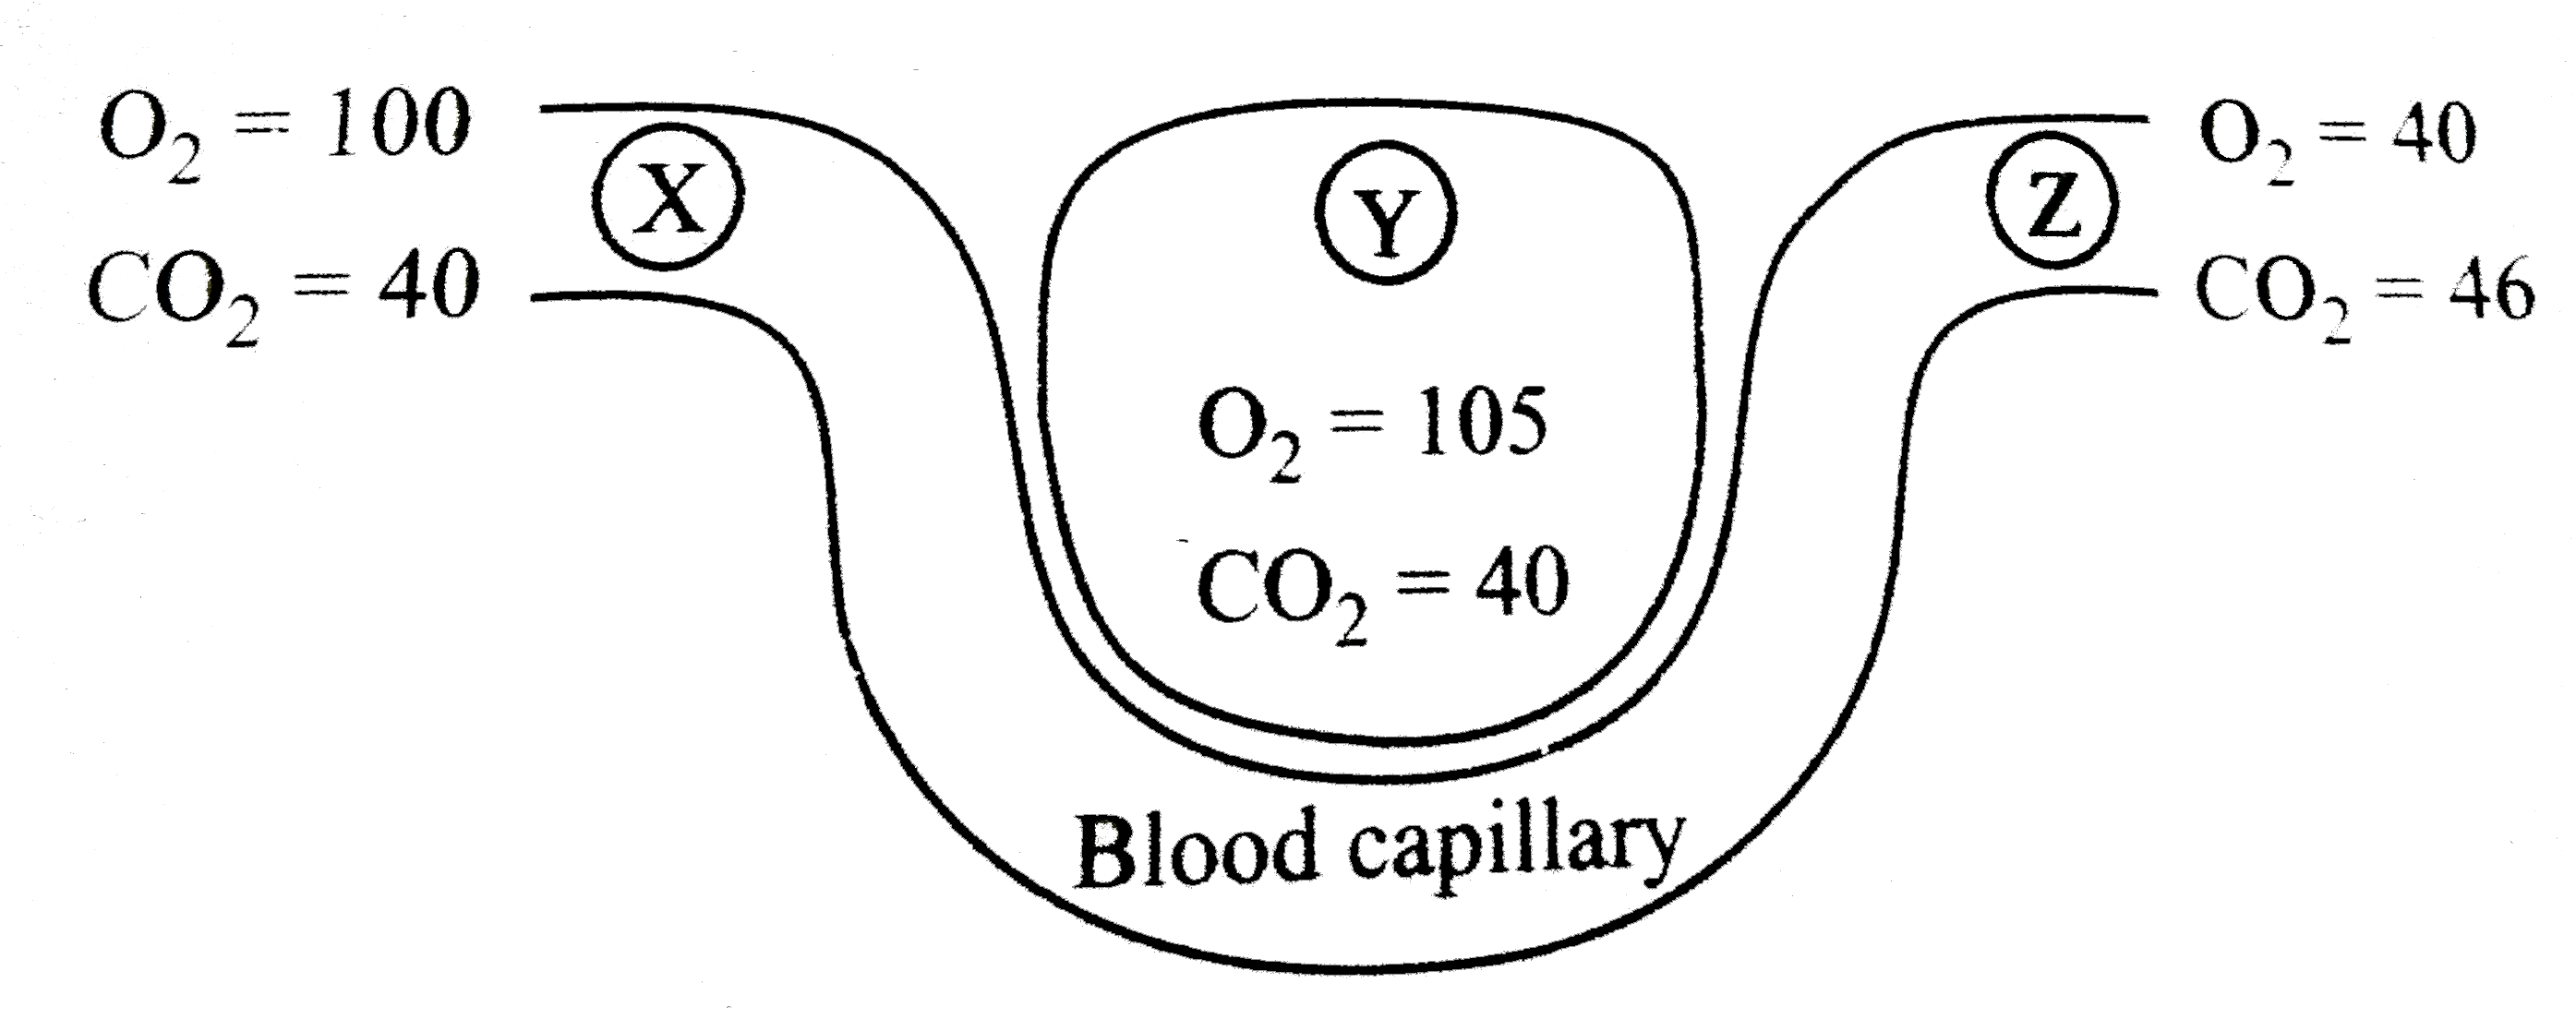
Which of the following statements is correct ?Aa) Y is an alveolus and blood flow is from X to ZBb) Y is an alveolus and blood flow is Z to XCc) Y is a muscle and blood flow is from X to ZDd) Y is a muscle and blood flow is from Z to X
the curve given below shows wnzymatic acitvity with relation to three conditions (pH , temperature and substrate concentration ).
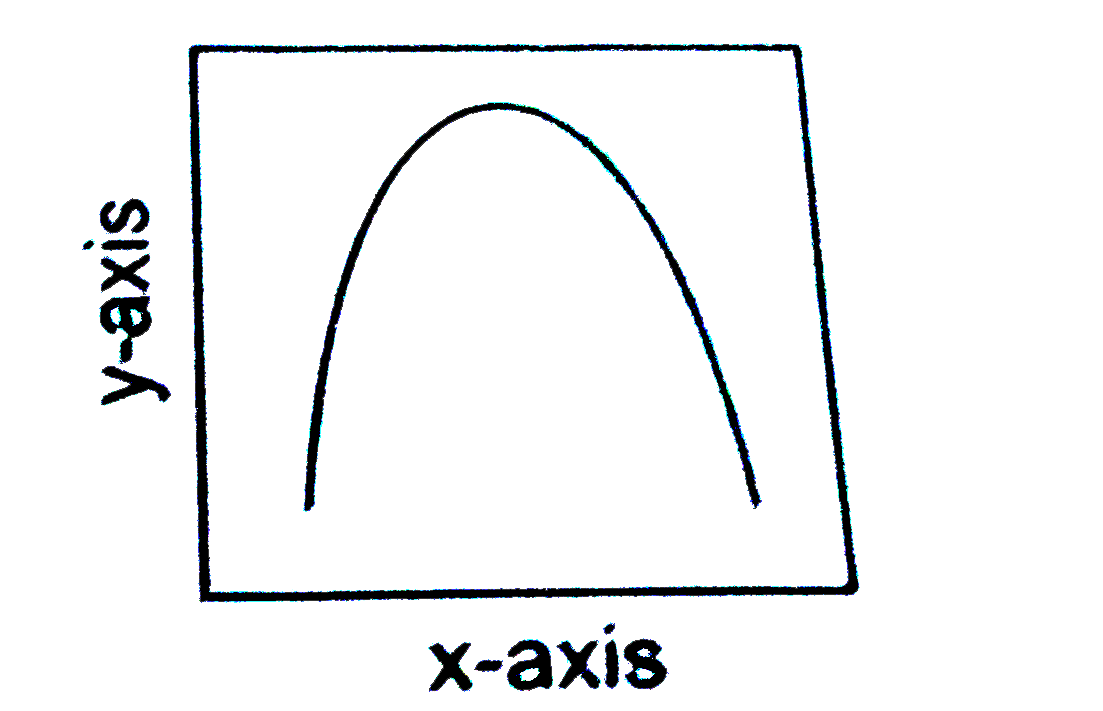
what do the two axes ( x and y) represent ?
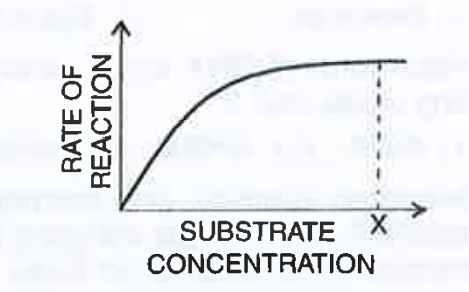
View SolutionThe given graph is showing the relationship between the rate of enzyme reaction and concentration of substrate. At concentration of substrate greater than X, the
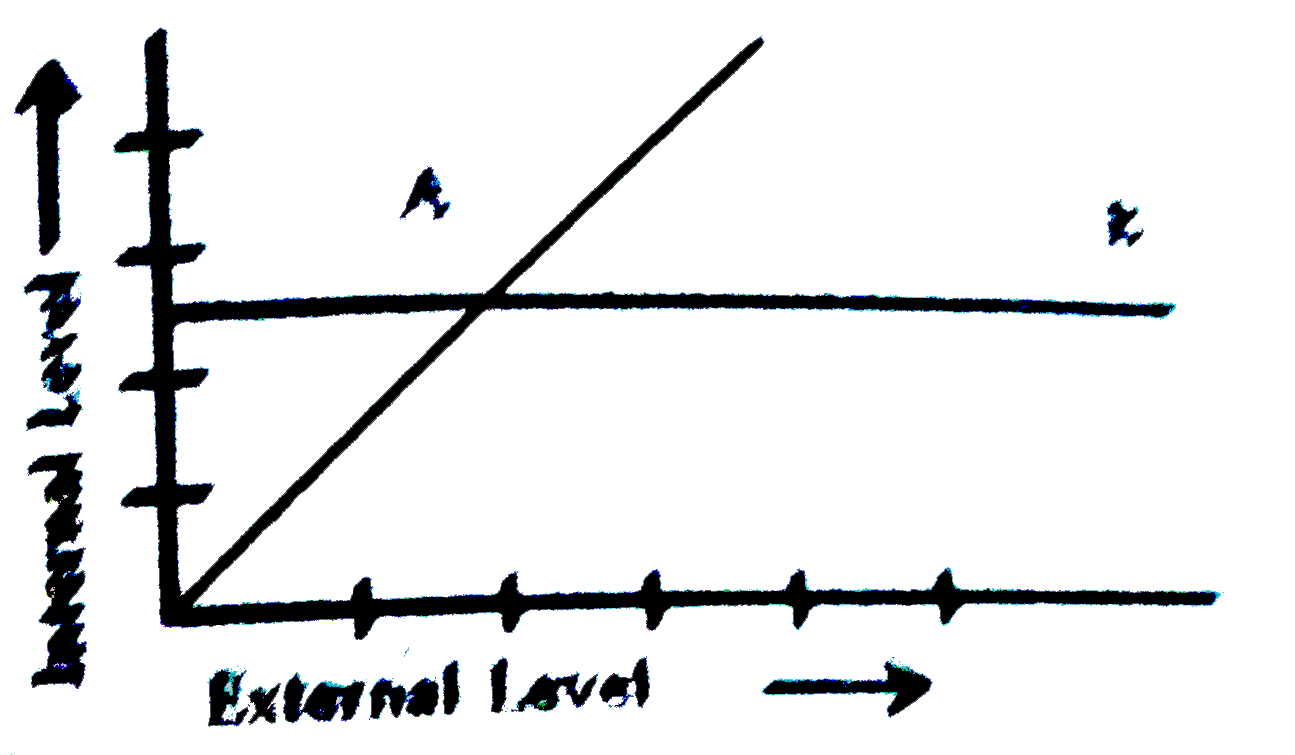
View Solution(a) The graph given below represents the organisms response to temperature as an environmental condition.
(i) Which one of the two lines represents conformers and why ?
(ii) What does the other line in the graph represent and why ?
(b) Mention the different adaptations the parasites have evolved with, to be able to successfully complete their life cycles in their hosts.
View SolutionWhat is the relation between three types of molecular speeds at a given temperature?
View SolutionFind the equation of the line which satisfy the given conditions : Write the equations for the x and y-axes.
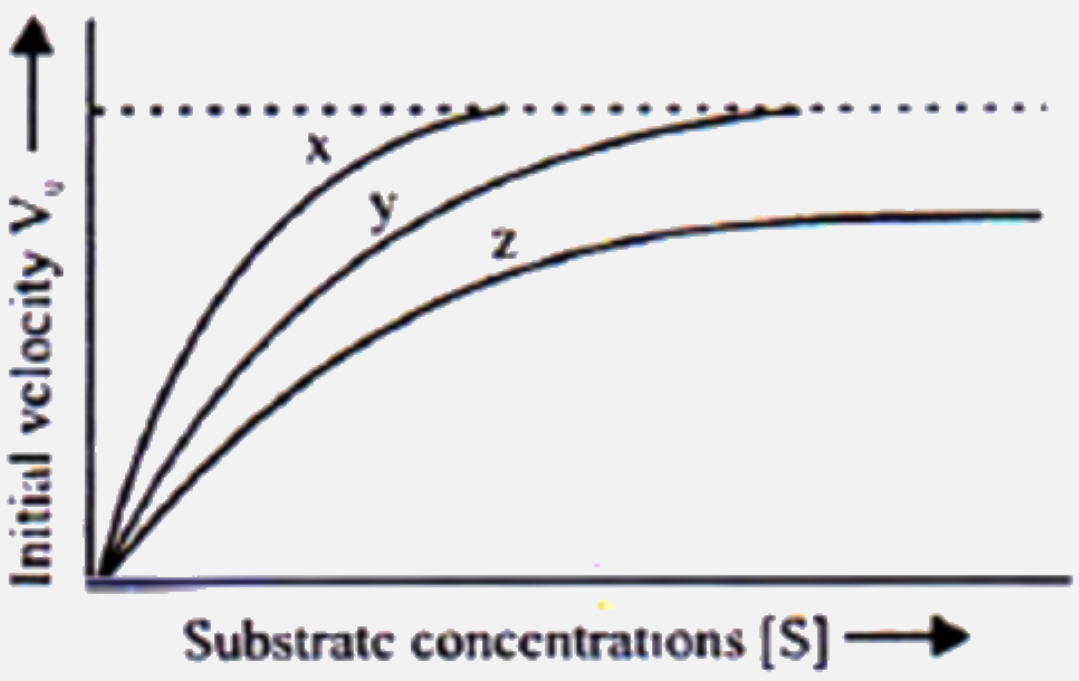
View SolutionThe Given figure shows three velocity-substrate concentration curves of an enzyme reaction. What do the curves X Y and Z depict respectively ?
View Solution
