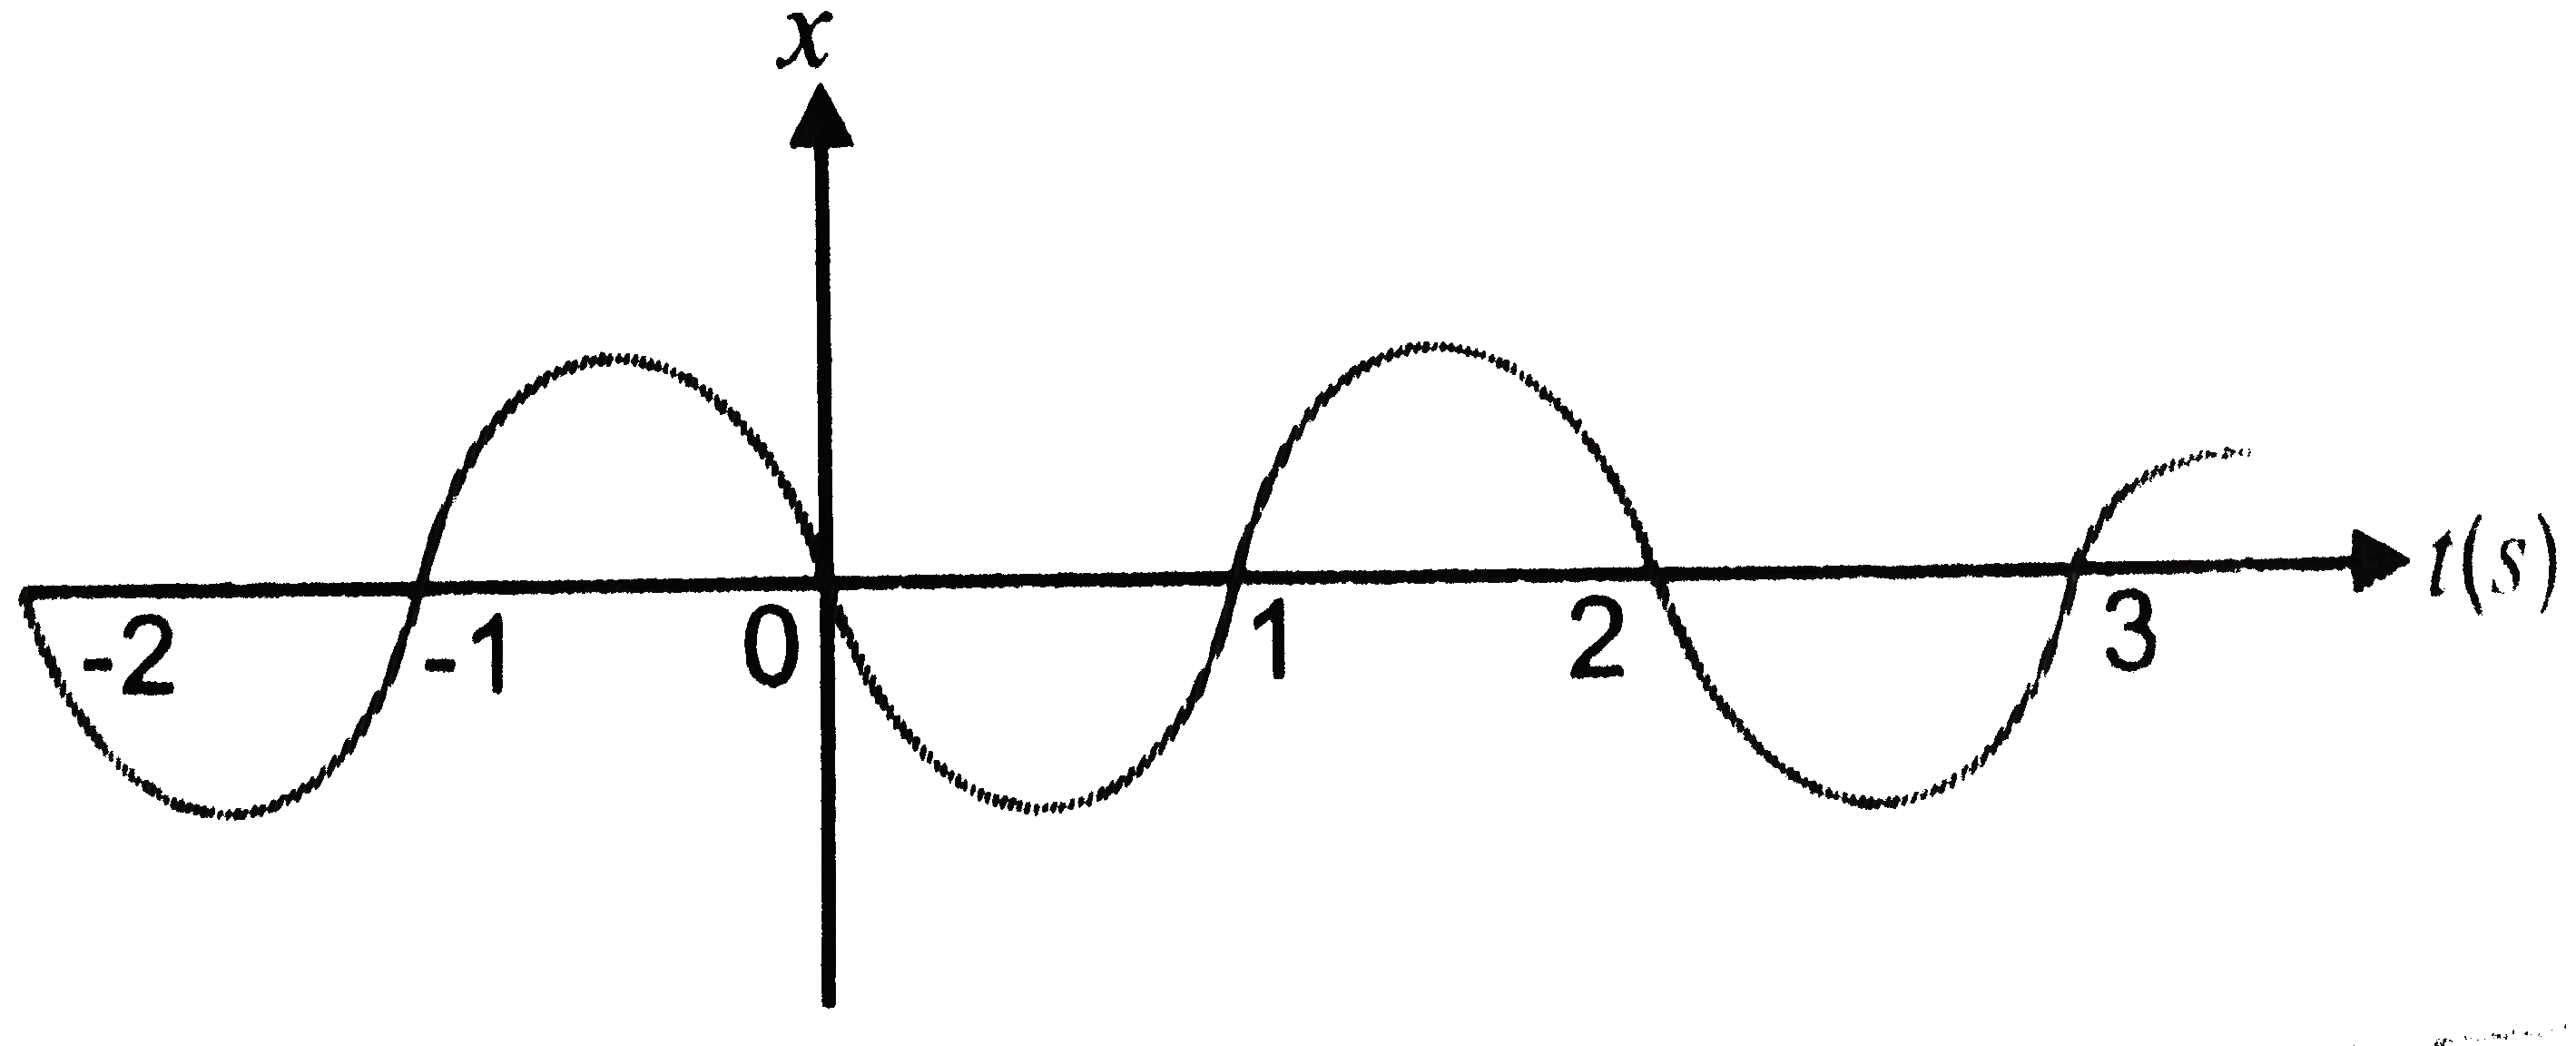
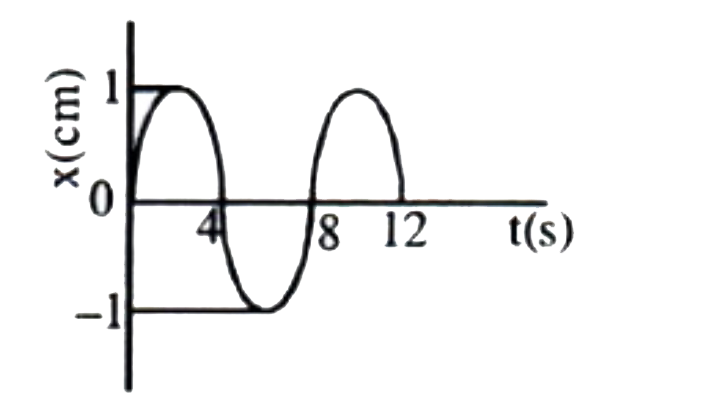
Figures gives the x - t plot of a particle executing one-dimensional simple harmonic motion. (You will learn about this motion in more detail in Chapter 14). Give the signs of position, velocity and acceleration variables of the particle at t = 0.3 s, 1.2 s, -1.2 s.

In the S.H.M. acceleration a=ω2x, where ω (i.e., angular frequency) is constant.
i) At time t = 0.35, x is negative, the slope of x - t graph plot is negative, hence position and velocity are negative.
Since a=ω2x, hence, acceleration is positive.
ii) At time 1 = 1.2s, x is positive, the slope of x - t plot is also positive hence position and velocity are positive. Since a=−ω2x, hence acceleration is negative.
iii) At t = 1.2S, x is negative, the slope of x - t plot is also negative. But since both x and t are negative here, hence velocity is positive. Finally acceleration .a. is also positive.
Similar Questions
Fig gives the x−t plot of a particle executing one dimensional simple harmonic motion. Give the signs of position, velocity and acceleration variables of the particles at t=0.3s, 1.2s,−1.2s,
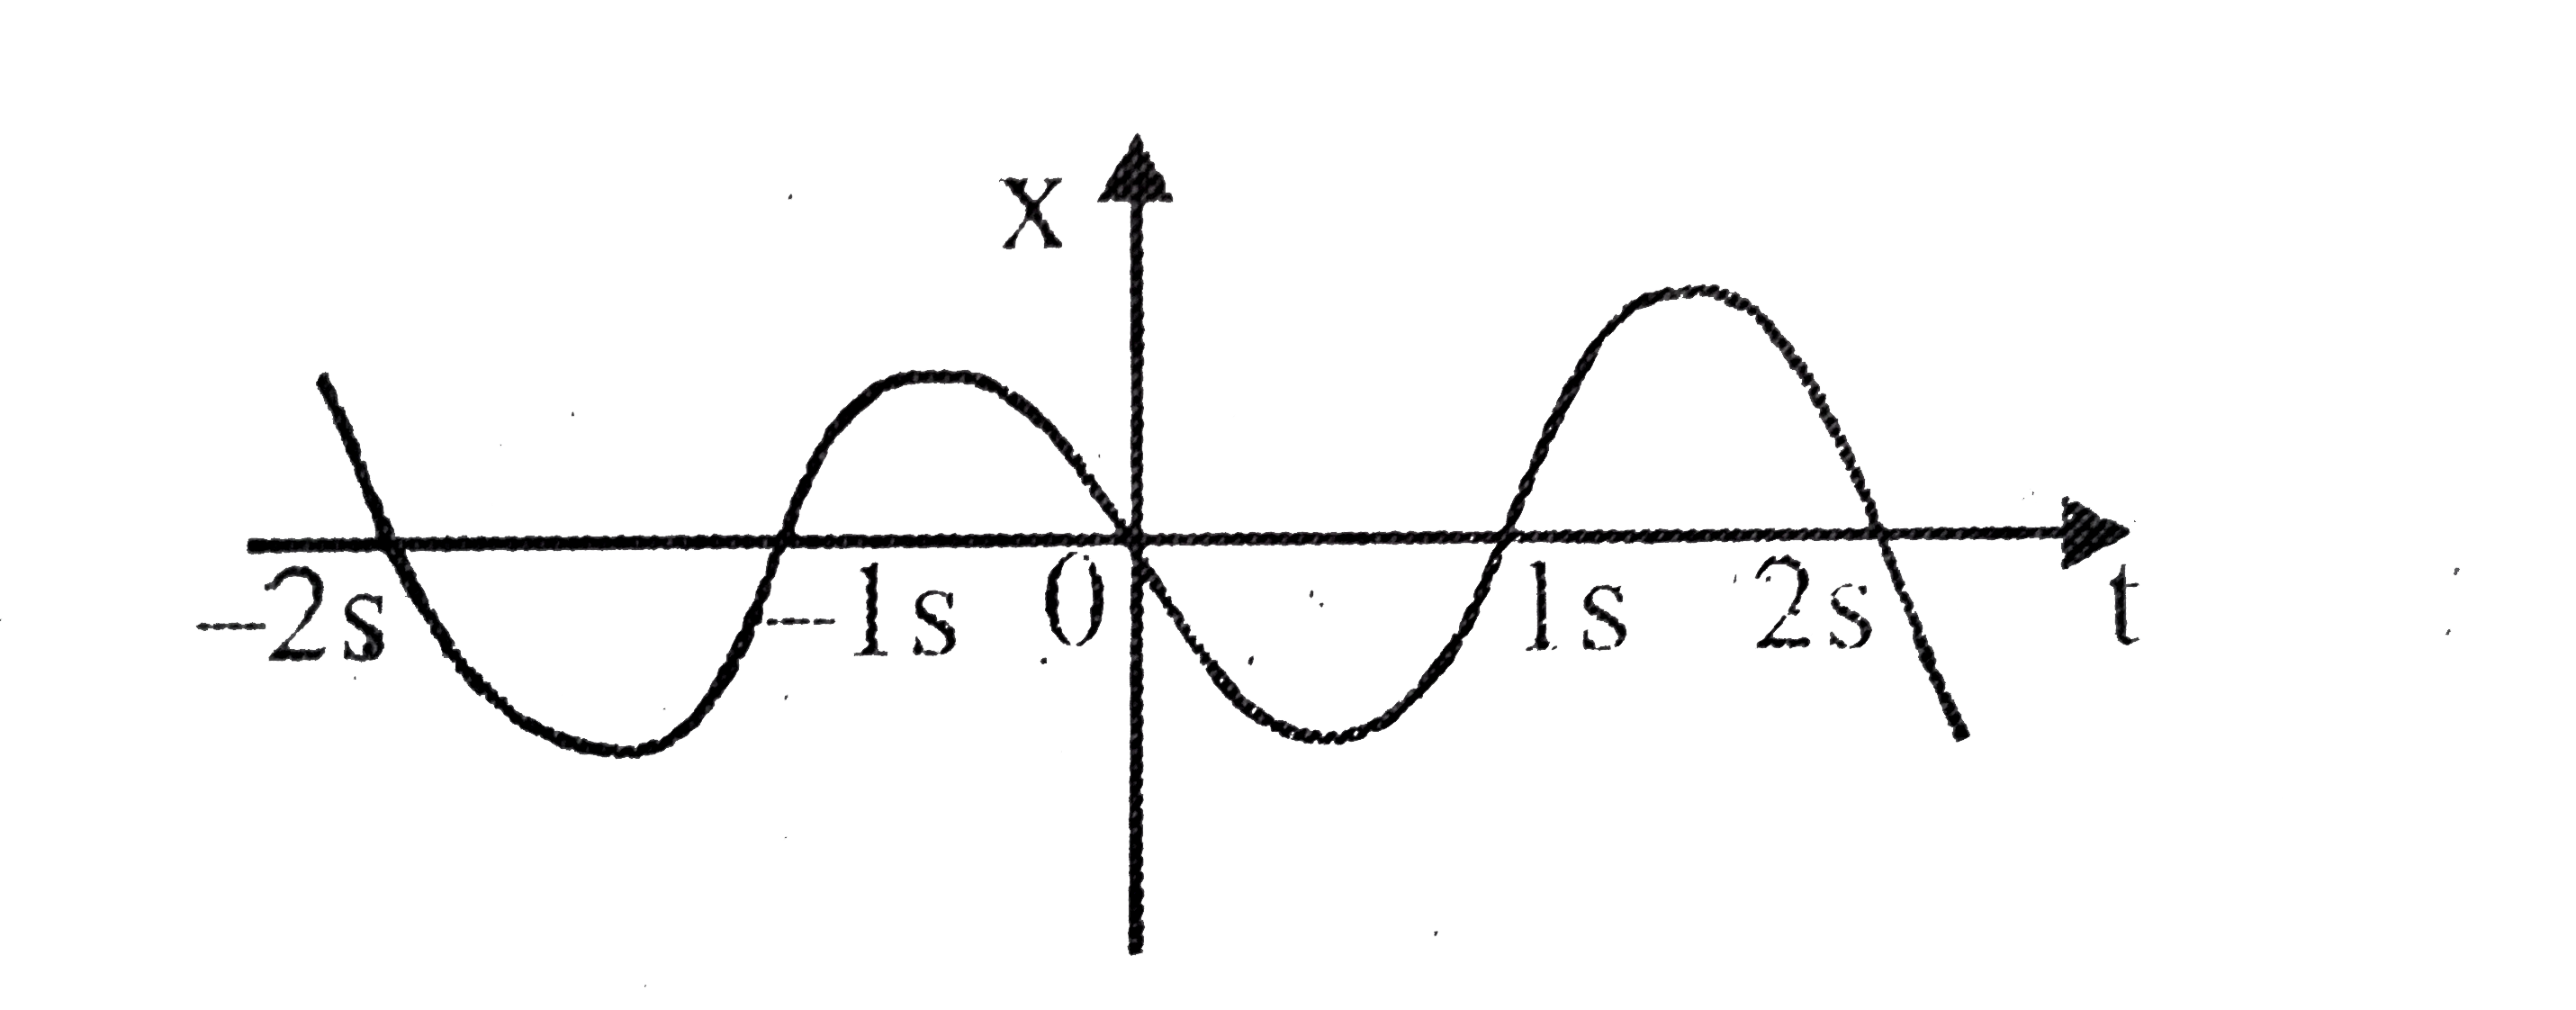
View SolutionFigure gives the x-t plot of a particle is one dimensional motion. Give the signs of position, velocity and acceleration of the particle at t = 0.3s
View Solution
Knowledge Check
The x-t graph of a particle undergoing simple harmonic motion is shown below. The acceleration of the particle of t=4/3s is
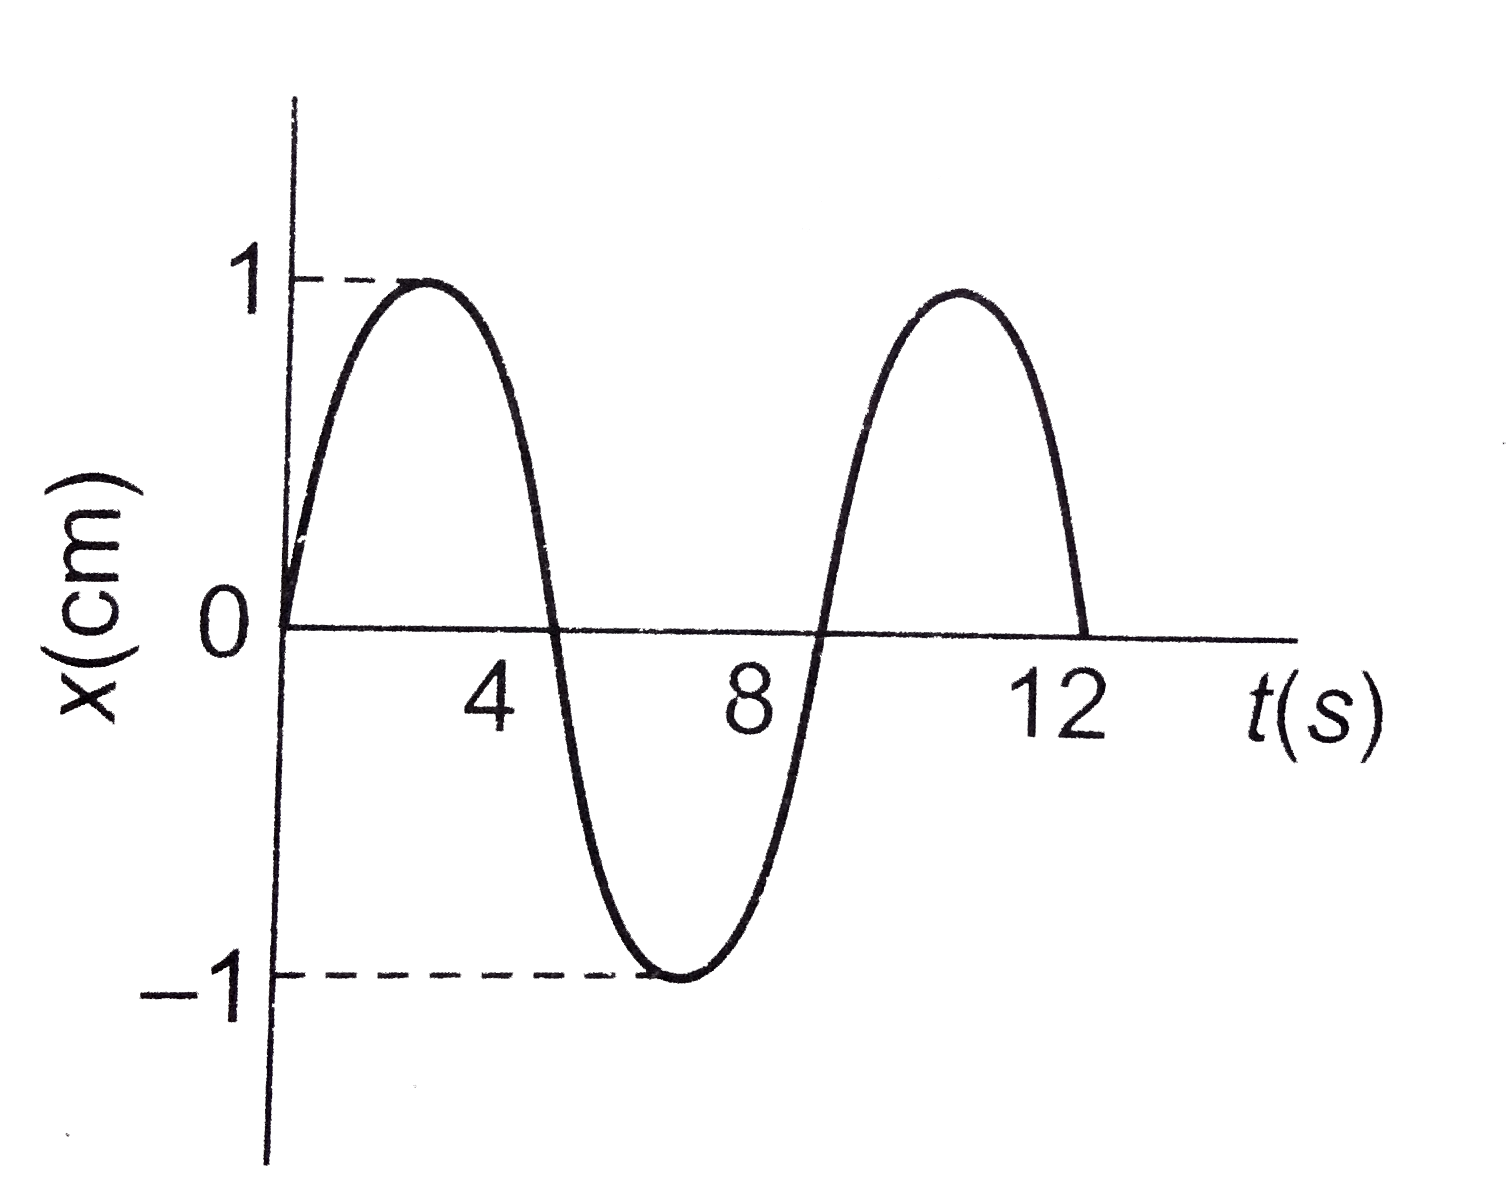 A√332π2cm/s2B−π232cm/s2Cπ232cm/s2D−√332π2cm/s2
The x−t graph of a particle undergoing simple harmonic motion is shown in figure. Acceleration of particle at t=4/3s is
 A√332π2cm/s2B−π232cm/s2Cπ232cm/s2D−√332π2cm/s2
The x−t graph of a particle undergoing simple harmonic motion is shown below. The accelertion of the particle at t=4/3s is
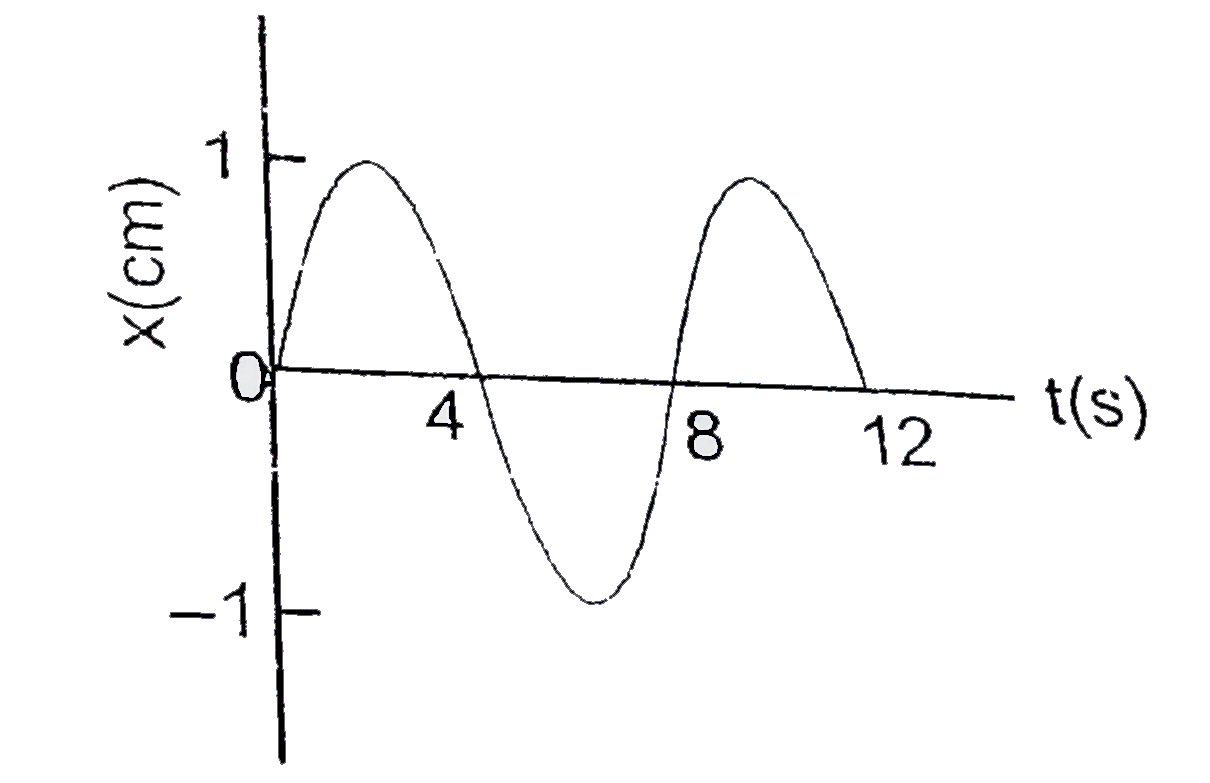 A√332π2cm/s2B−π232cm/s2Cπ232cm/s2D−√332π2cm/s2
Fig 2 (NCT).8 gives the x−t plot of a particle executing one dimensional simle harmonic motion. Give the signs of position, velocity and acceleration variables of the particles at t=0.3s, 1.2s,−1.2s,

View SolutionThe x−t graph of a particle undergoing simple harmonic motion is shown in figure. Acceleration of particle at t=4/3s is

View SolutionThe x−t graph of a particle undergoing simple harmonic motion is shown in figure. Acceleration of particle at t=4/3s is

View SolutionThe x-t graph of a particle undergoing simple harmonic motion is shown below. The acceleration of the particle at t=23s is
View SolutionThe x-t graph of a particle undergoing simple harmonic motion is shown below. The acceleration of the particle at t=23s is

View Solution
