Fill in the blanks: In a given data three angles are in the ratio 2:3:4. The angle of the largest sector when the given data is represented in pie diagram is……….Solution in Telugu
Step by step video & image solution for Fill in the blanks: In a given data three angles are in the ratio 2:3:4. The angle of the largest sector when the given data is represented in pie diagram is………. by Maths experts to help you in doubts & scoring excellent marks in Class 7 exams.
Updated on:21/07/2023Topper's Solved these Questions
- DATA HANDLINGBook:NCERT TELUGUChapter:DATA HANDLINGExercise:Example
Explore 23 Videos
- DATA HANDLINGBook:NCERT TELUGUChapter:DATA HANDLINGExercise:Try This
Explore 19 Videos
- CONSTRUCTION OF TRIANGLESBook:NCERT TELUGUChapter:CONSTRUCTION OF TRIANGLESExercise:EXERCISE -5
Explore 5 Videos
- EXPONENTSBook:NCERT TELUGUChapter:EXPONENTSExercise:EXERCISE-3
Explore 4 Videos
Similar Questions
Earnings (in rupees) of a vegetable vendor in a week are ₹200, ₹150, ₹180, ₹300, ₹160, ₹170 and ₹170. Find his average earning, per day.
View SolutionLook at your school information board. Do you find any data tables there? Find out who uses this data.
View SolutionConstruct △ ABC in which AB = 4.5 cm, AC = 4.5 cm and ∠B=50∘. Check whether you get two triangles.
View SolutionExpress the number appearing in the following statements in standard form. The distance between the Earth and the Moon is approximately 384,000,000m.
View SolutionPie-diagram or a pie-chart is a poctirial representation of the numerical data by non-intersecting adjacent sectors of the circle such that area of sector is proportional to the magnitude of the data represented by the sector.
View SolutionConsider the following statements :
1. Pie diagrams are suitable for catagorical data.
2. The arc length of a sector of a pie diagram is proportional to the value of the component represented by the sector.
Which of the statements given above is/are correct/
View SolutionIf the number of educated persons is 65% of the population, then in Pie diagram…………angle is needed to mark the sector (Fill in the blank)
View SolutionFill in the blanks: In a class there are 36 boys and 24 girls the sector angle showing the boys in pie diagram is……….
View SolutionA pie-diagram representing the following data is_____

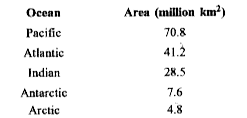
View SolutionThe following table gives the areas of the oceans of the word :

A pie diagram of this data is to be drawn. What is the angle which the sector representing Pacific Ocean subtends at the centre ?
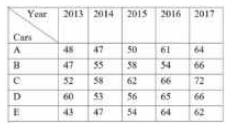
View SolutionThe table shows the production of different types of cars (in thousands).
 In the data related to the production of type D cars in represented by a pie chart, then the central angle of the sector representing production of cars in 2015 will be:
यदि D प्रकार की कारों से संबंधित आंकड़ों को एक पाई-चार्ट में प्रस्तुत किया जाए, तो 2015 में कारों के उत्पादन को दर्शाने वाले खंड का केंद्रीय कोण होगा :
View SolutionThe table shows the production of different types of cars (in thousands).
यह तालिका एक कंपनी द्वारा 5 वर्षों में अलग-अलग कारों के उत्पादन (हज़ार में ) को दर्शाती है | If the data related to the production of type D cars is represented by a pie chart, then the central angle of the sector representing the production of
cars in 2013 will be:
यदि D प्रकार की कारों के उत्पादन से संबंधित आंकड़ों को एक पाई-चार्ट में प्रस्तुत किया जाए, तो 2013 में कारों के उत्पादन को दर्शाने वाले खंड का केंद्रीय कोण होगा :
View SolutionThe table shows the production of different types of cars (in thousands).

If the data related to the production of type D cars is represented by a pie chart, then the central angle of the sector representing the production of cars in 2016 will be:
View SolutionThe table shows the production of different types of cars (in thousands).
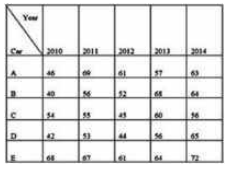
यह तालिका एक कंपनी द्वारा अलग-अलग कारों के उत्पादन (हज़ार में ) को दर्शाती है | If the data related to the production of type C cars is represented by a pie-chart, then the central angle of the sector representing production of cars in 2012 will be:
यदि C प्रकार की कारों के उत्पादन से संबंधित आंकड़ों को एक पाई-चार्ट में प्रस्तुत किया जाए, तो 2012 में कारों के उत्पादन को दर्शाने वाले खंड का केंद्रीय कोण होगा :
View SolutionThe table shows the production of different types of cars (in thousands).

If the data related to the production of type D cars is represented by a pie chart, then the central angle of the sector representing the production of cars in 2016 will be:
View Solution
