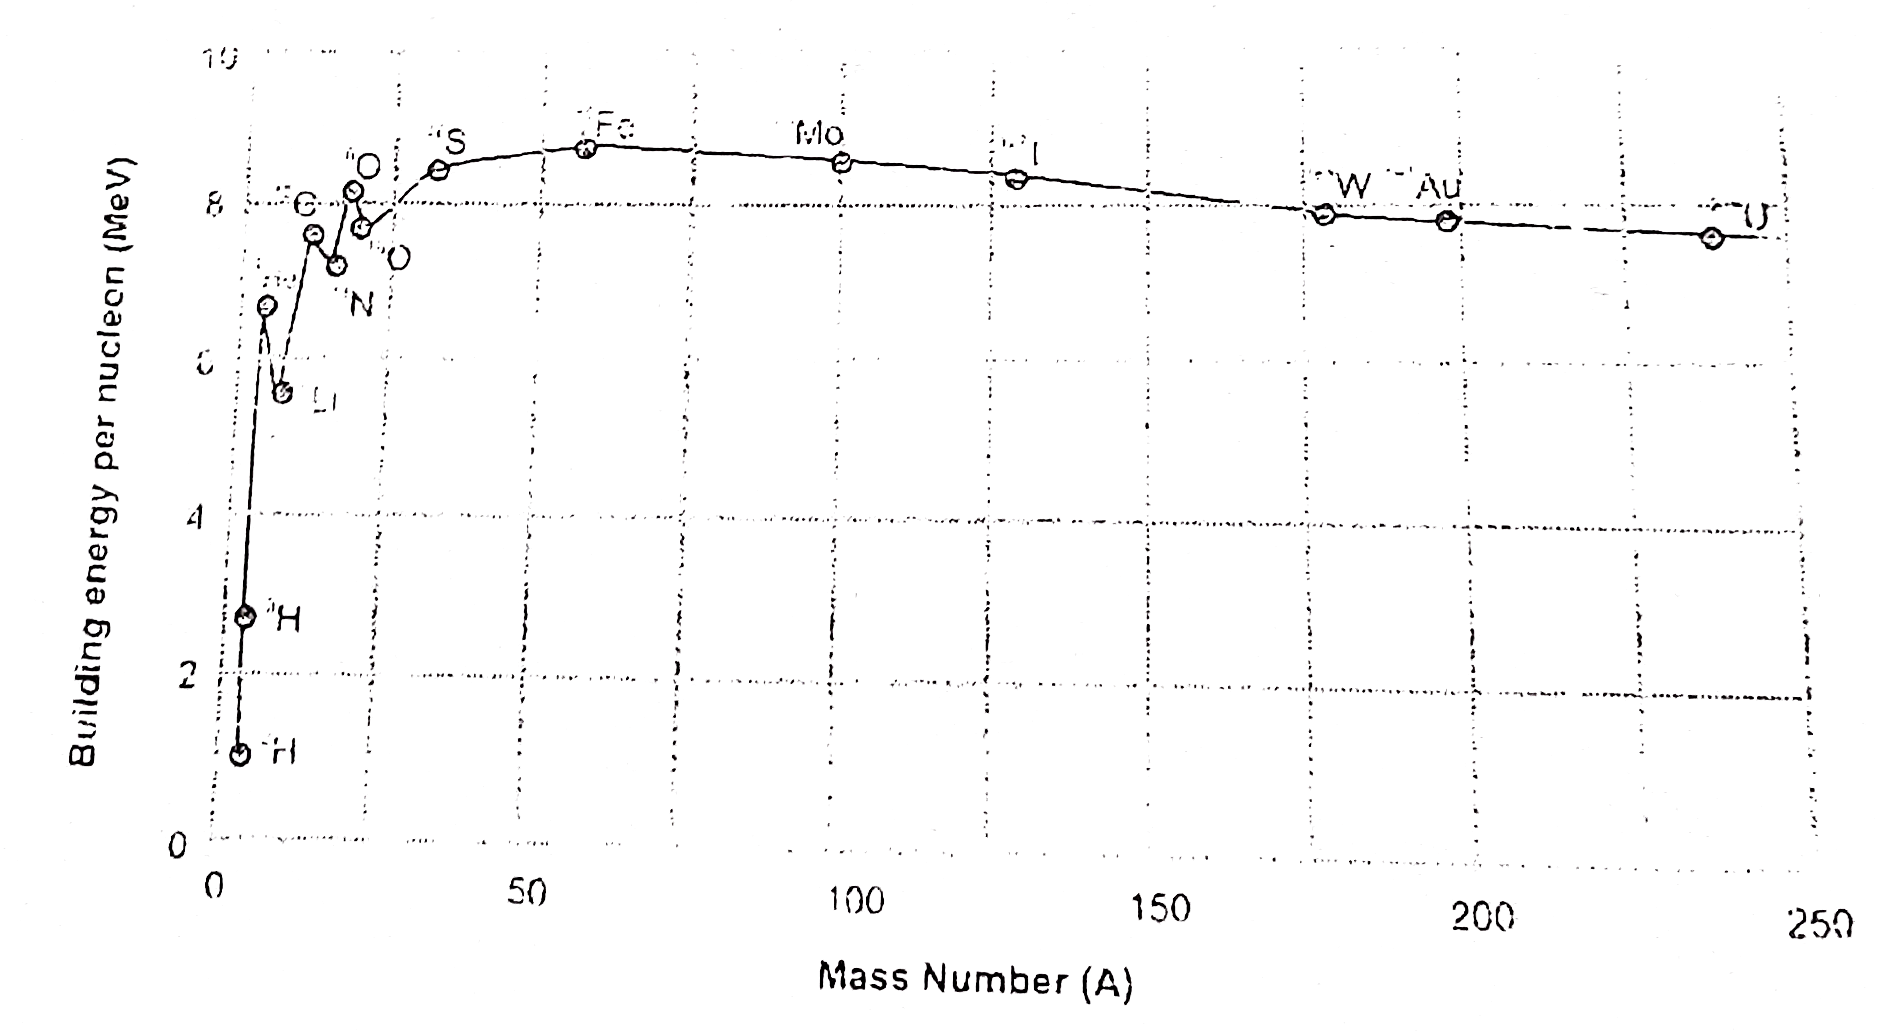
Draw a graph showing variation of binding energy per nucleon with mass number for different NUCLEI. Mark the region where the NUCLEI are (a) most stable (b) prone to fusion (c) Prone to fission
Refer 13.5.3
Similar Questions
Knowledge Check
Maximum value of binding energy per nucleon for most stable nuclei is
A8MeVB8.8MeVC7.6MeVD1.1MeV
Draw a graph showing the variation of binding energy per nucleon with mass number of different nuclei. State two inferences from this graph.
View SolutionDraw the graph showing thervariation of binding energy per nucleon with mass number. Give therason for the decrease of binding energy per nucleon for nuclei with high mass numbers.

The binding energy per nucleon for nuclei with high mass number is low due to the large coulomb repulsion between the protons inside these nuclei.
View SolutionDraw a graph showing the variation of decay rate with number of active nuclei.
View SolutionDraw a graph showing the variation of decay rate with number of active nuclei.
View SolutionDraw a graph showing the variation of decay rate with number of active nuclei.
View SolutionVARIATION OF BINDING ENERGY OF PER NUCLEON WITH MASS NUMBER
View SolutionDraw the graph showing the variation of binding energy per nucleon with mass number. Give the reason for the decrease of binding energy per nucleon for nuclei with high mass numbers.
View Solution
