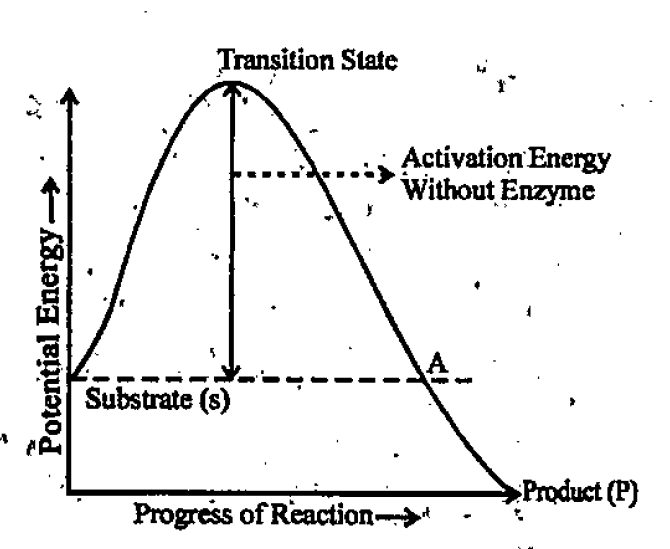
Progress of a chemical reaction and potential energy changes associated with it is plotted as curve
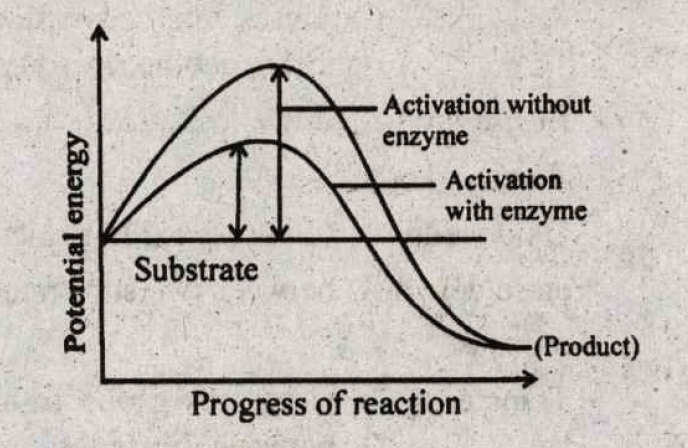
 a. What happens to the activation energy of the substrate when enzyme is added to the reaction system? B. Redraw the above graph and also plot another curve showing the progress of the reaction and associated potential energy change when enzyme is added to the system?
a.activation energy of the substrate decreases.

Similar Questions
Knowledge Check
The rate of a certain biochemical reaction c arried by enzymes in human body is 103 times faster than when it is carried in the laboratory. The activation energy of the reaction:
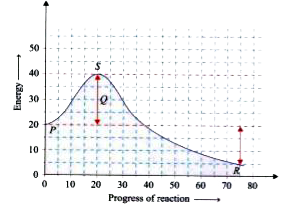
Ais zeroBis different in the two casesCis the same in the two casesDnone of these.For a chemical reaction, a plot of energy versus the progress of reaction can be represented as shown in the figure.

The following are true:AP=ER, Q = threshold energyBP=ER, Q = activation energyCR=Ep, S = activation energyDR=Ep, S = threshold energyThe rate of a certain biochemical reaction at physiological temperature (T) occurs 106 times faster with enzyme than without. The change in the reaction energy upon adding enzyme is :
A+RTB−RTC+6(2.303)RTD−6(2.303)RT
The rate of a certain biochemical reaction at physiological temperature (T) occurs 106 times faster with enzyme than without. The change in the reaction energy upon adding enzyme is :
View SolutionWhat is the effect of adding catalyst on free energy change (ΔG) of a reaction ?
View SolutionWhat is the effect of adding catalyst on free energy change (ΔG) of a reaction ?
View SolutionDraw a representative reaction curve for an exothermic reaction and (i) label the activation energies for the forward and reverse reaction (ii) enthalpy for the forward and reverse reactions. How will the curve change with the addition of a catalyst ?
View SolutionWhen the temperature of a reaction is raised from 300 K to 310 K, the reaction rate doubles. Determine the activation energy , Ea associated with the reaction.
View Solution
