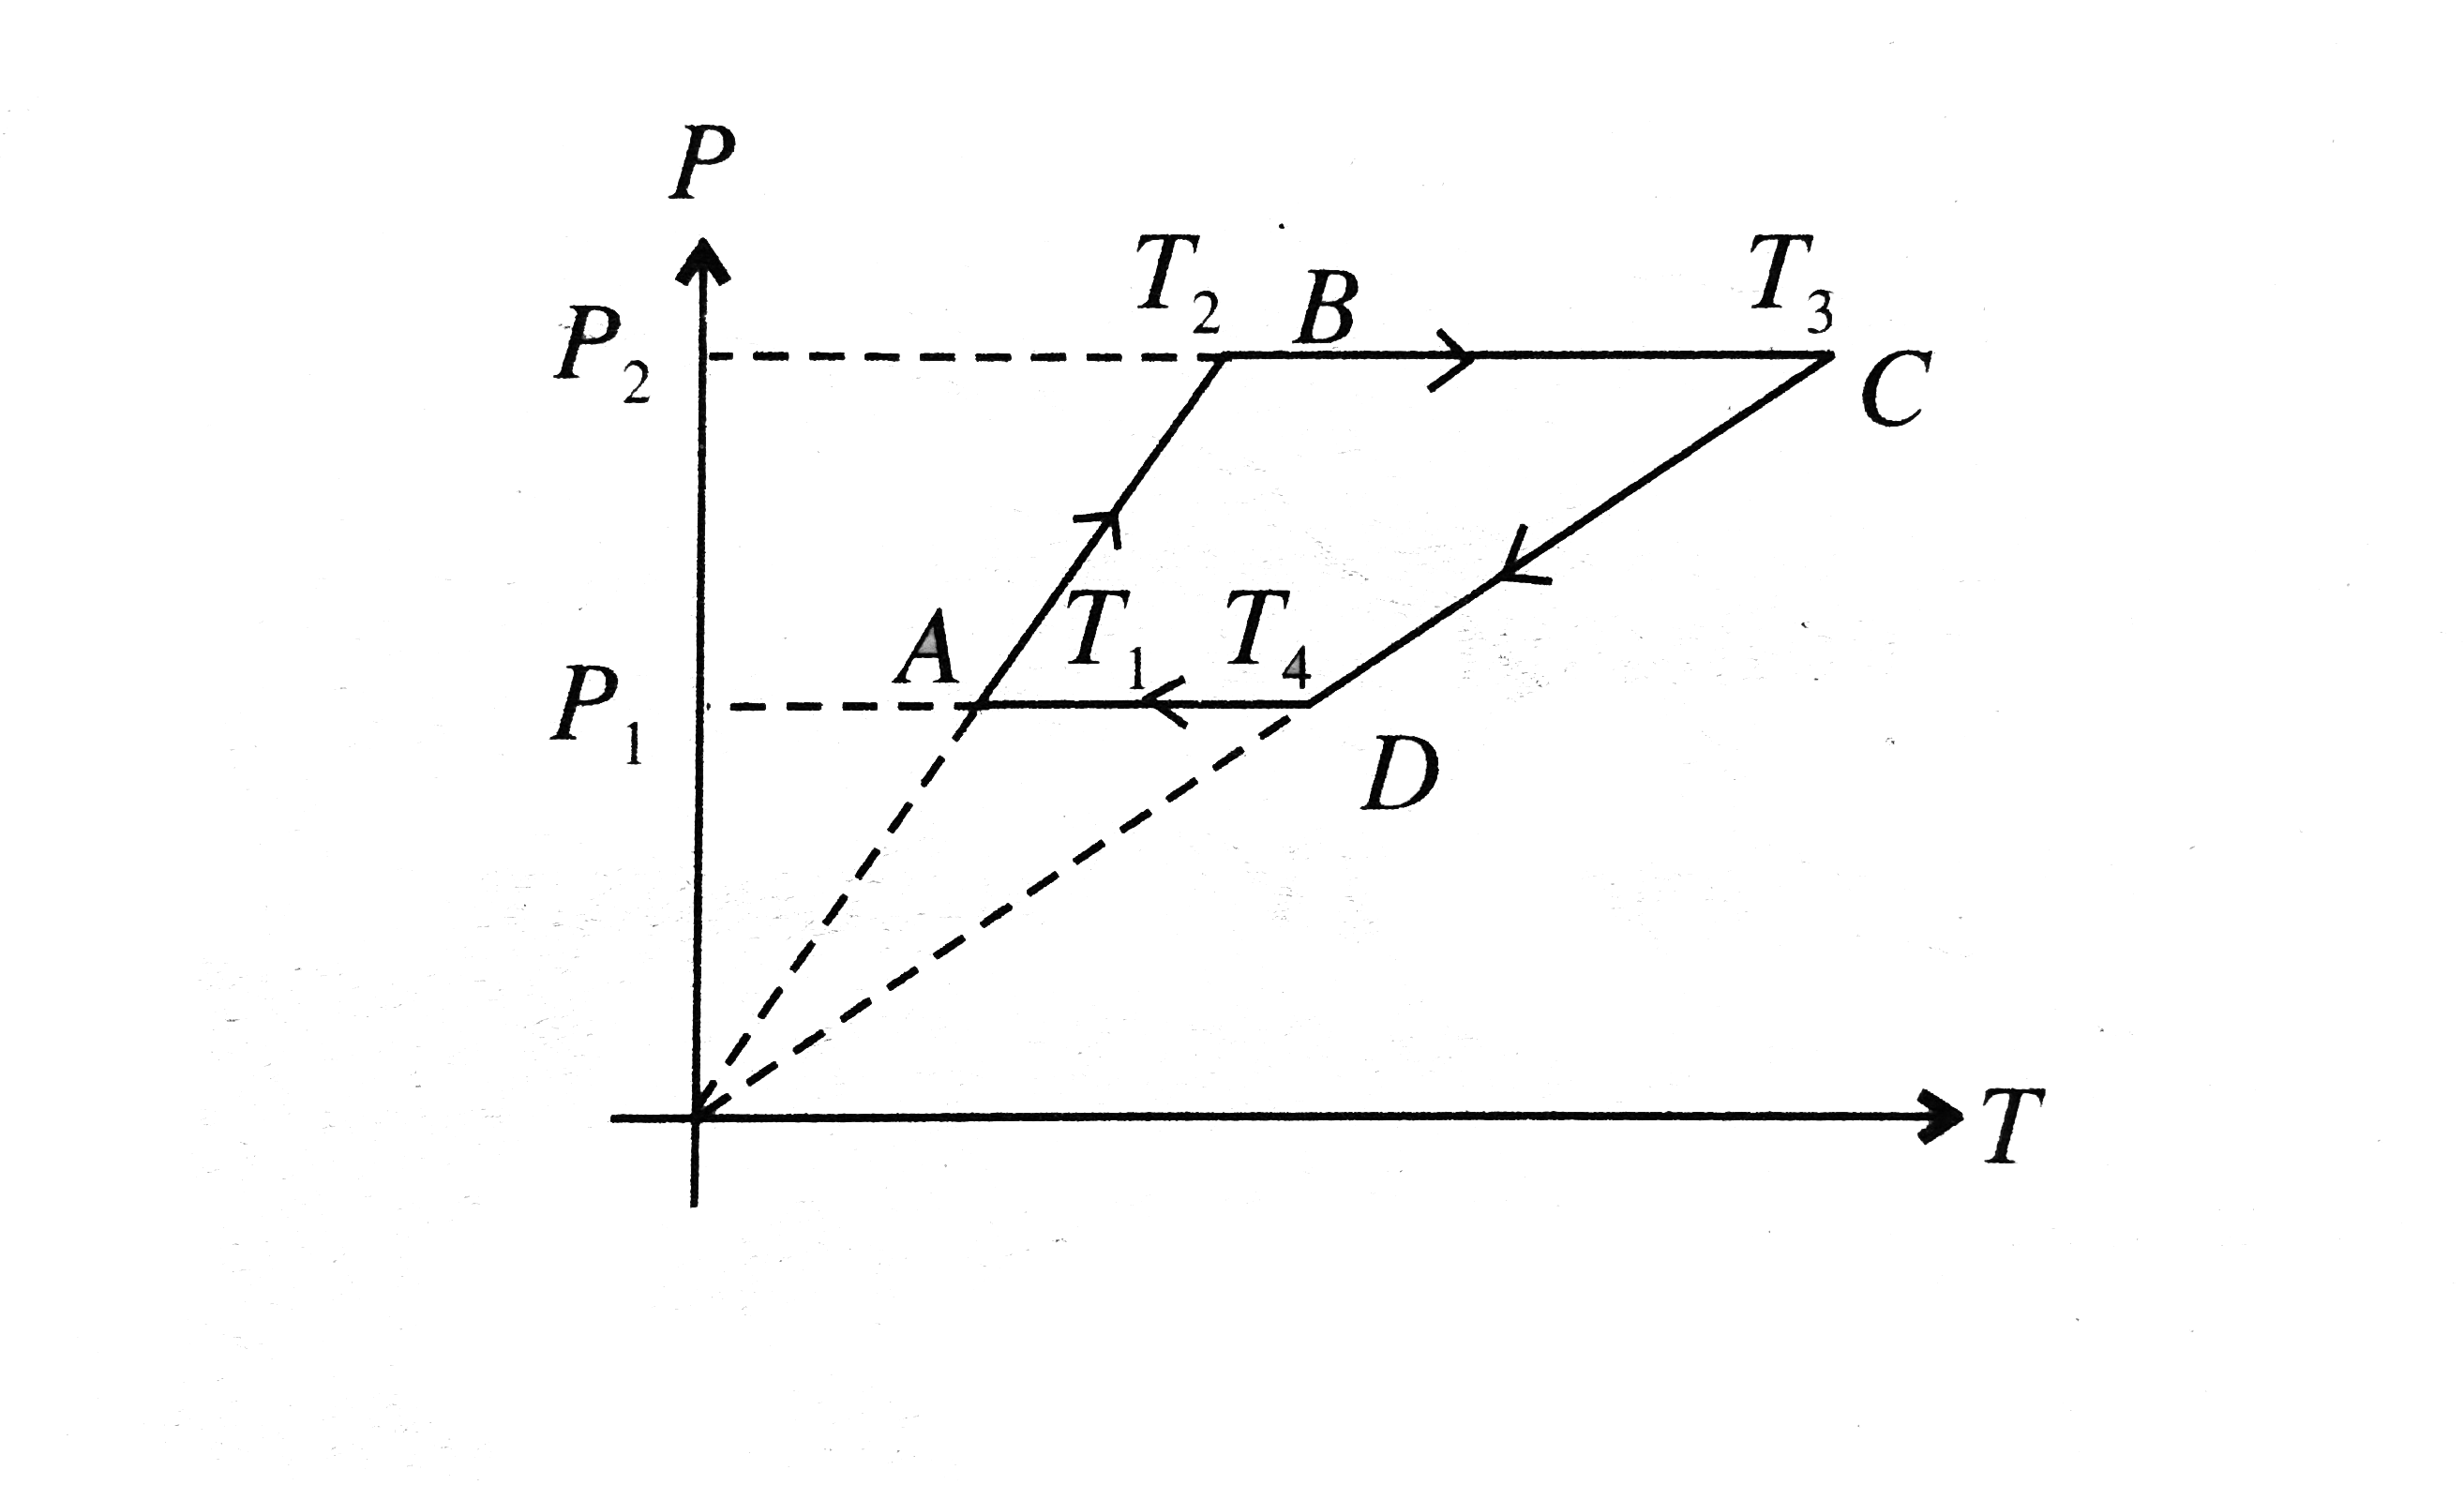
P-T curve of a cyclic process is shown. Find out the works done by the gas in the given proces if number of moles of the gas are n.
Video Solution
Text Solution
Since path AB and Cd are isochoric therefore work done during AB and Cd is zero. Path BC and DA are isobaric.
Hence WBC=nRTΔT=nRT(T3−T2)
WDA=nRT(T1−T4) Total work done =WBC+WDA=nRT(T1+T3−T4−T2)
|
Topper's Solved these Questions
- KTG & THERMODYNAMICSBOOK - RESONANCE ENGLISHCHAPTER - KTG & THERMODYNAMICSEXERCISE - Solved problem
1 Videos
- KTG & THERMODYNAMICSBOOK - RESONANCE ENGLISHCHAPTER - KTG & THERMODYNAMICSEXERCISE - Problem
3 Videos
- KTG & THERMODYNAMICSBOOK - RESONANCE ENGLISHCHAPTER - KTG & THERMODYNAMICSEXERCISE - SUBJECTIVE QUESTIONS
27 Videos
- KINETIC THEORY OF GASES AND THERMODYNAMICSBOOK - RESONANCE ENGLISHCHAPTER - KINETIC THEORY OF GASES AND THERMODYNAMICSEXERCISE - Exercise
64 Videos
- MAGNETIC FIELD AND FORCESBOOK - RESONANCE ENGLISHCHAPTER - MAGNETIC FIELD AND FORCESEXERCISE - Exercise
64 Videos
Similar Questions
Knowledge Check
A cyclic process is shown in the figure. Work done during the cyclic process ABCDA is
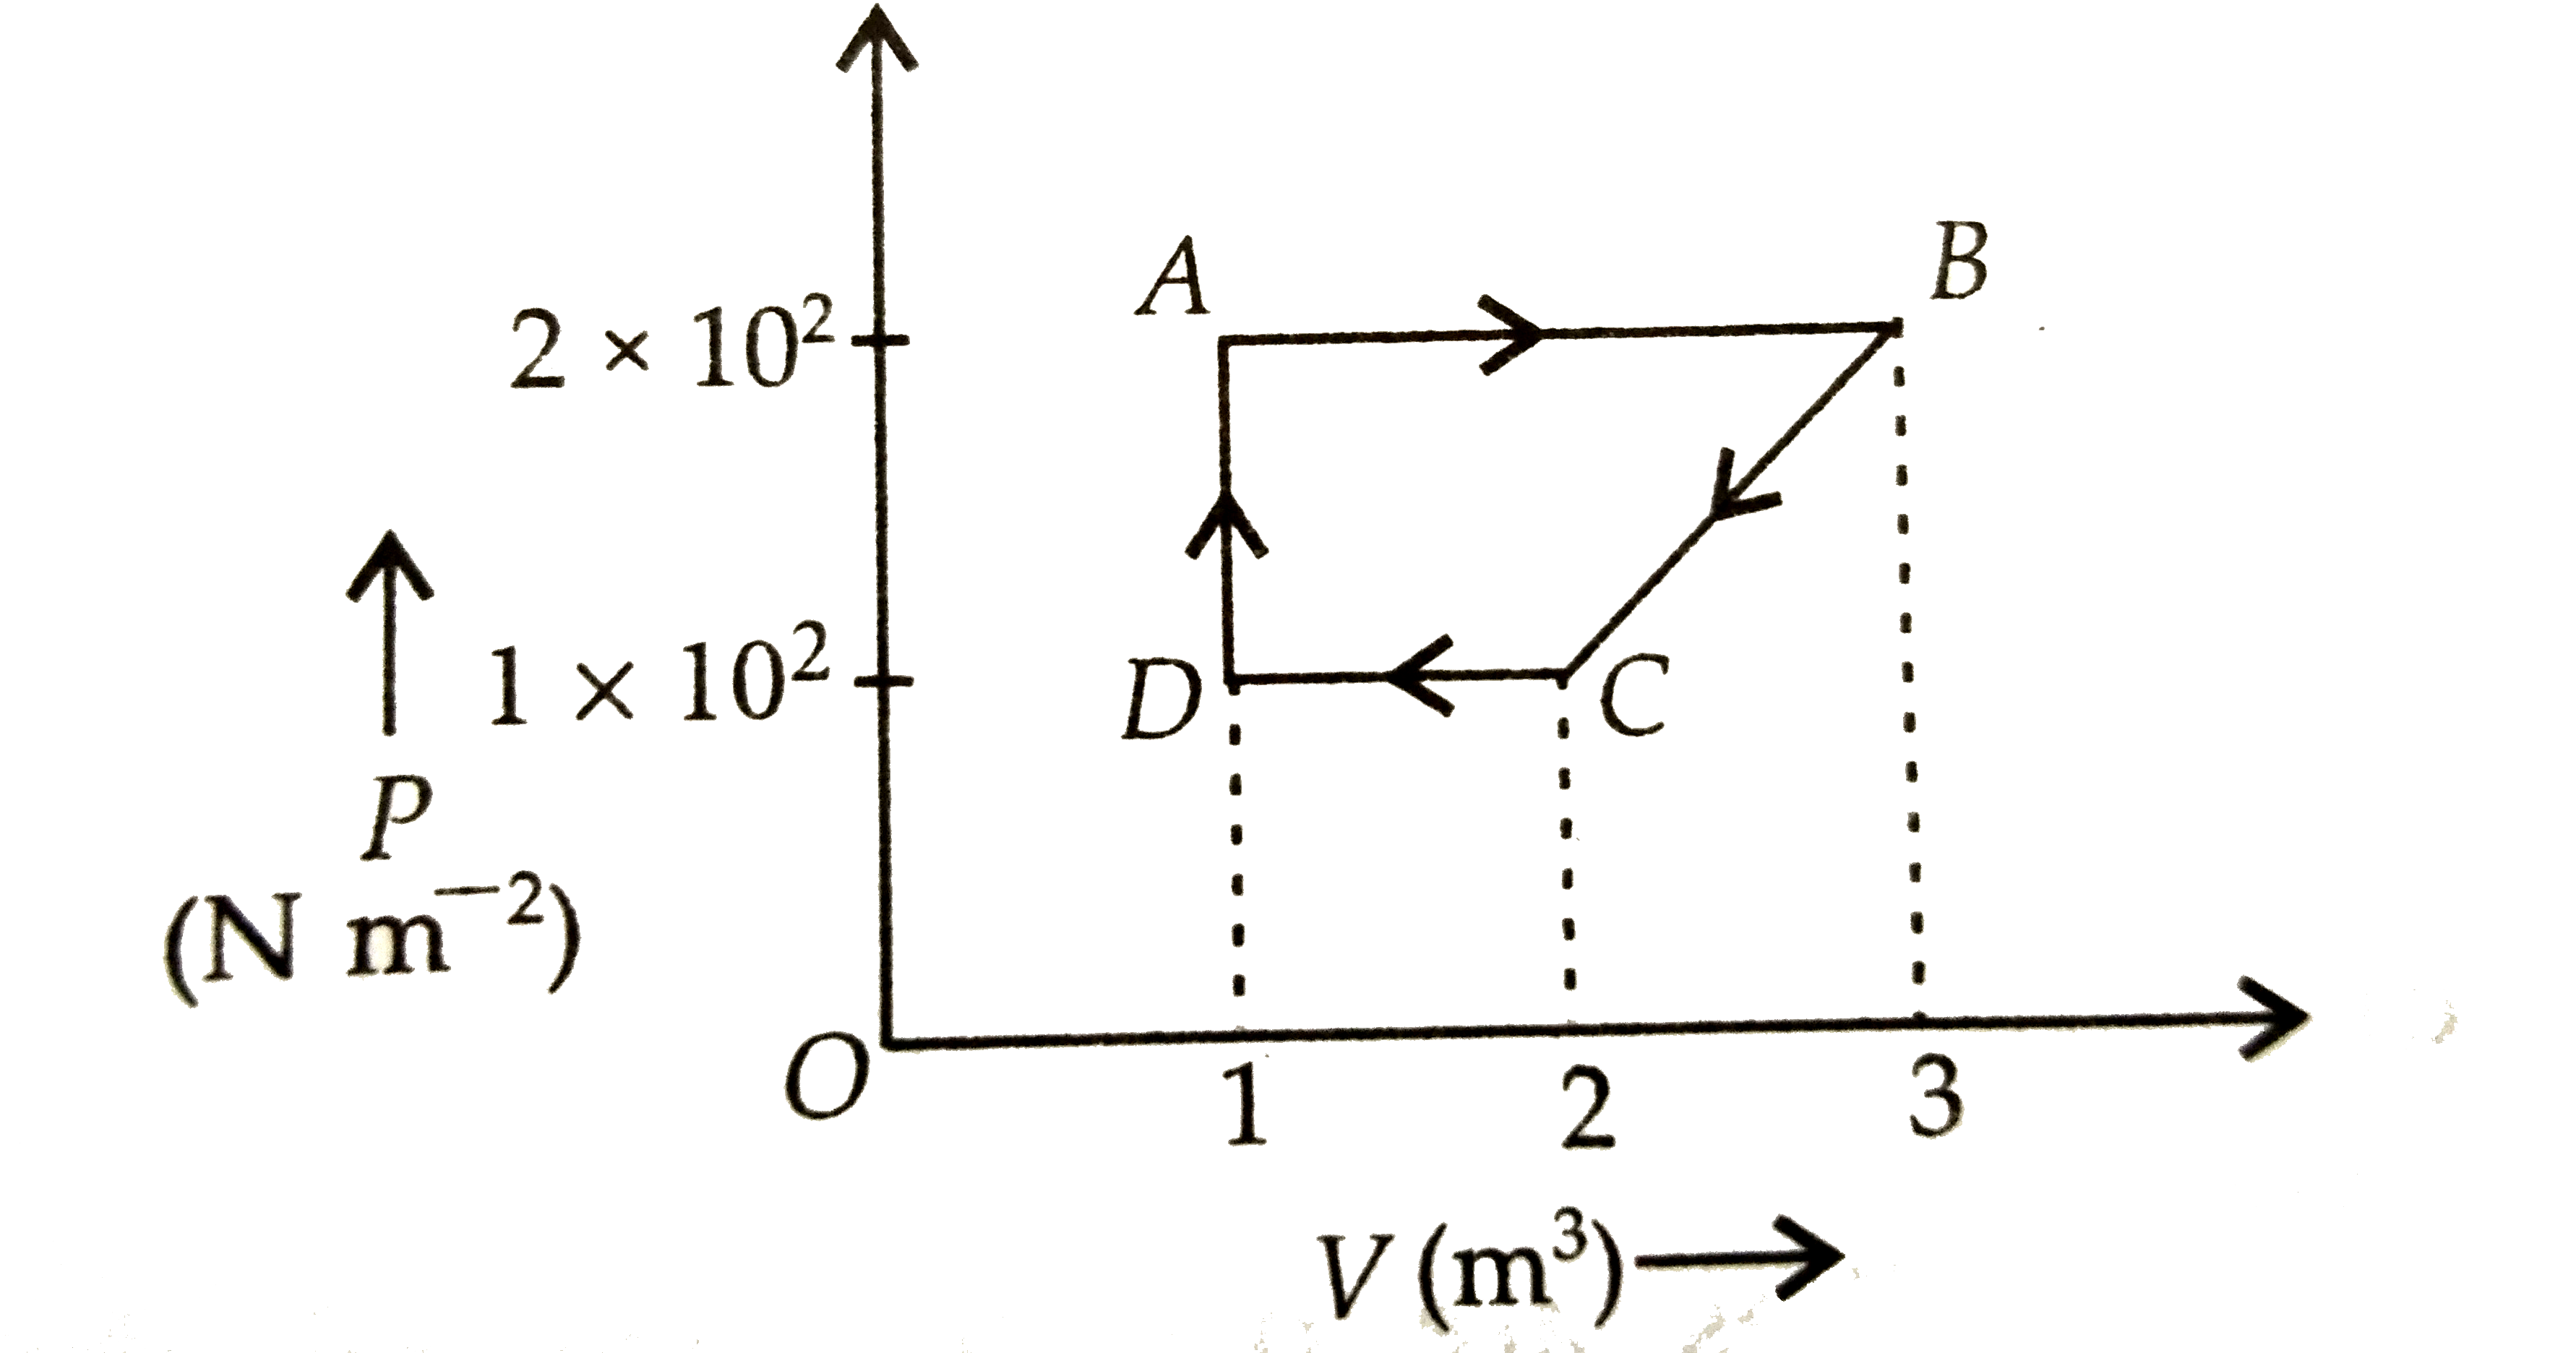 A1600 JB150 JC600 JD900 J
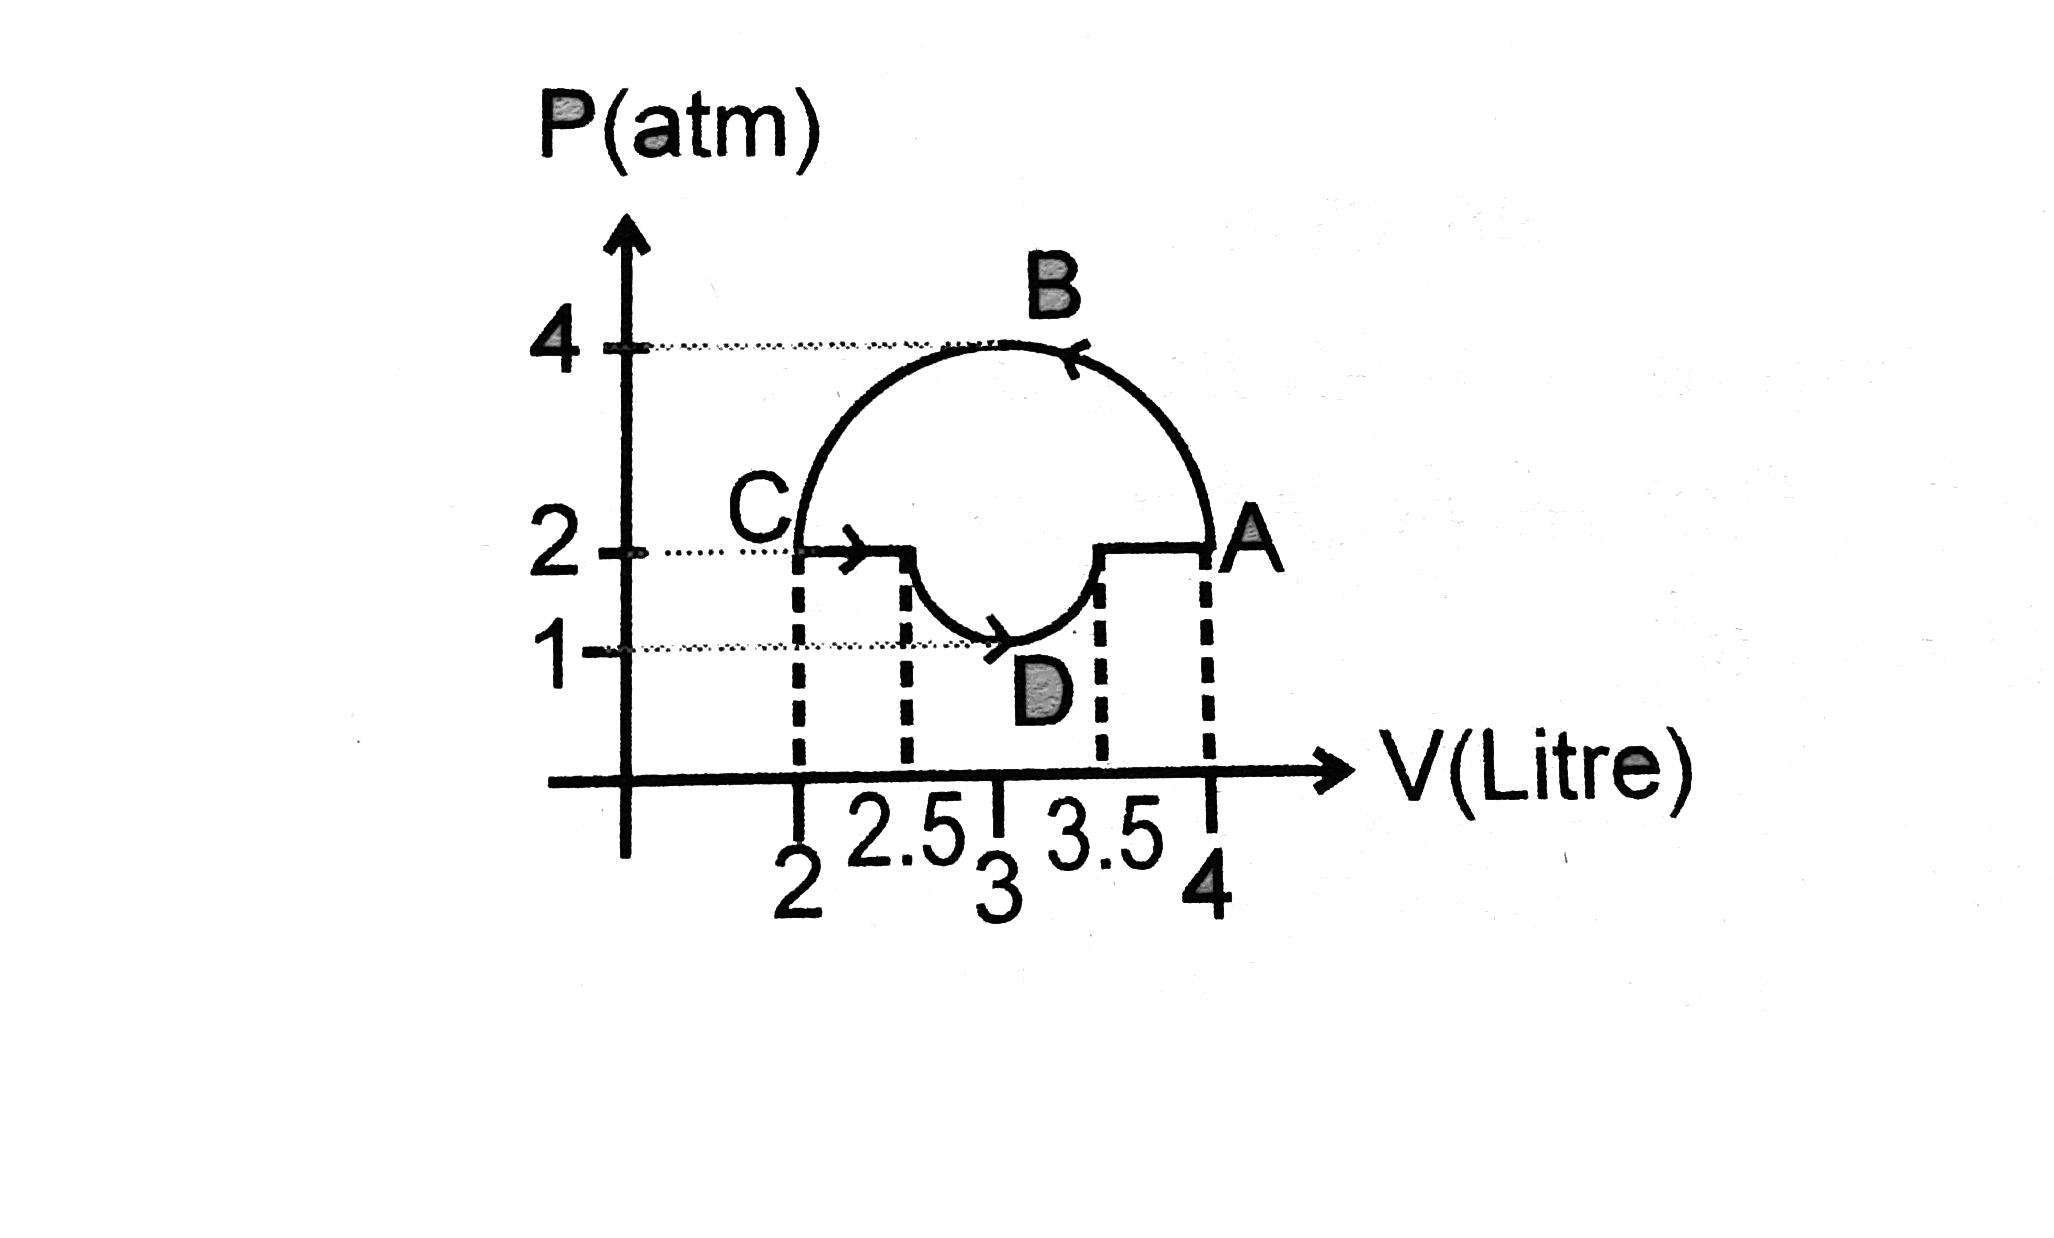
Find work done by the gas in the process shown in figure.
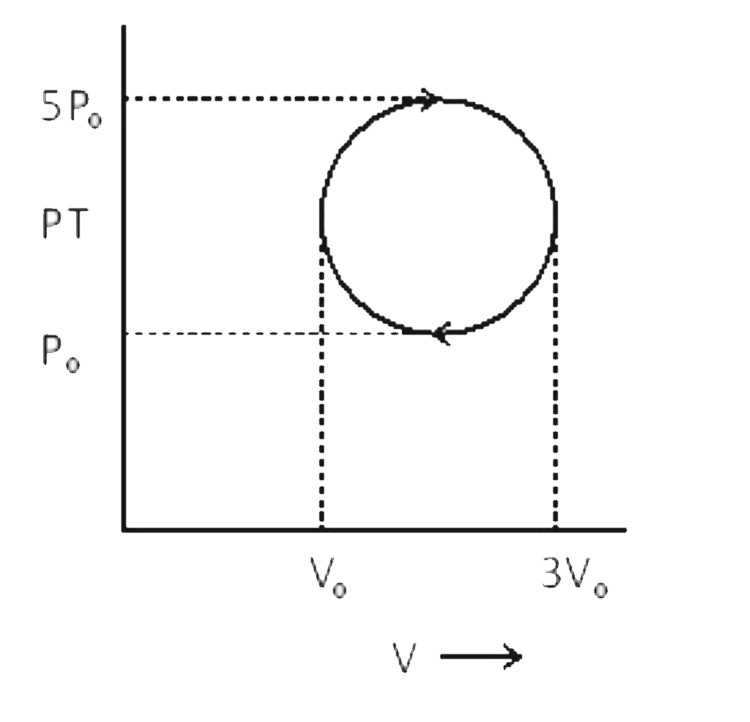
View SolutionP – V graph for a cyclic process is shown in figure . Work done is given by
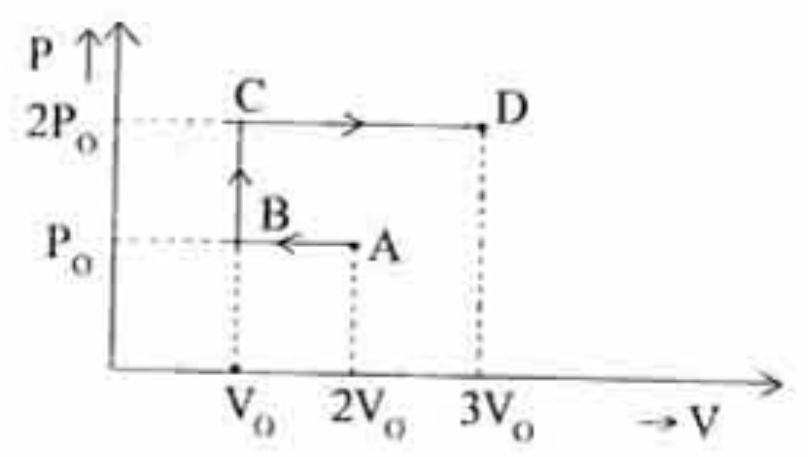
View SolutionP-V diagram of an ideal gas is as shown in figure. Work done by the gas in the process ABCD is

View SolutionThe work done by the gas in the process shown in given P-V diagram is
View SolutionFind work done by the gas in the process AB shown in the following figures.

View Solutionp−T curve for a cyclic process is as shown
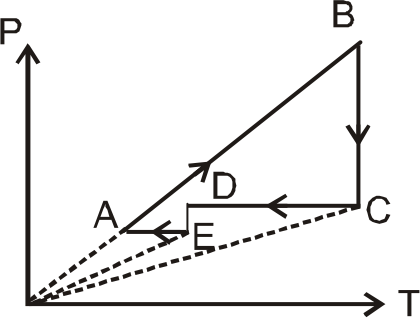
P−V graph for this process will be:
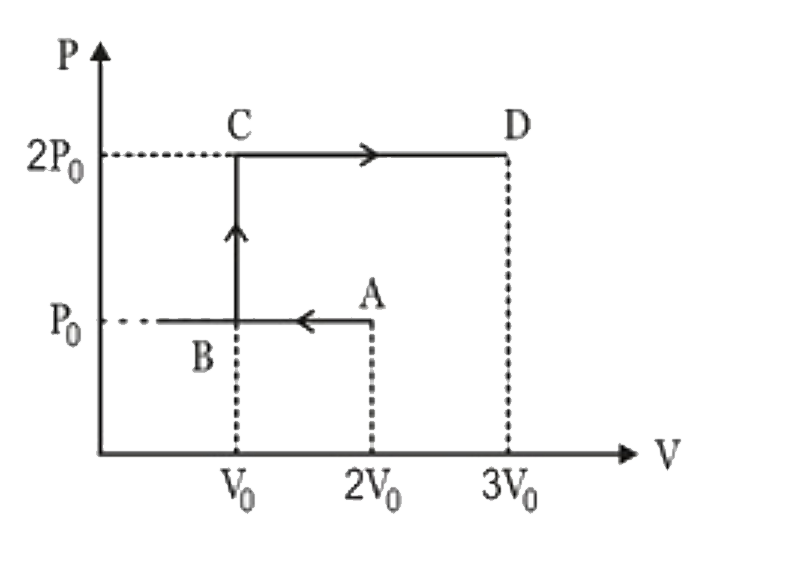
View SolutionP – V graph of an ideal gas is as shown in the diagram . Work done by the gas in the process ABCD is
View Solution

