Which of the following may represent the curve x = 2y+ 3?
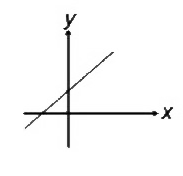
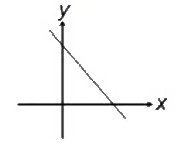
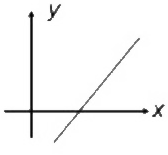
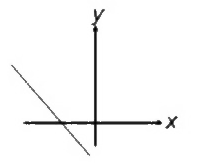
The correct Answer is:A
To solve the question "Which of the following may represent the curve x = 2y + 3?", we will follow these steps:
Step 1: Rearranging the Equation
We start with the given equation:
x=2y+3
We want to express this in the standard form of a linear equation, which is typically written as y=mx+c. To do this, we will isolate y.
Step 2: Isolating y
Rearranging the equation:
2y=x−3
Now, divide both sides by 2:
y=12x−32
Step 3: Identifying the Slope and Intercept
From the equation y=12x−32, we can identify:
- The slope m=12
- The y-intercept c=−32
Step 4: Analyzing the Slope
Since the slope 12 is positive, this means that the line rises as it moves from left to right. The angle of the line with the x-axis will be between 0 degrees and 90 degrees.
Step 5: Analyzing the Y-Intercept
The y-intercept −32 indicates that the line crosses the y-axis below the origin (at -1.5 on the y-axis).
Step 6: Evaluating Options
Now, we need to evaluate the given options (which are not provided in the question but are assumed to be graphical representations of lines):
- We will reject any options where the angle with the x-axis is greater than 90 degrees (i.e., lines that slope downwards).
- We will also reject any options where the y-intercept is positive (above the origin).
Conclusion
After analyzing the options based on the slope and y-intercept, we will select the option that has:
1. A positive slope (rising line).
2. A negative y-intercept (crossing the y-axis below the origin).
We start with the given equation:
x=2y+3
Rearranging the equation:
2y=x−3
Now, divide both sides by 2:
y=12x−32
From the equation y=12x−32, we can identify:
- The slope m=12
- The y-intercept c=−32
Since the slope 12 is positive, this means that the line rises as it moves from left to right. The angle of the line with the x-axis will be between 0 degrees and 90 degrees.
The y-intercept −32 indicates that the line crosses the y-axis below the origin (at -1.5 on the y-axis).
Now, we need to evaluate the given options (which are not provided in the question but are assumed to be graphical representations of lines):
- We will reject any options where the angle with the x-axis is greater than 90 degrees (i.e., lines that slope downwards).
- We will also reject any options where the y-intercept is positive (above the origin).
After analyzing the options based on the slope and y-intercept, we will select the option that has:
1. A positive slope (rising line).
2. A negative y-intercept (crossing the y-axis below the origin).
Topper's Solved these Questions
- BASIC MATHEMATICS & VECTORSBOOK - VMC MODULES ENGLISHCHAPTER - BASIC MATHEMATICS & VECTORSEXERCISE - Impeccable
50 Videos
- BASIC MATHEMATICS & VECTORSBOOK - VMC MODULES ENGLISHCHAPTER - BASIC MATHEMATICS & VECTORSEXERCISE - Enable
50 Videos
- CAPACITORSBOOK - VMC MODULES ENGLISHCHAPTER - CAPACITORSEXERCISE - JEE Advance ( Archive ) LEVEL 48
1 Videos
Similar Questions
Knowledge Check
A hot liquid is kept in a bog room. Accoding to Newton's law of cooling rate of cooling liquid (represented as y) is plotted against its temperature T. Which of the following curves may represent the plot?
A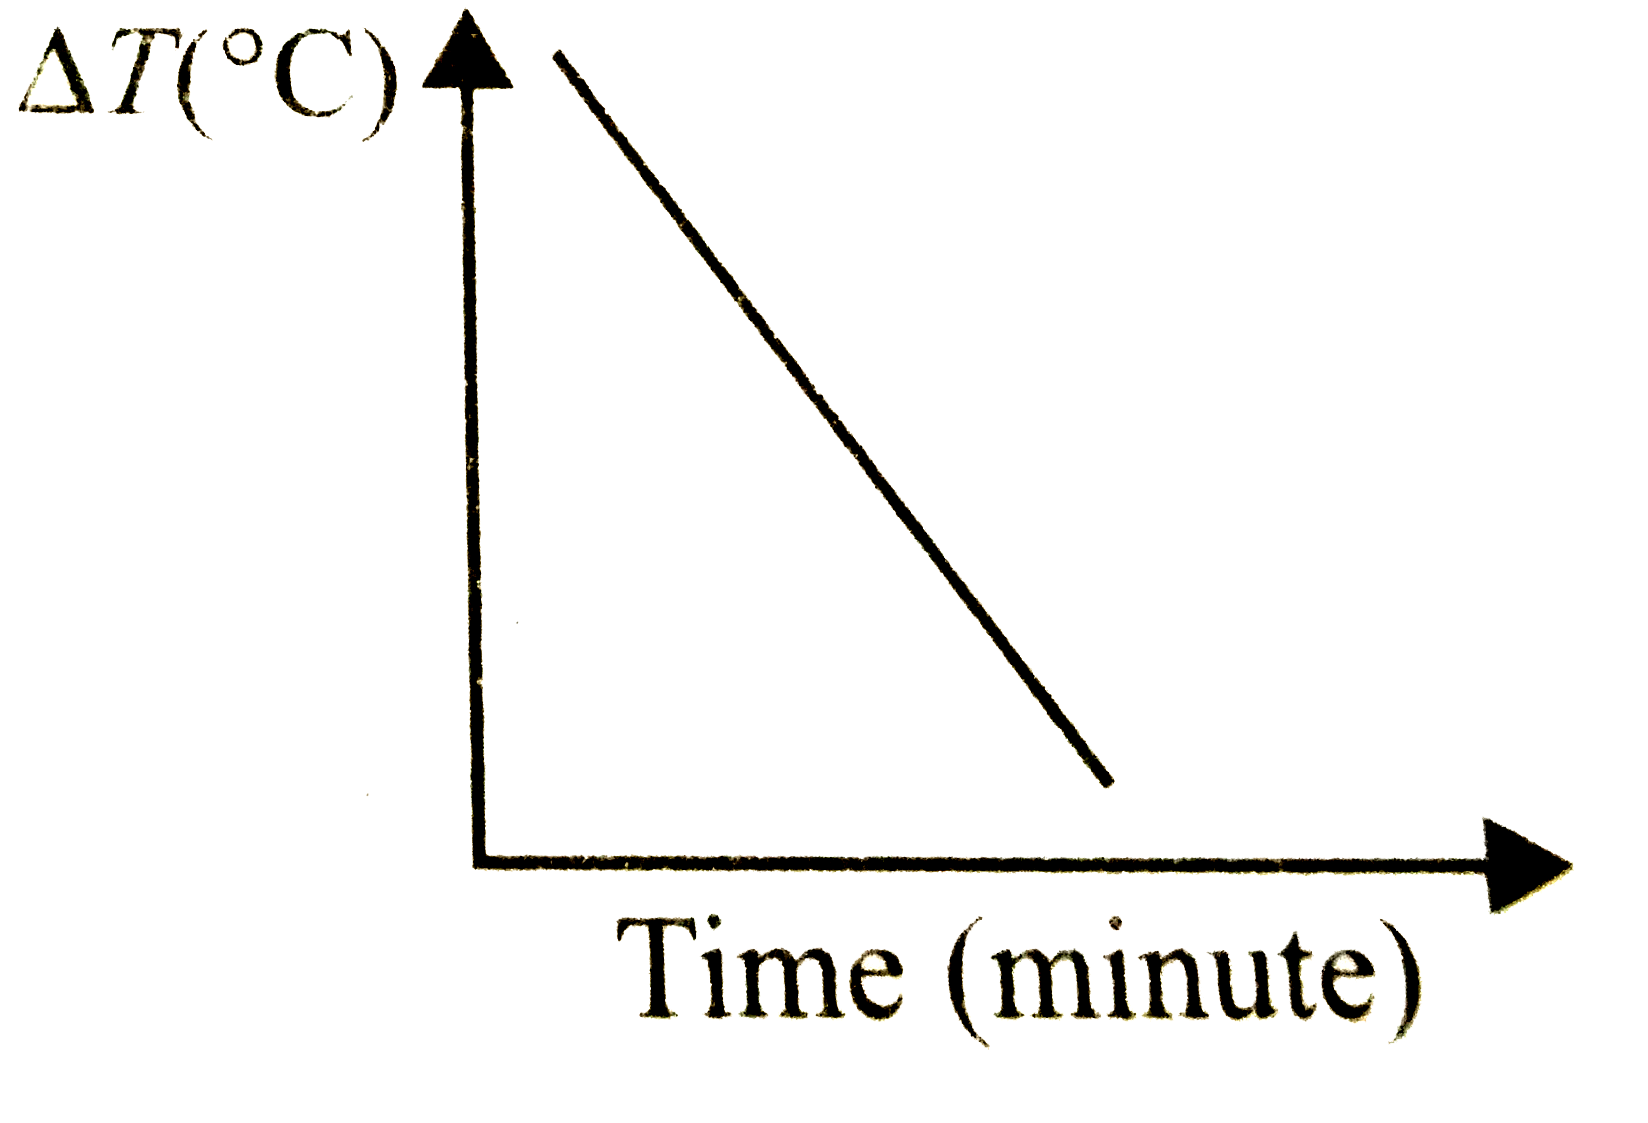 B
B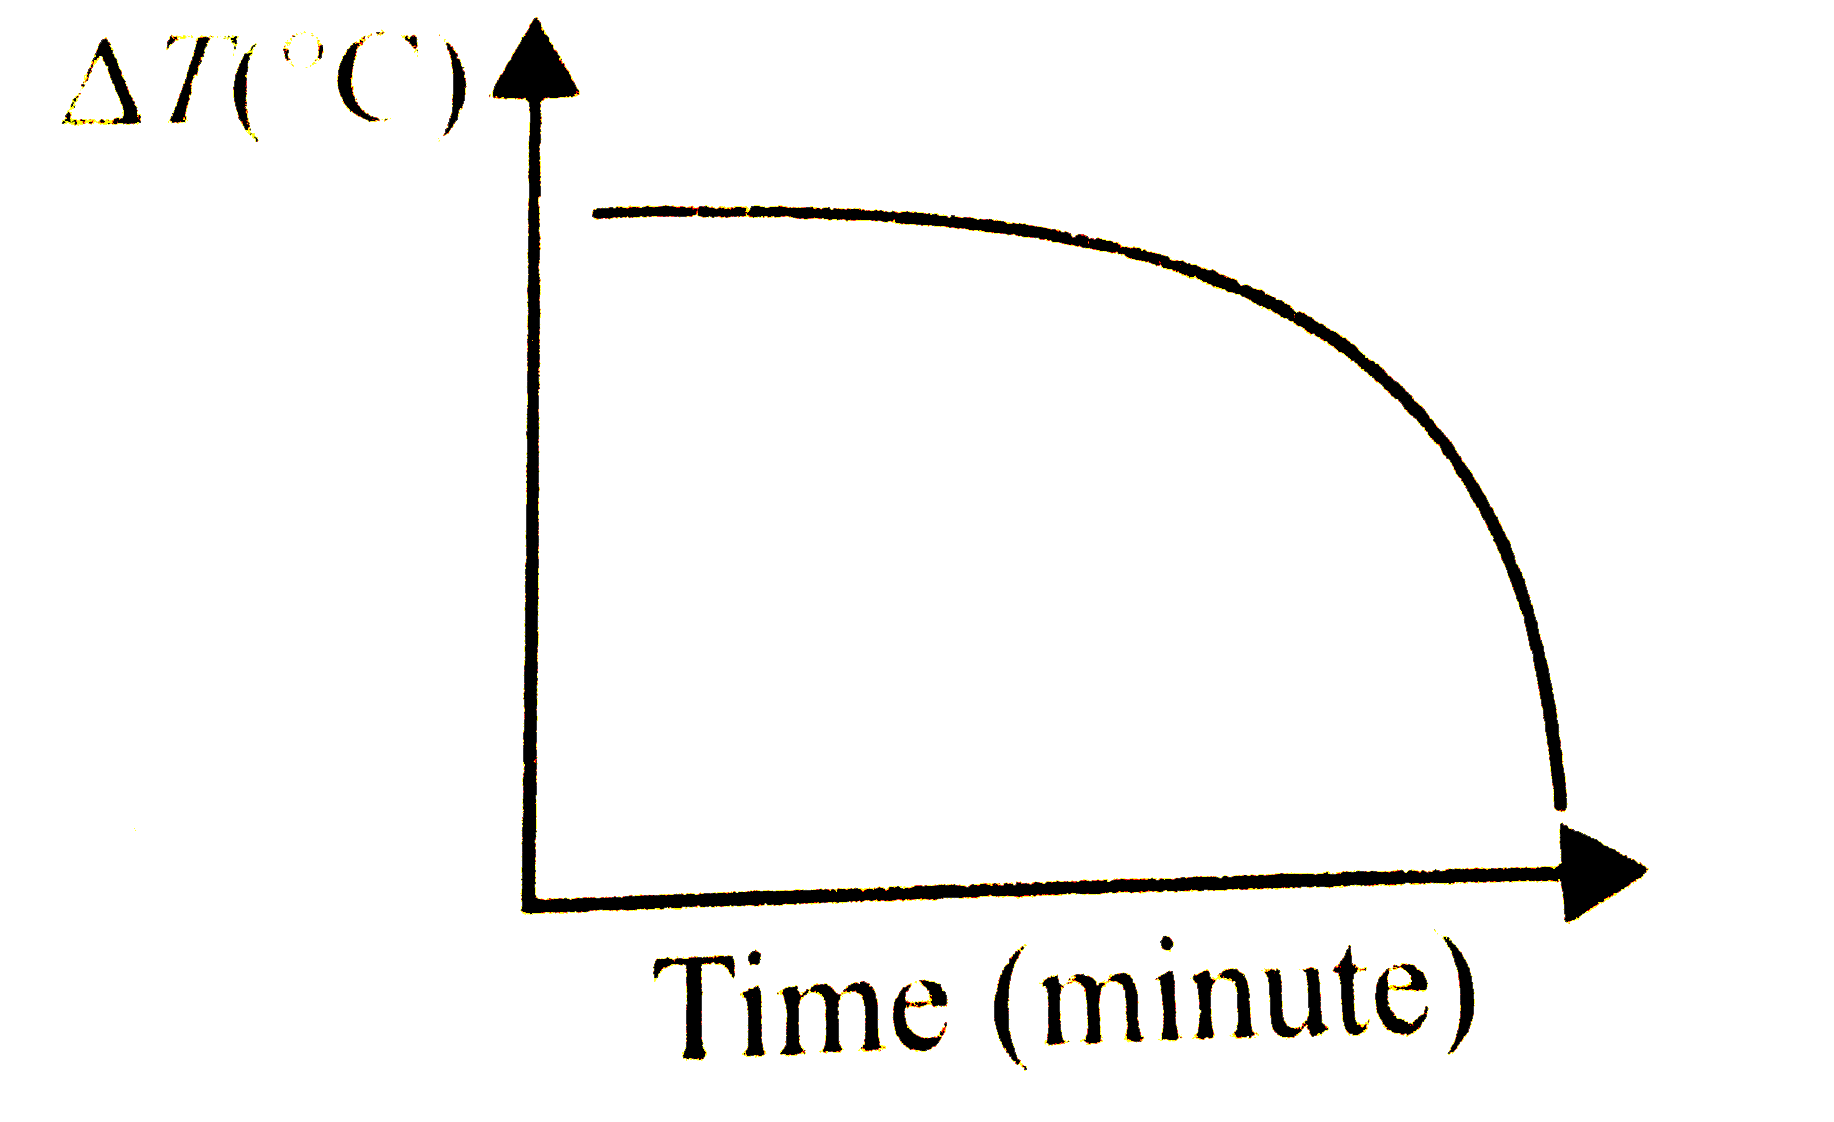 C
C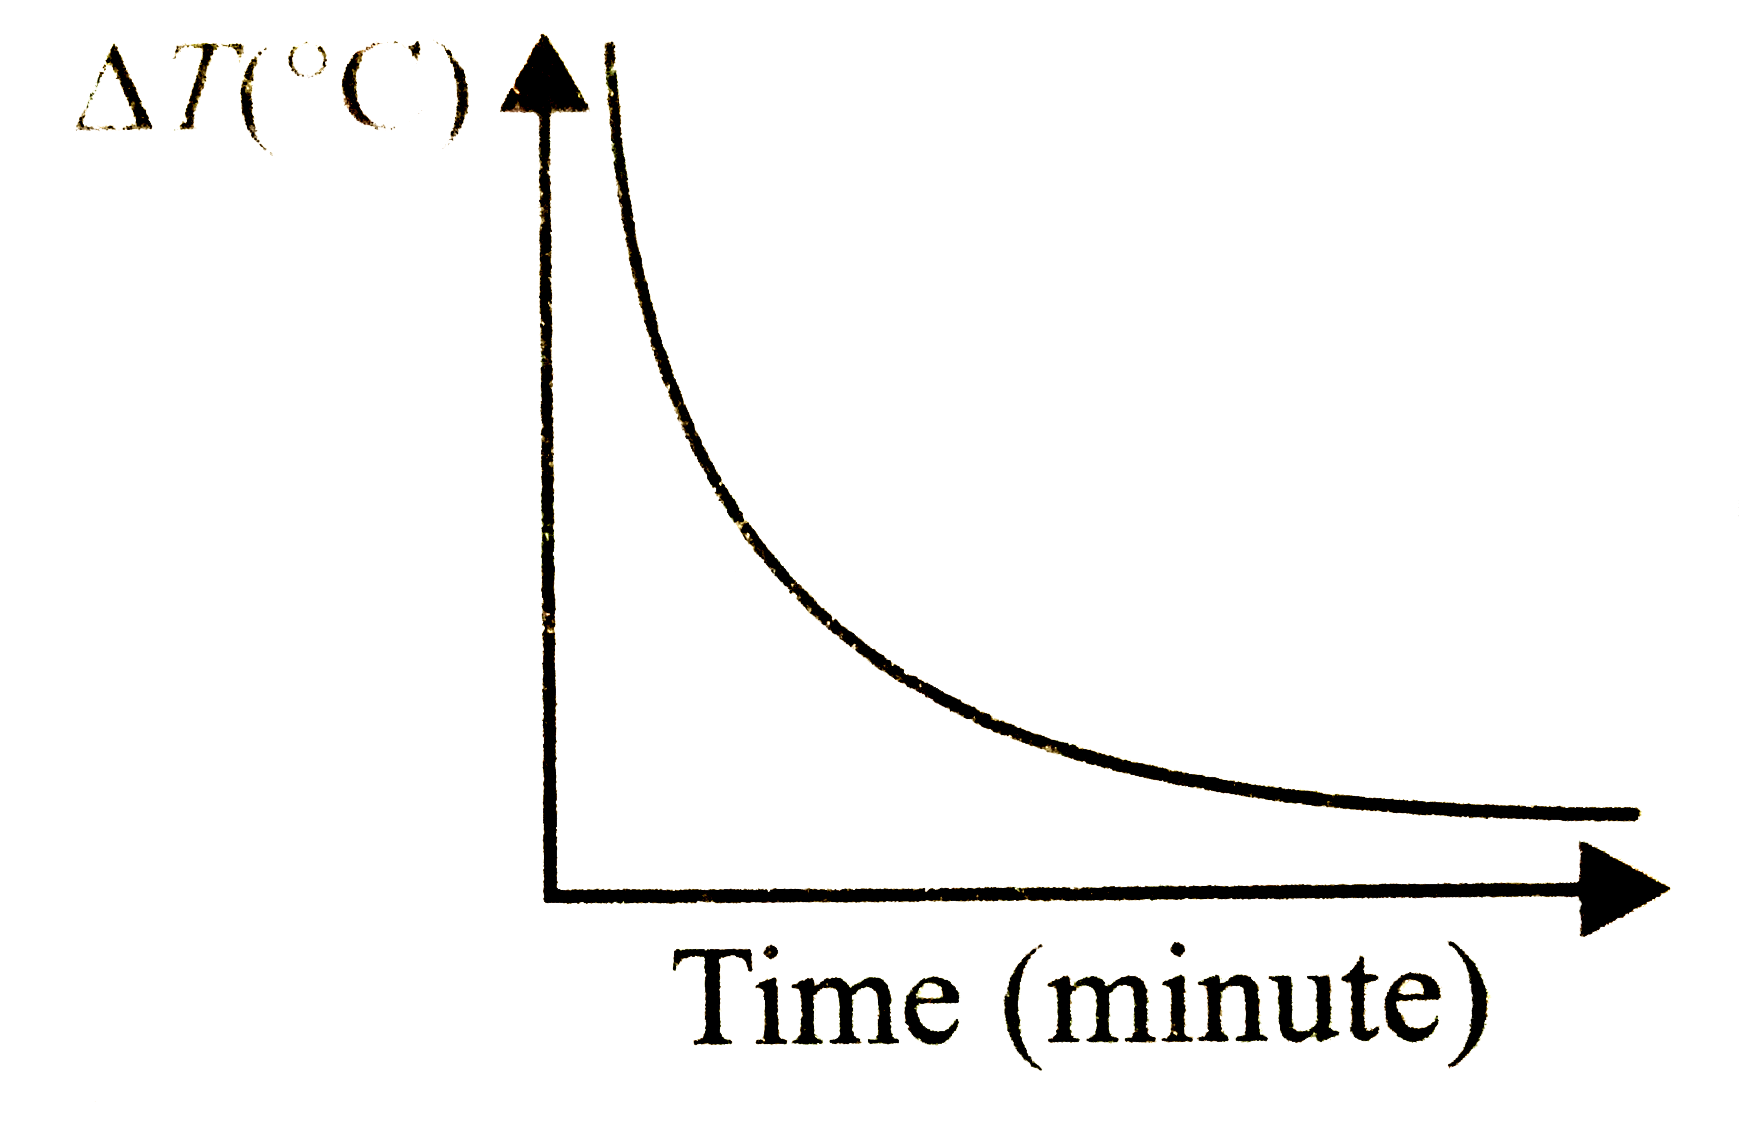 D
D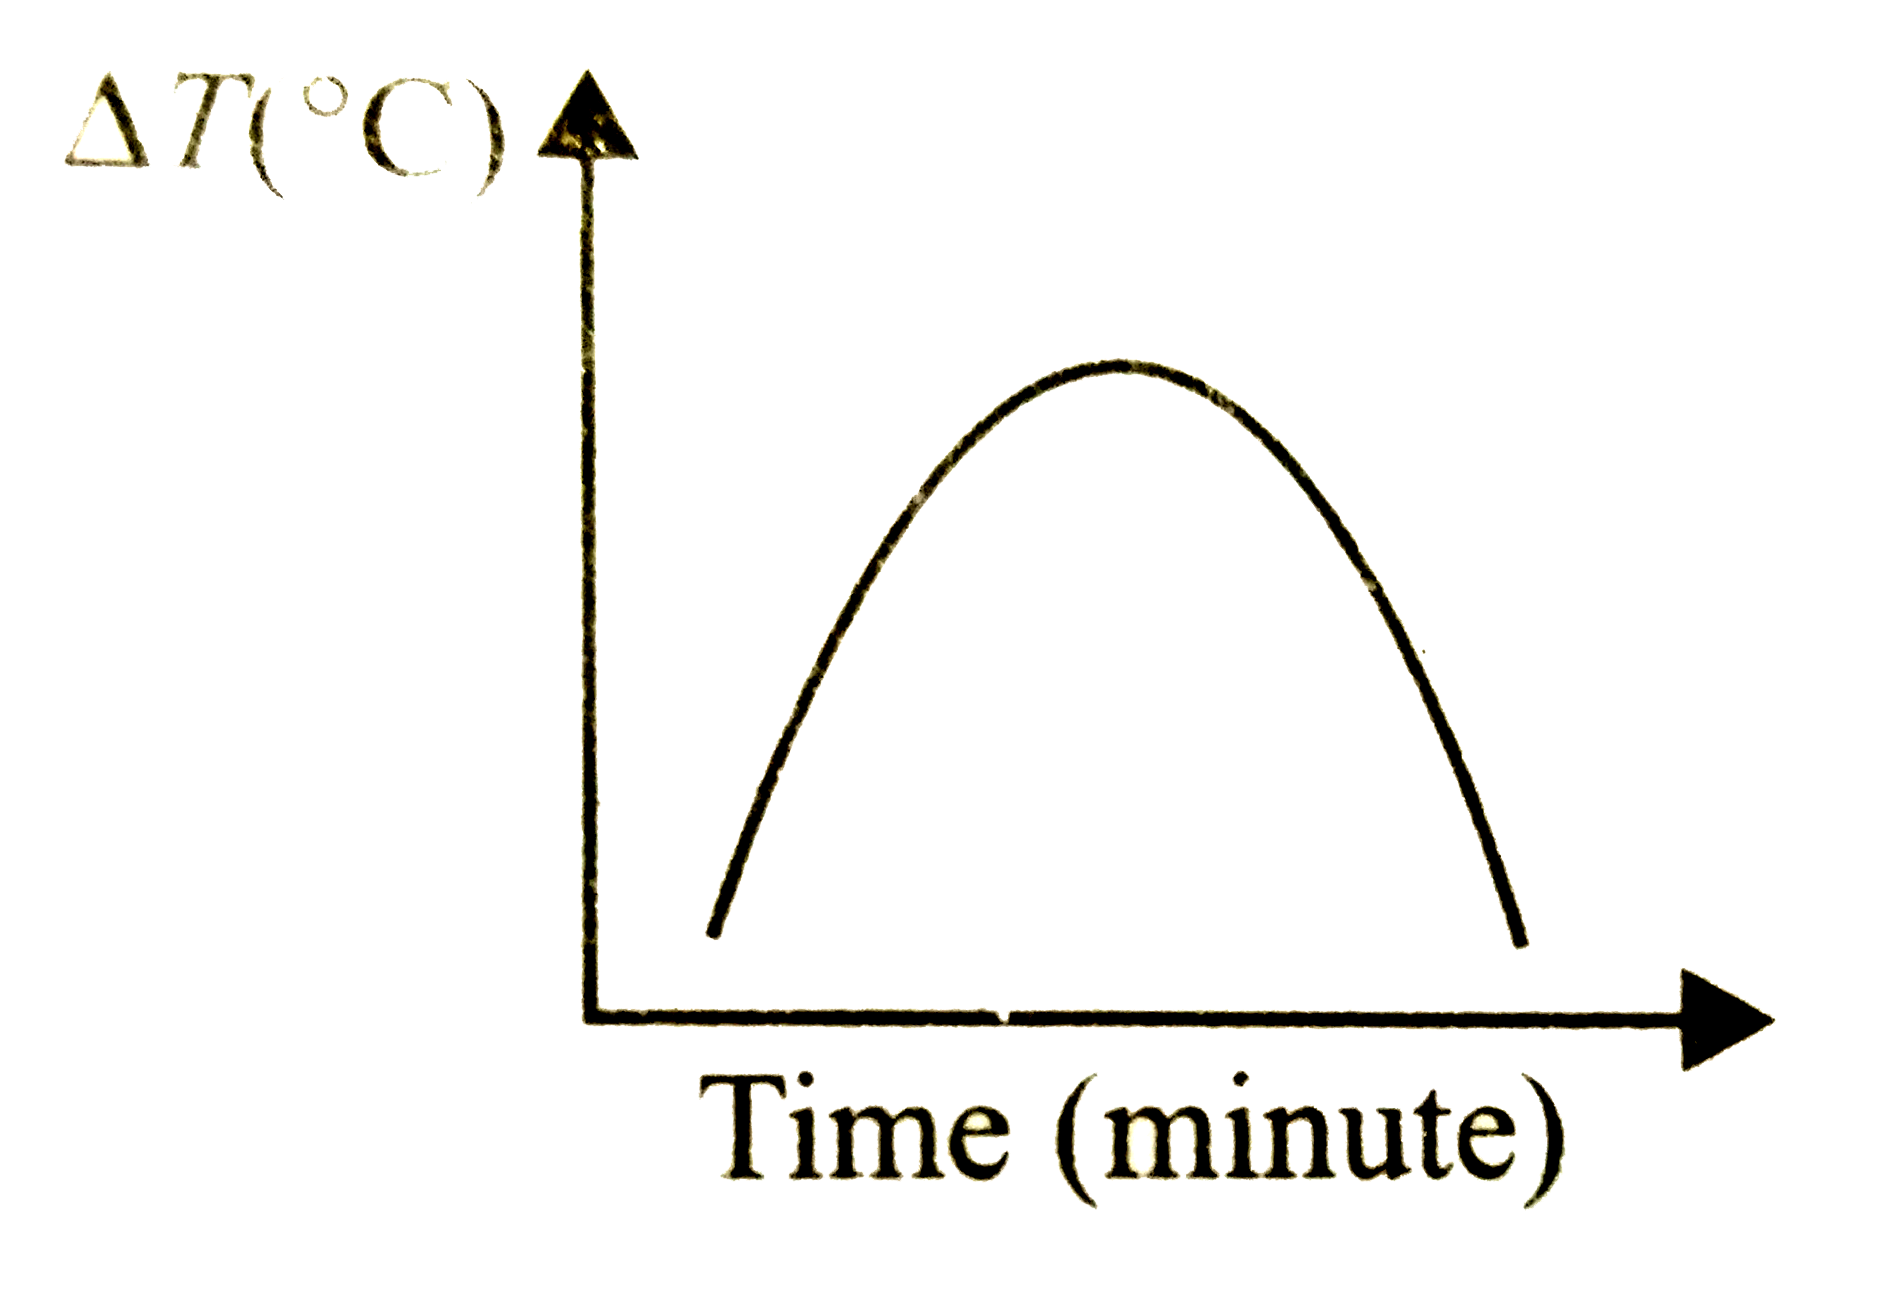
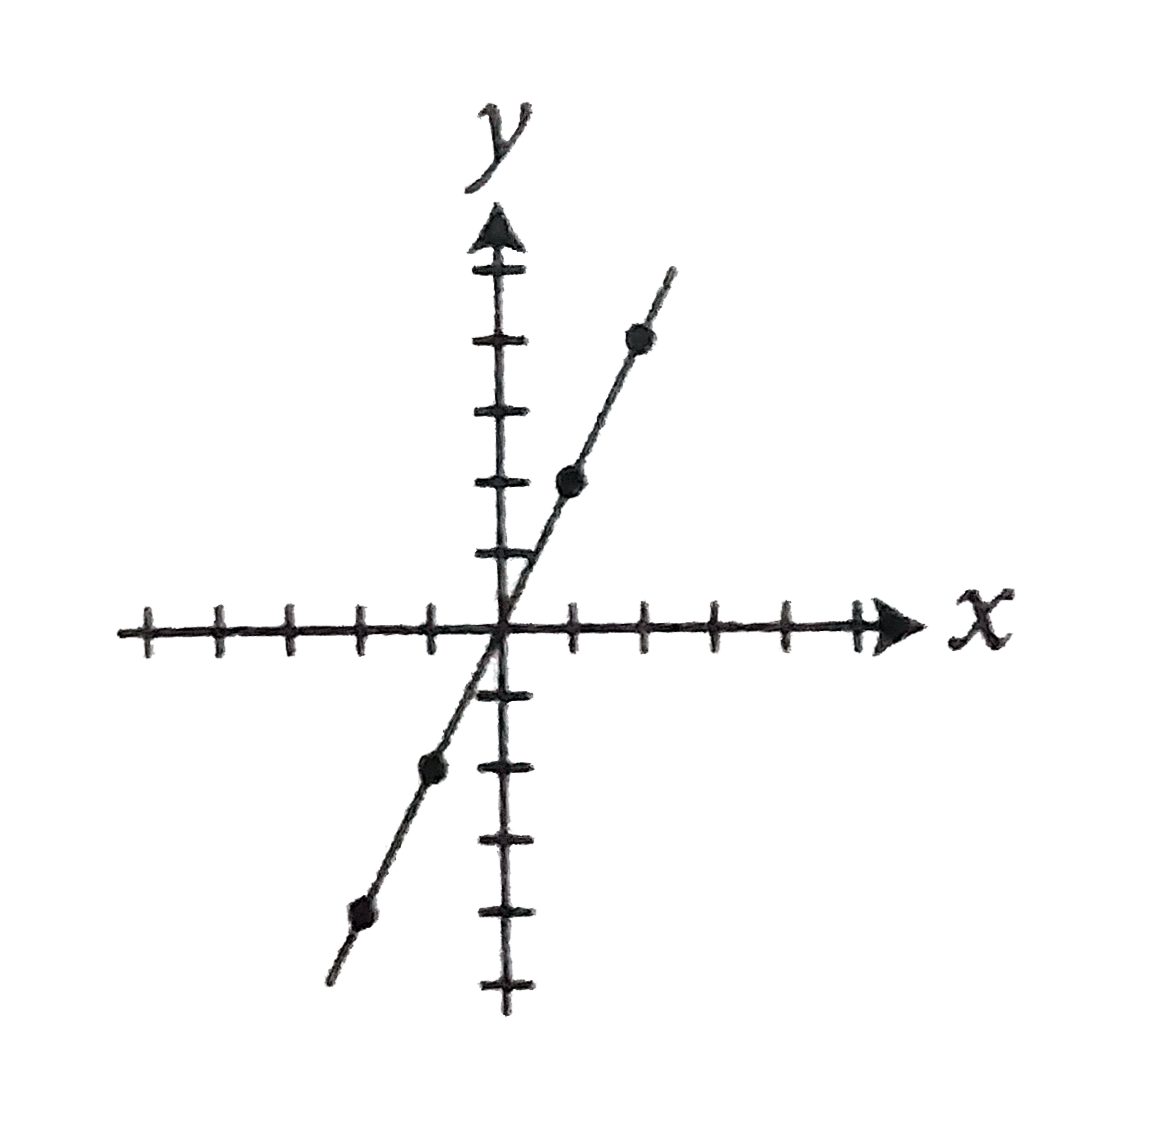
The graph above shows y=2x. Which of the following graphs represents y=|2x|?A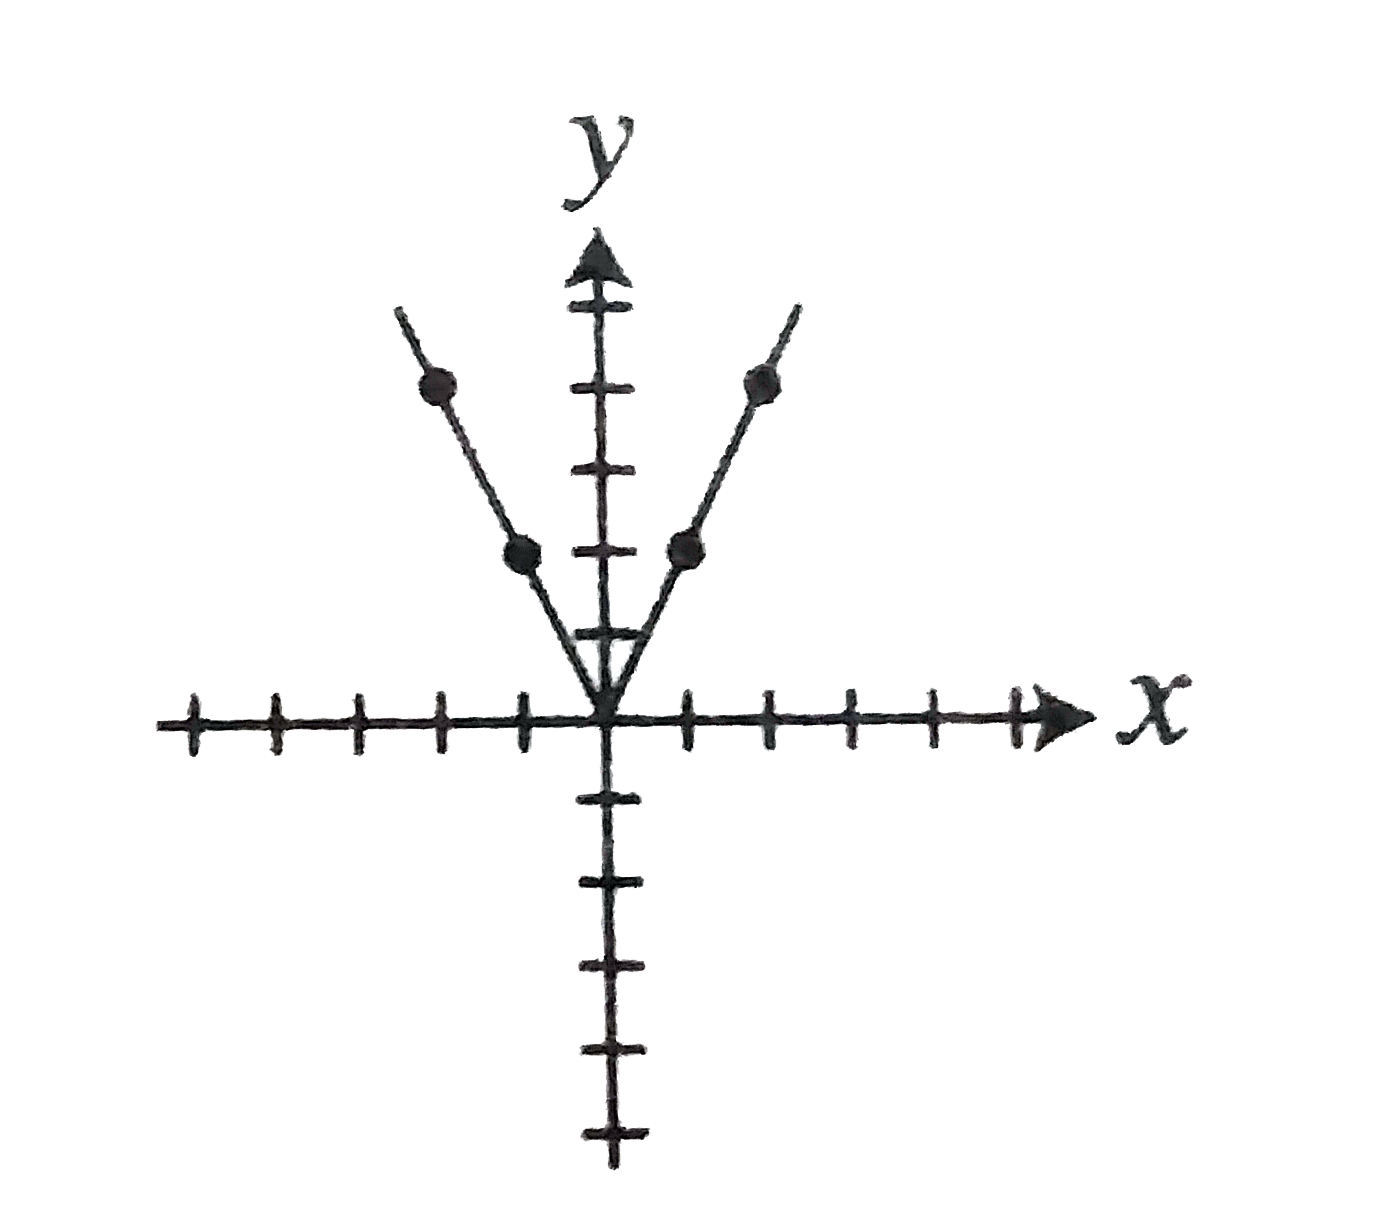 B
B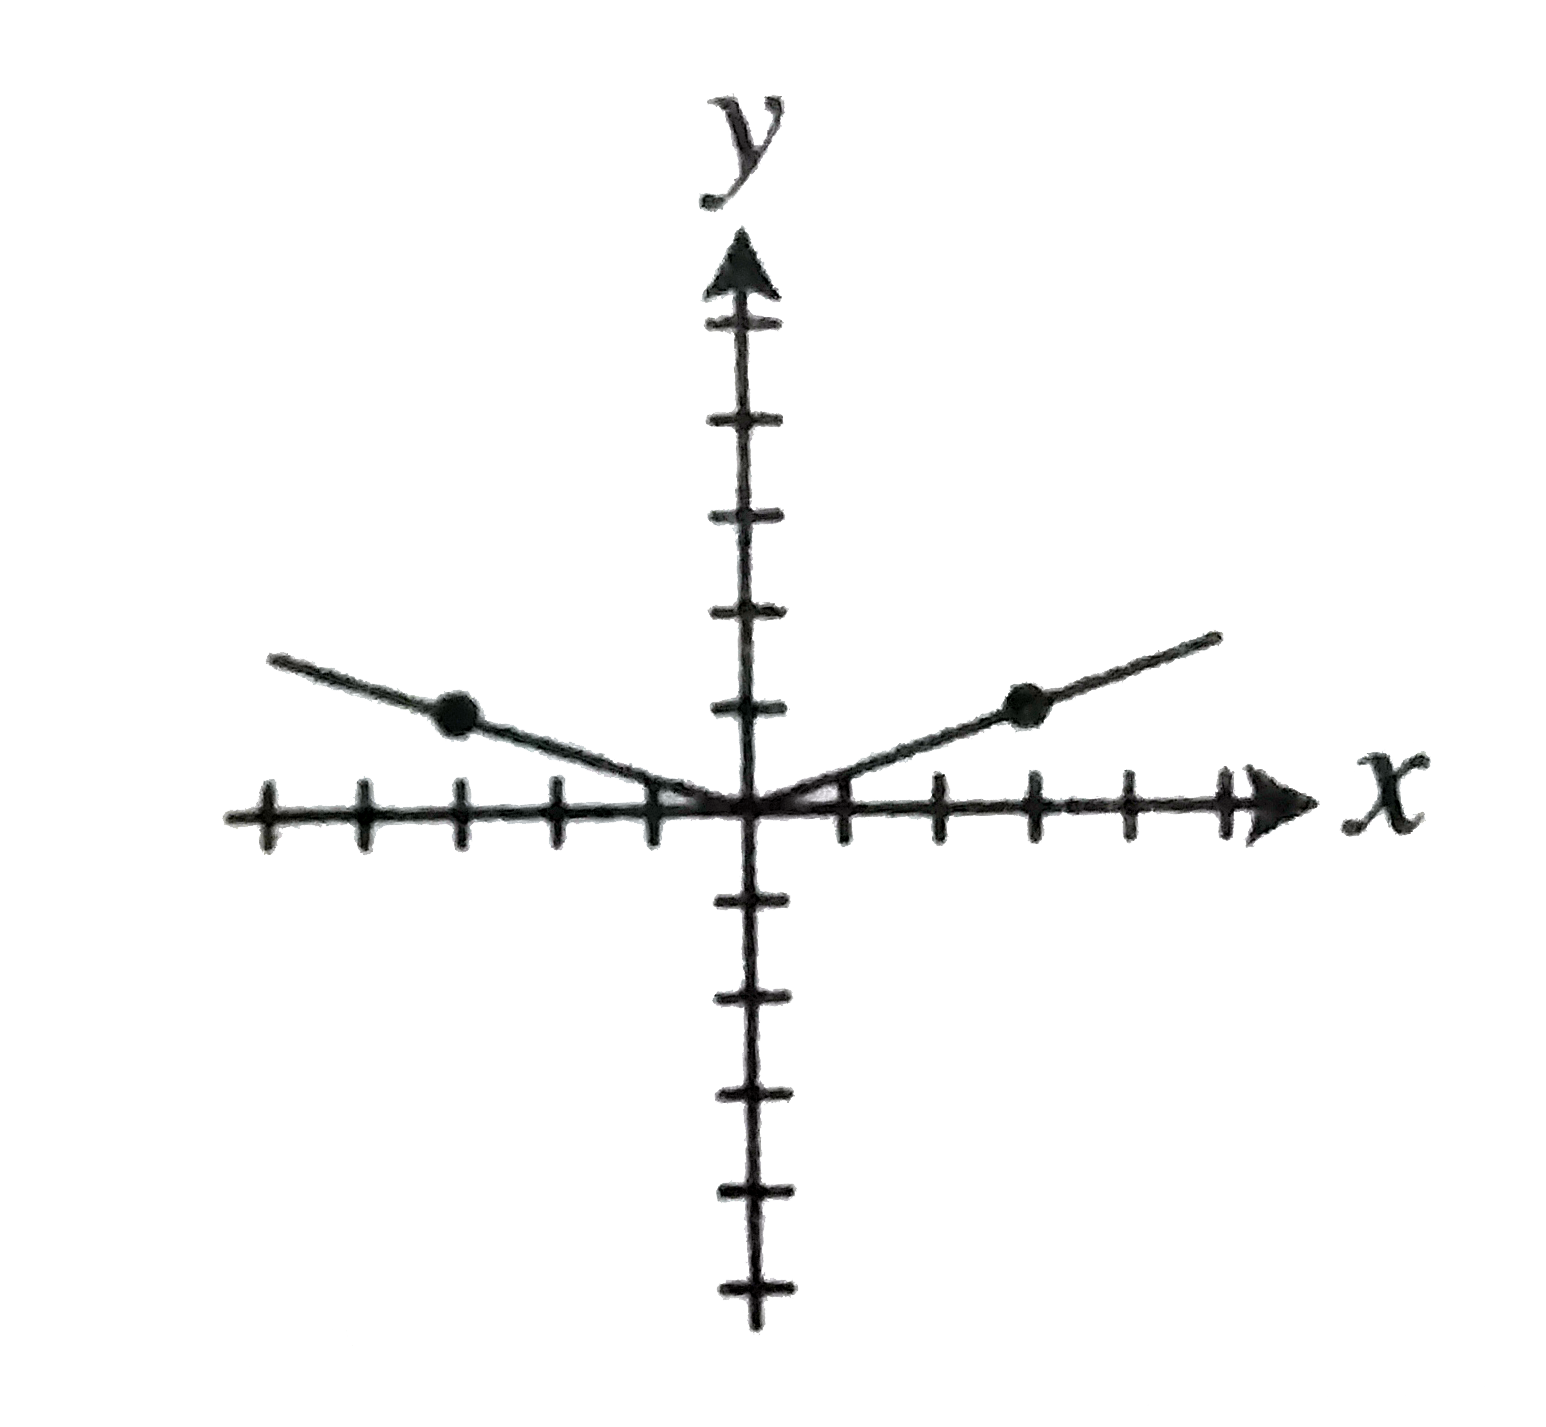 C
C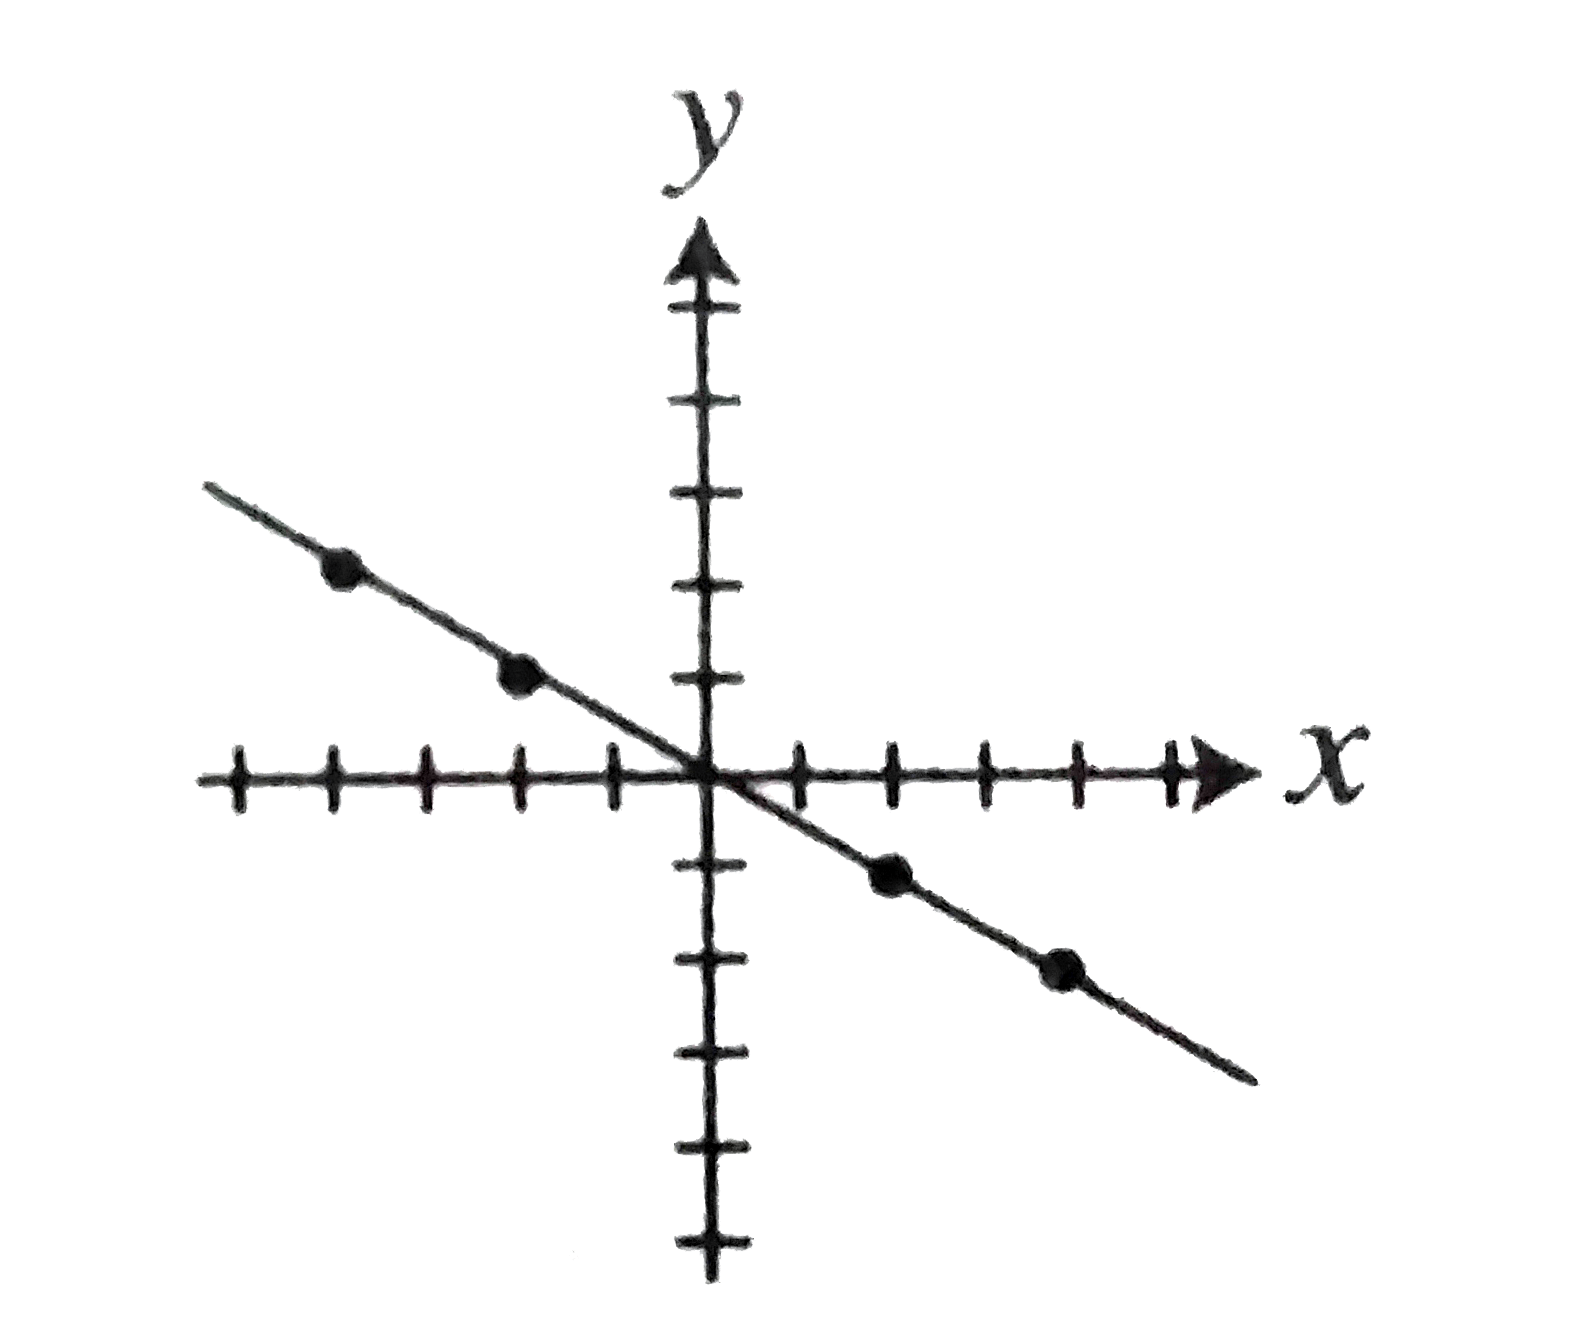 D
D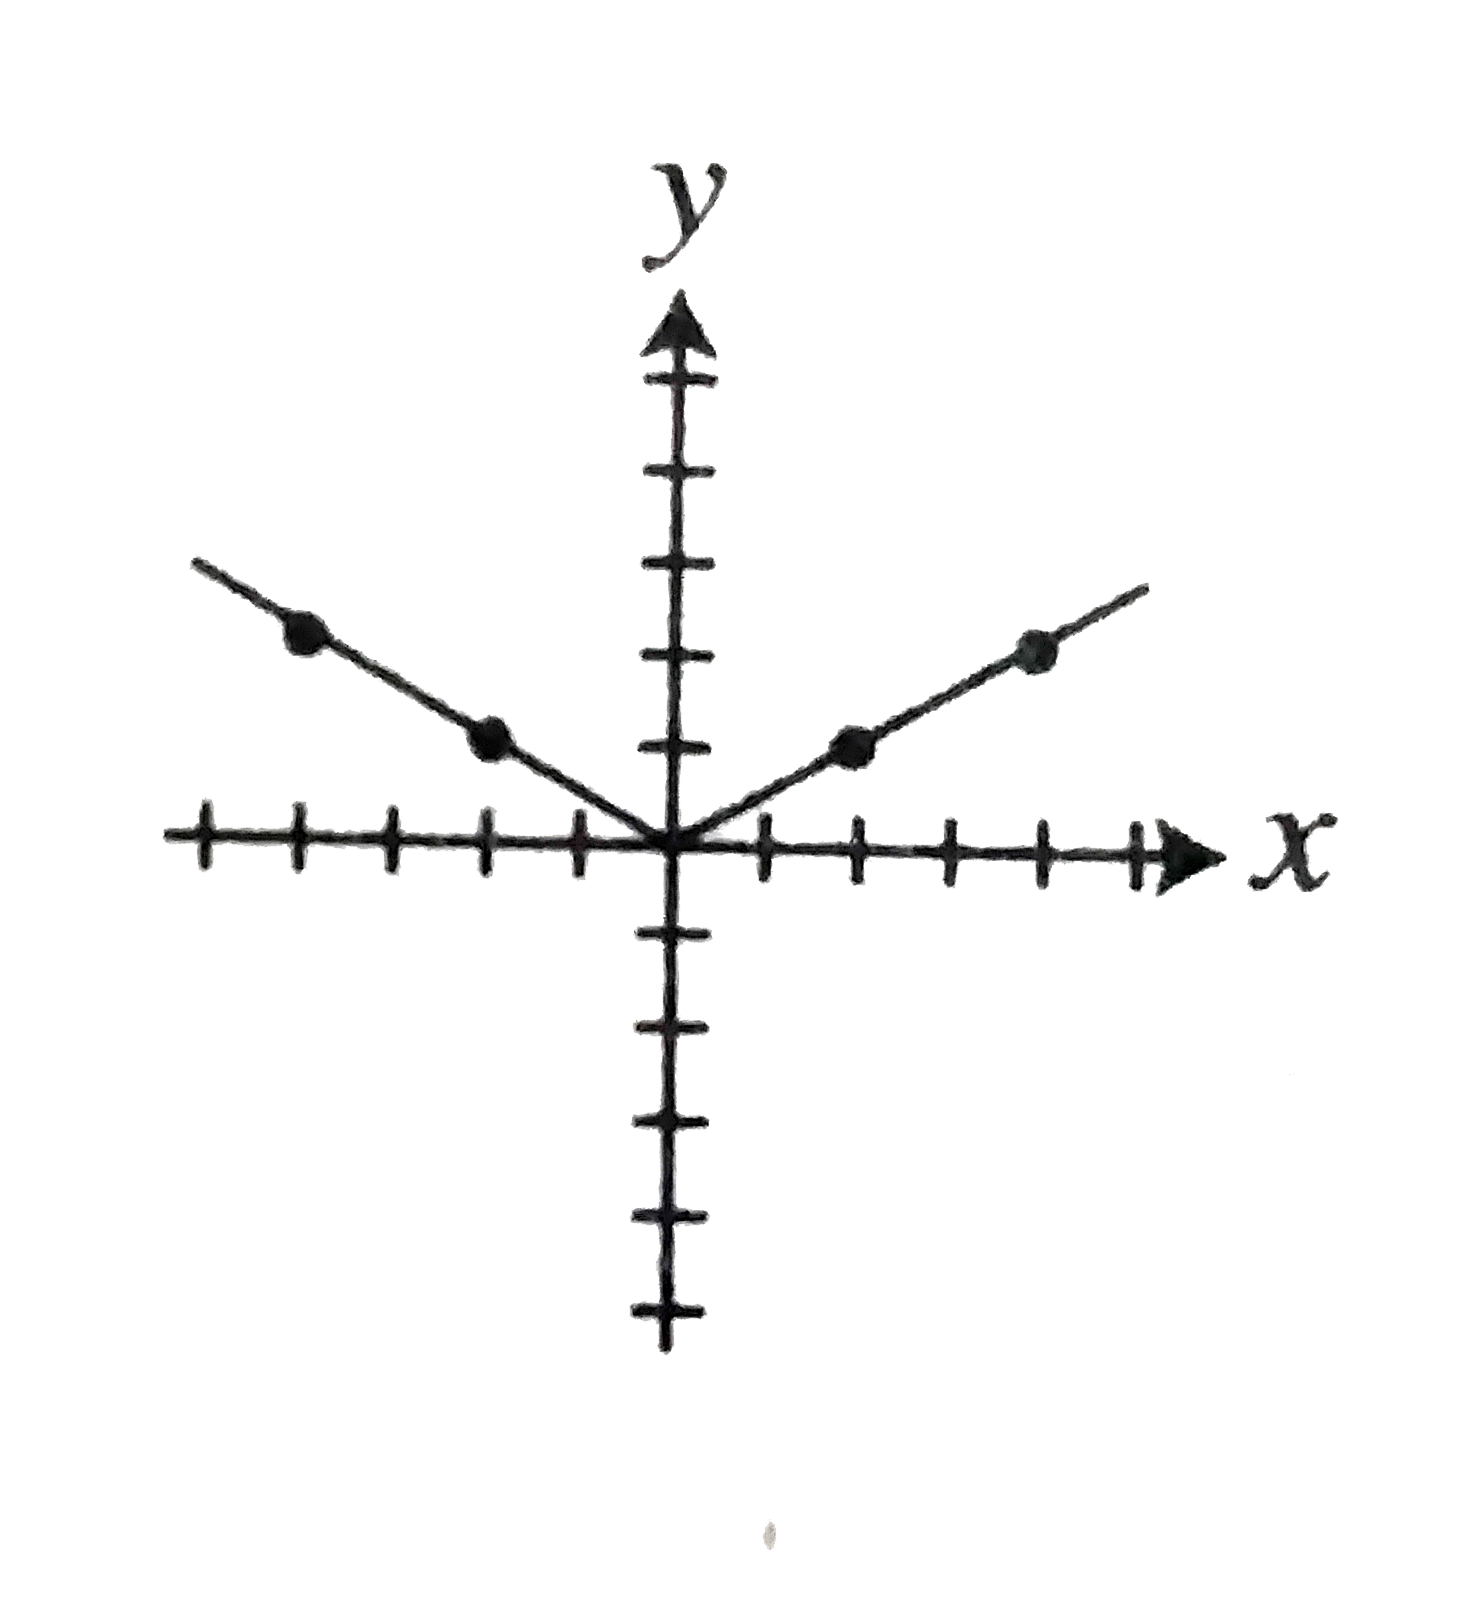
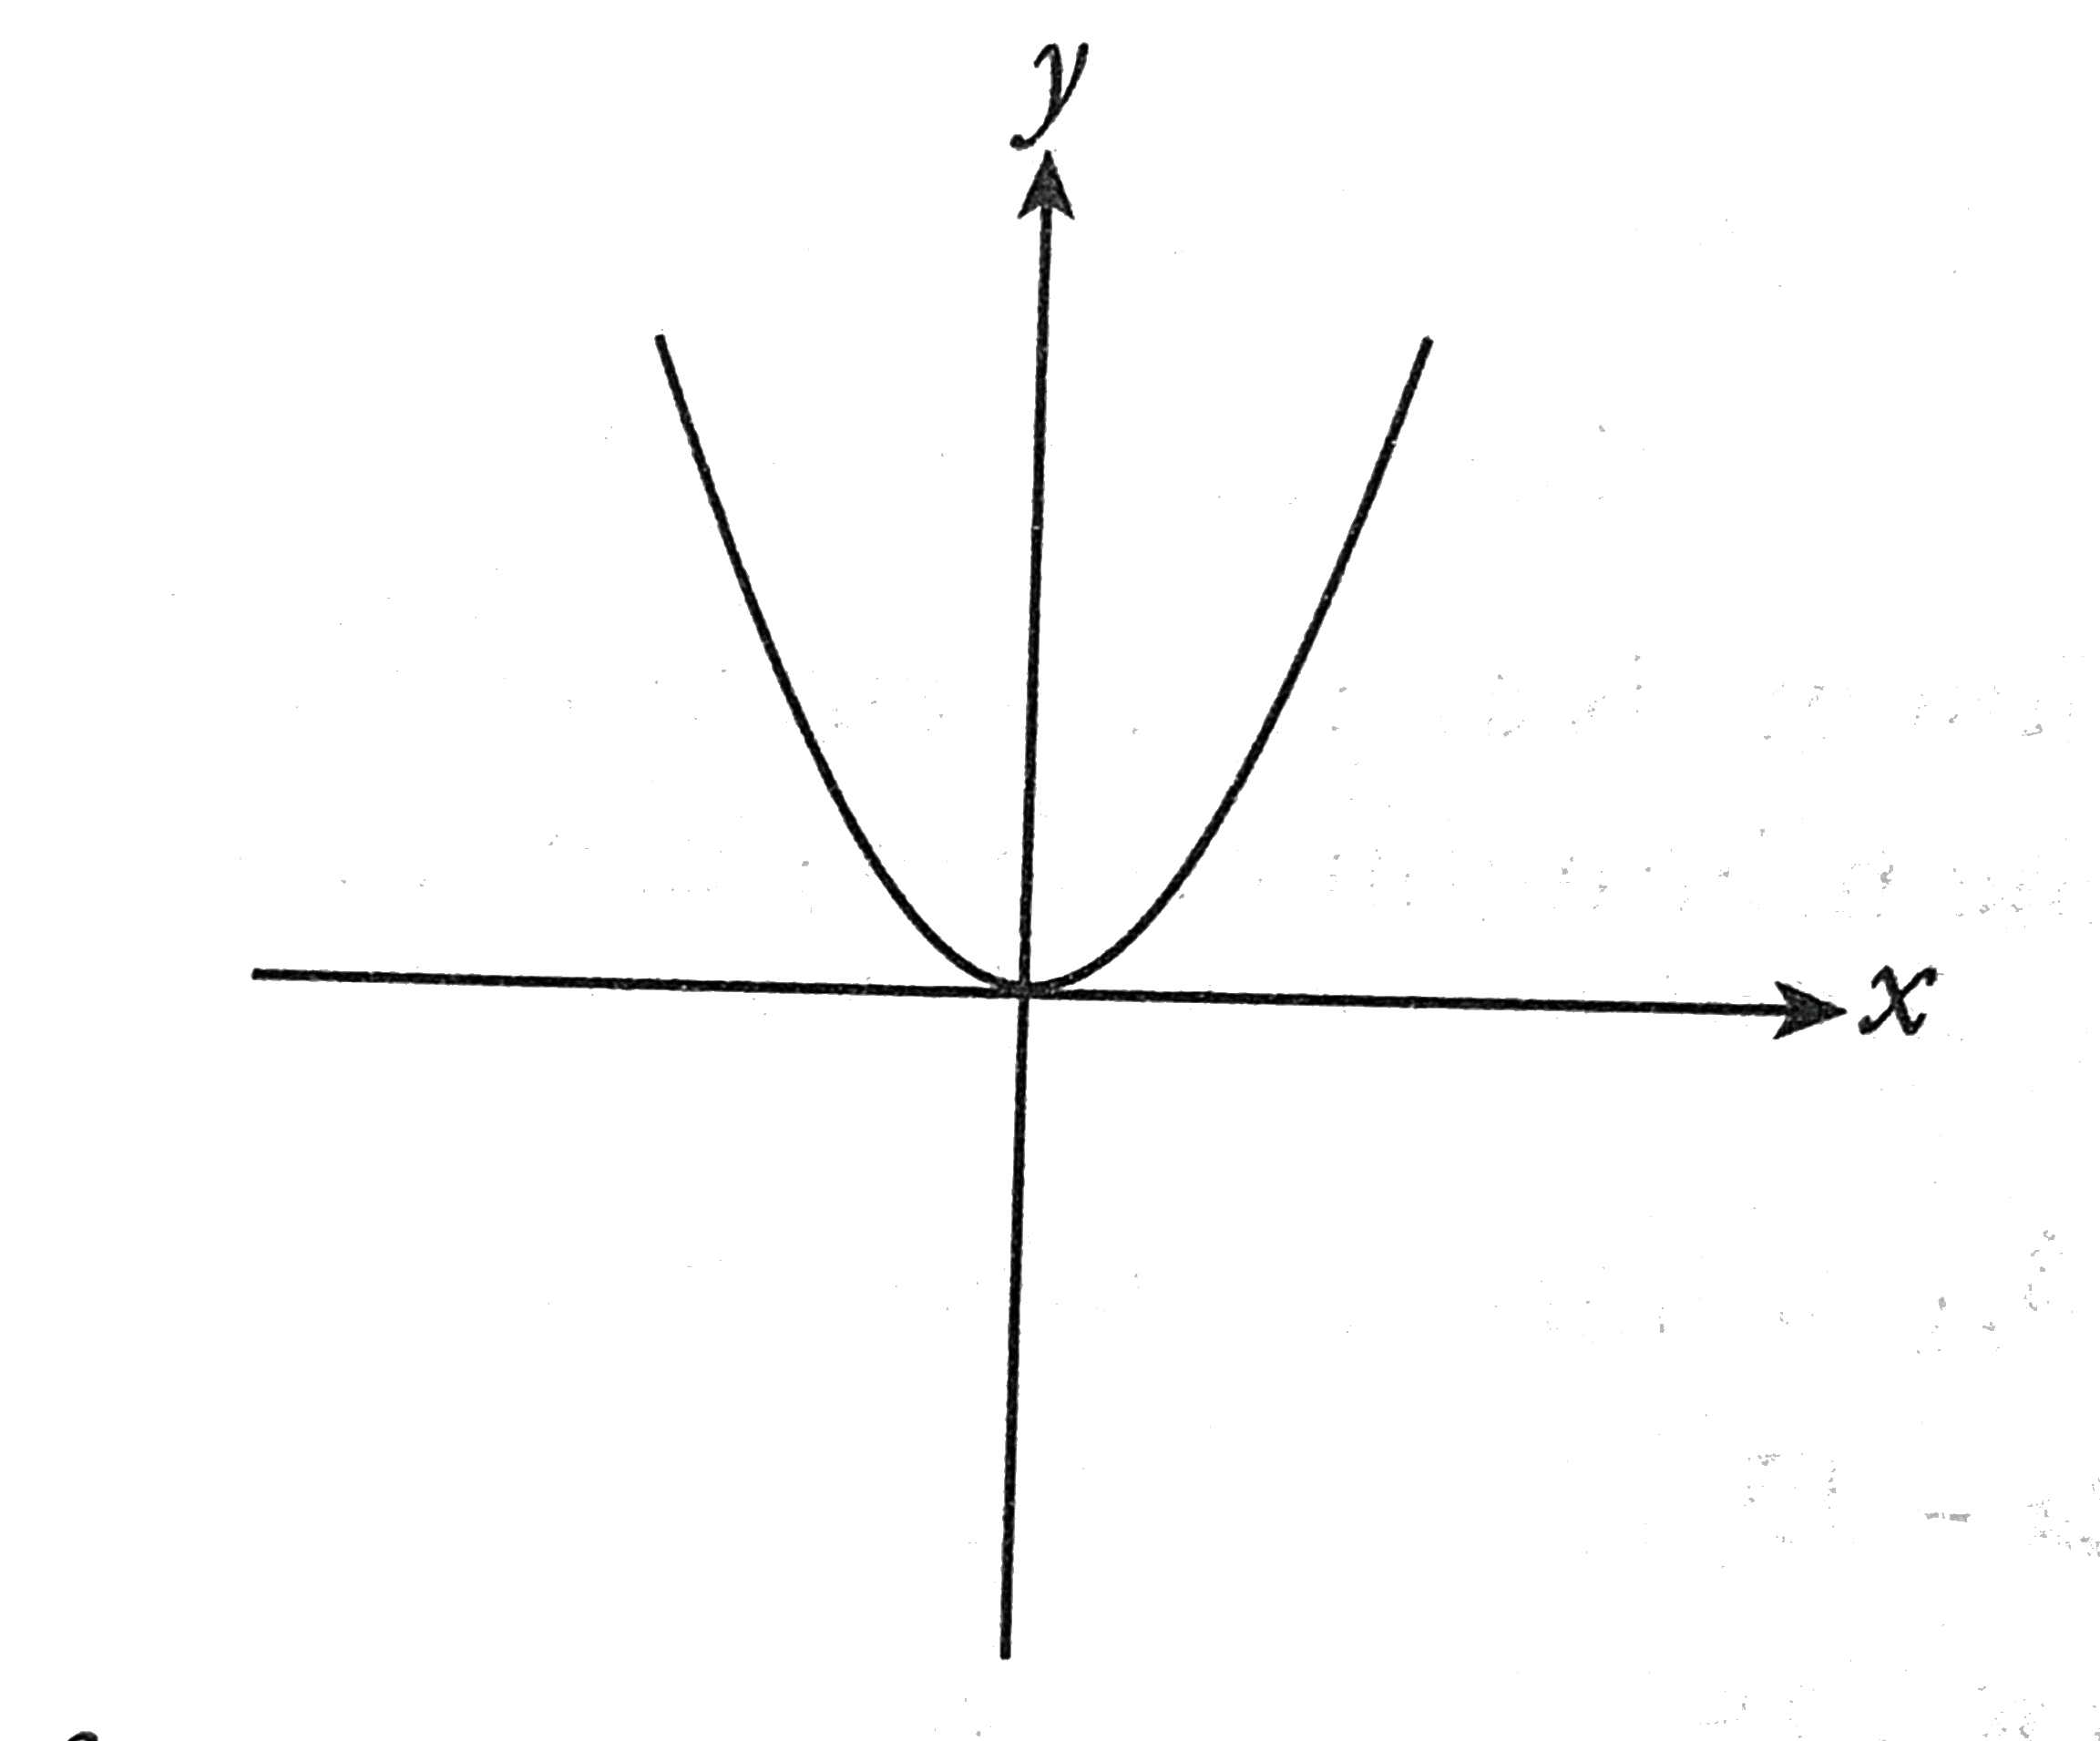
The quadratic y=f(x) is shown above. Which of the following graphs represents the function y=f(x+3)−4?A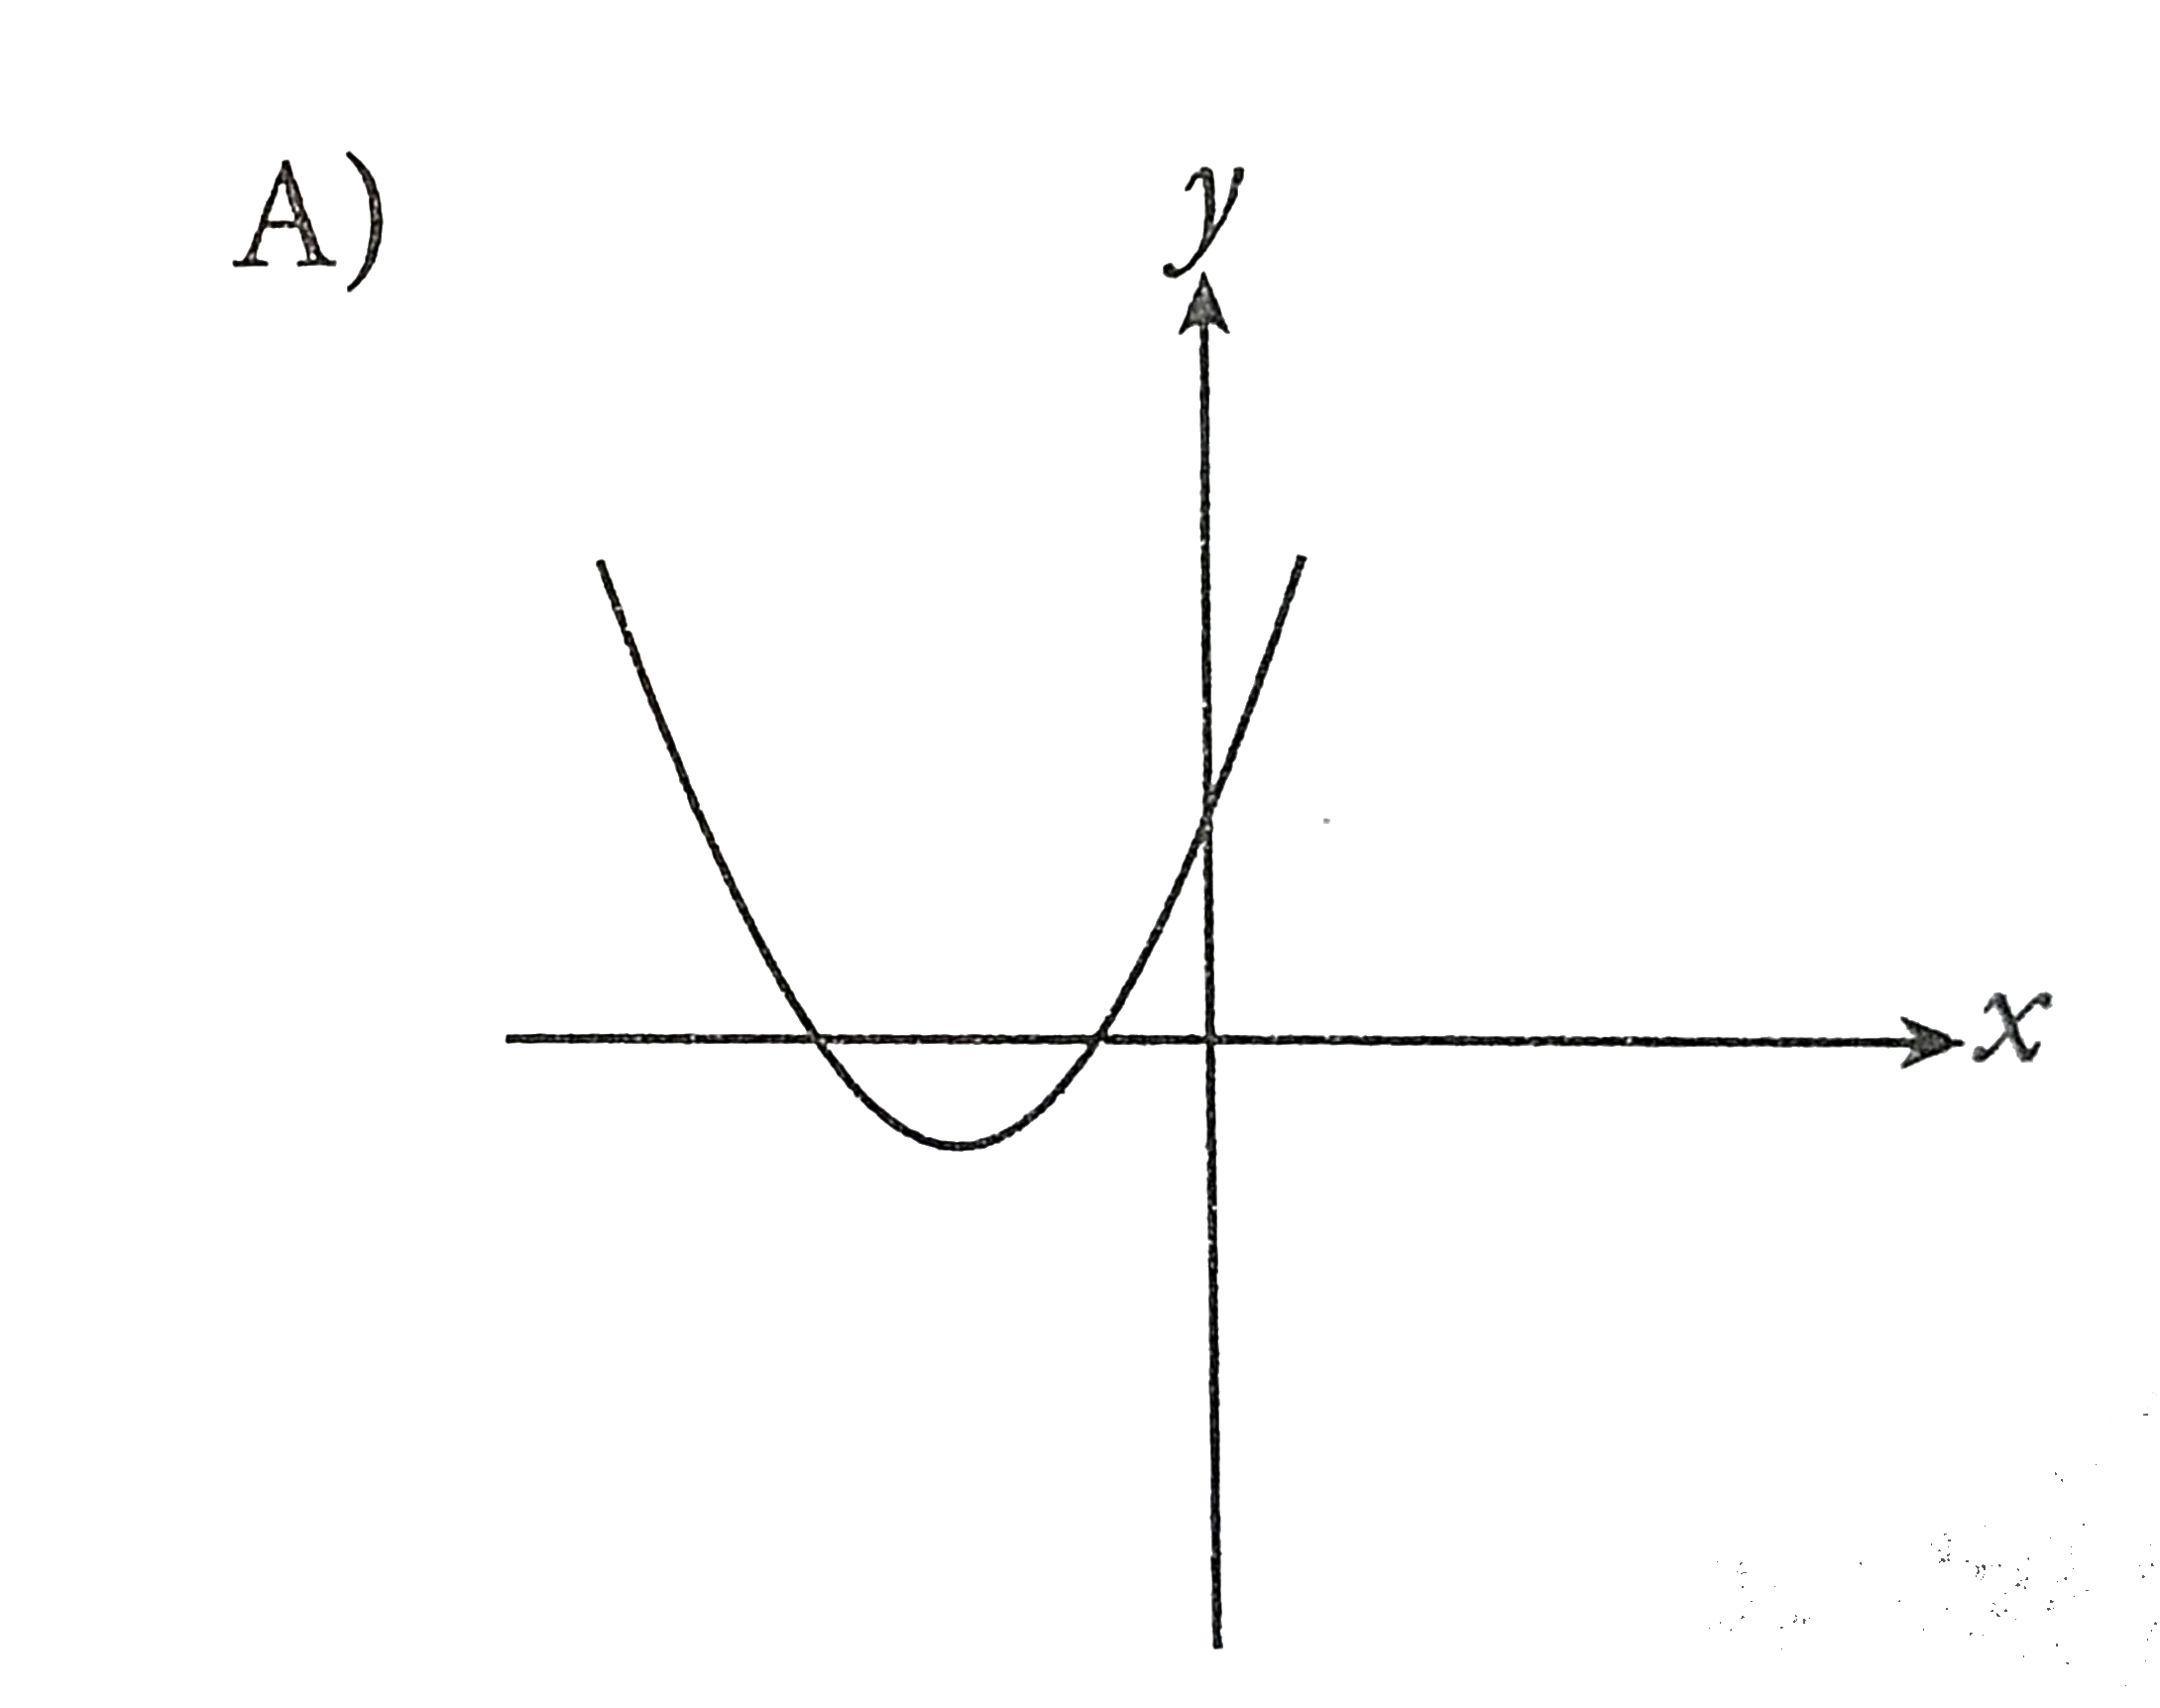 B
B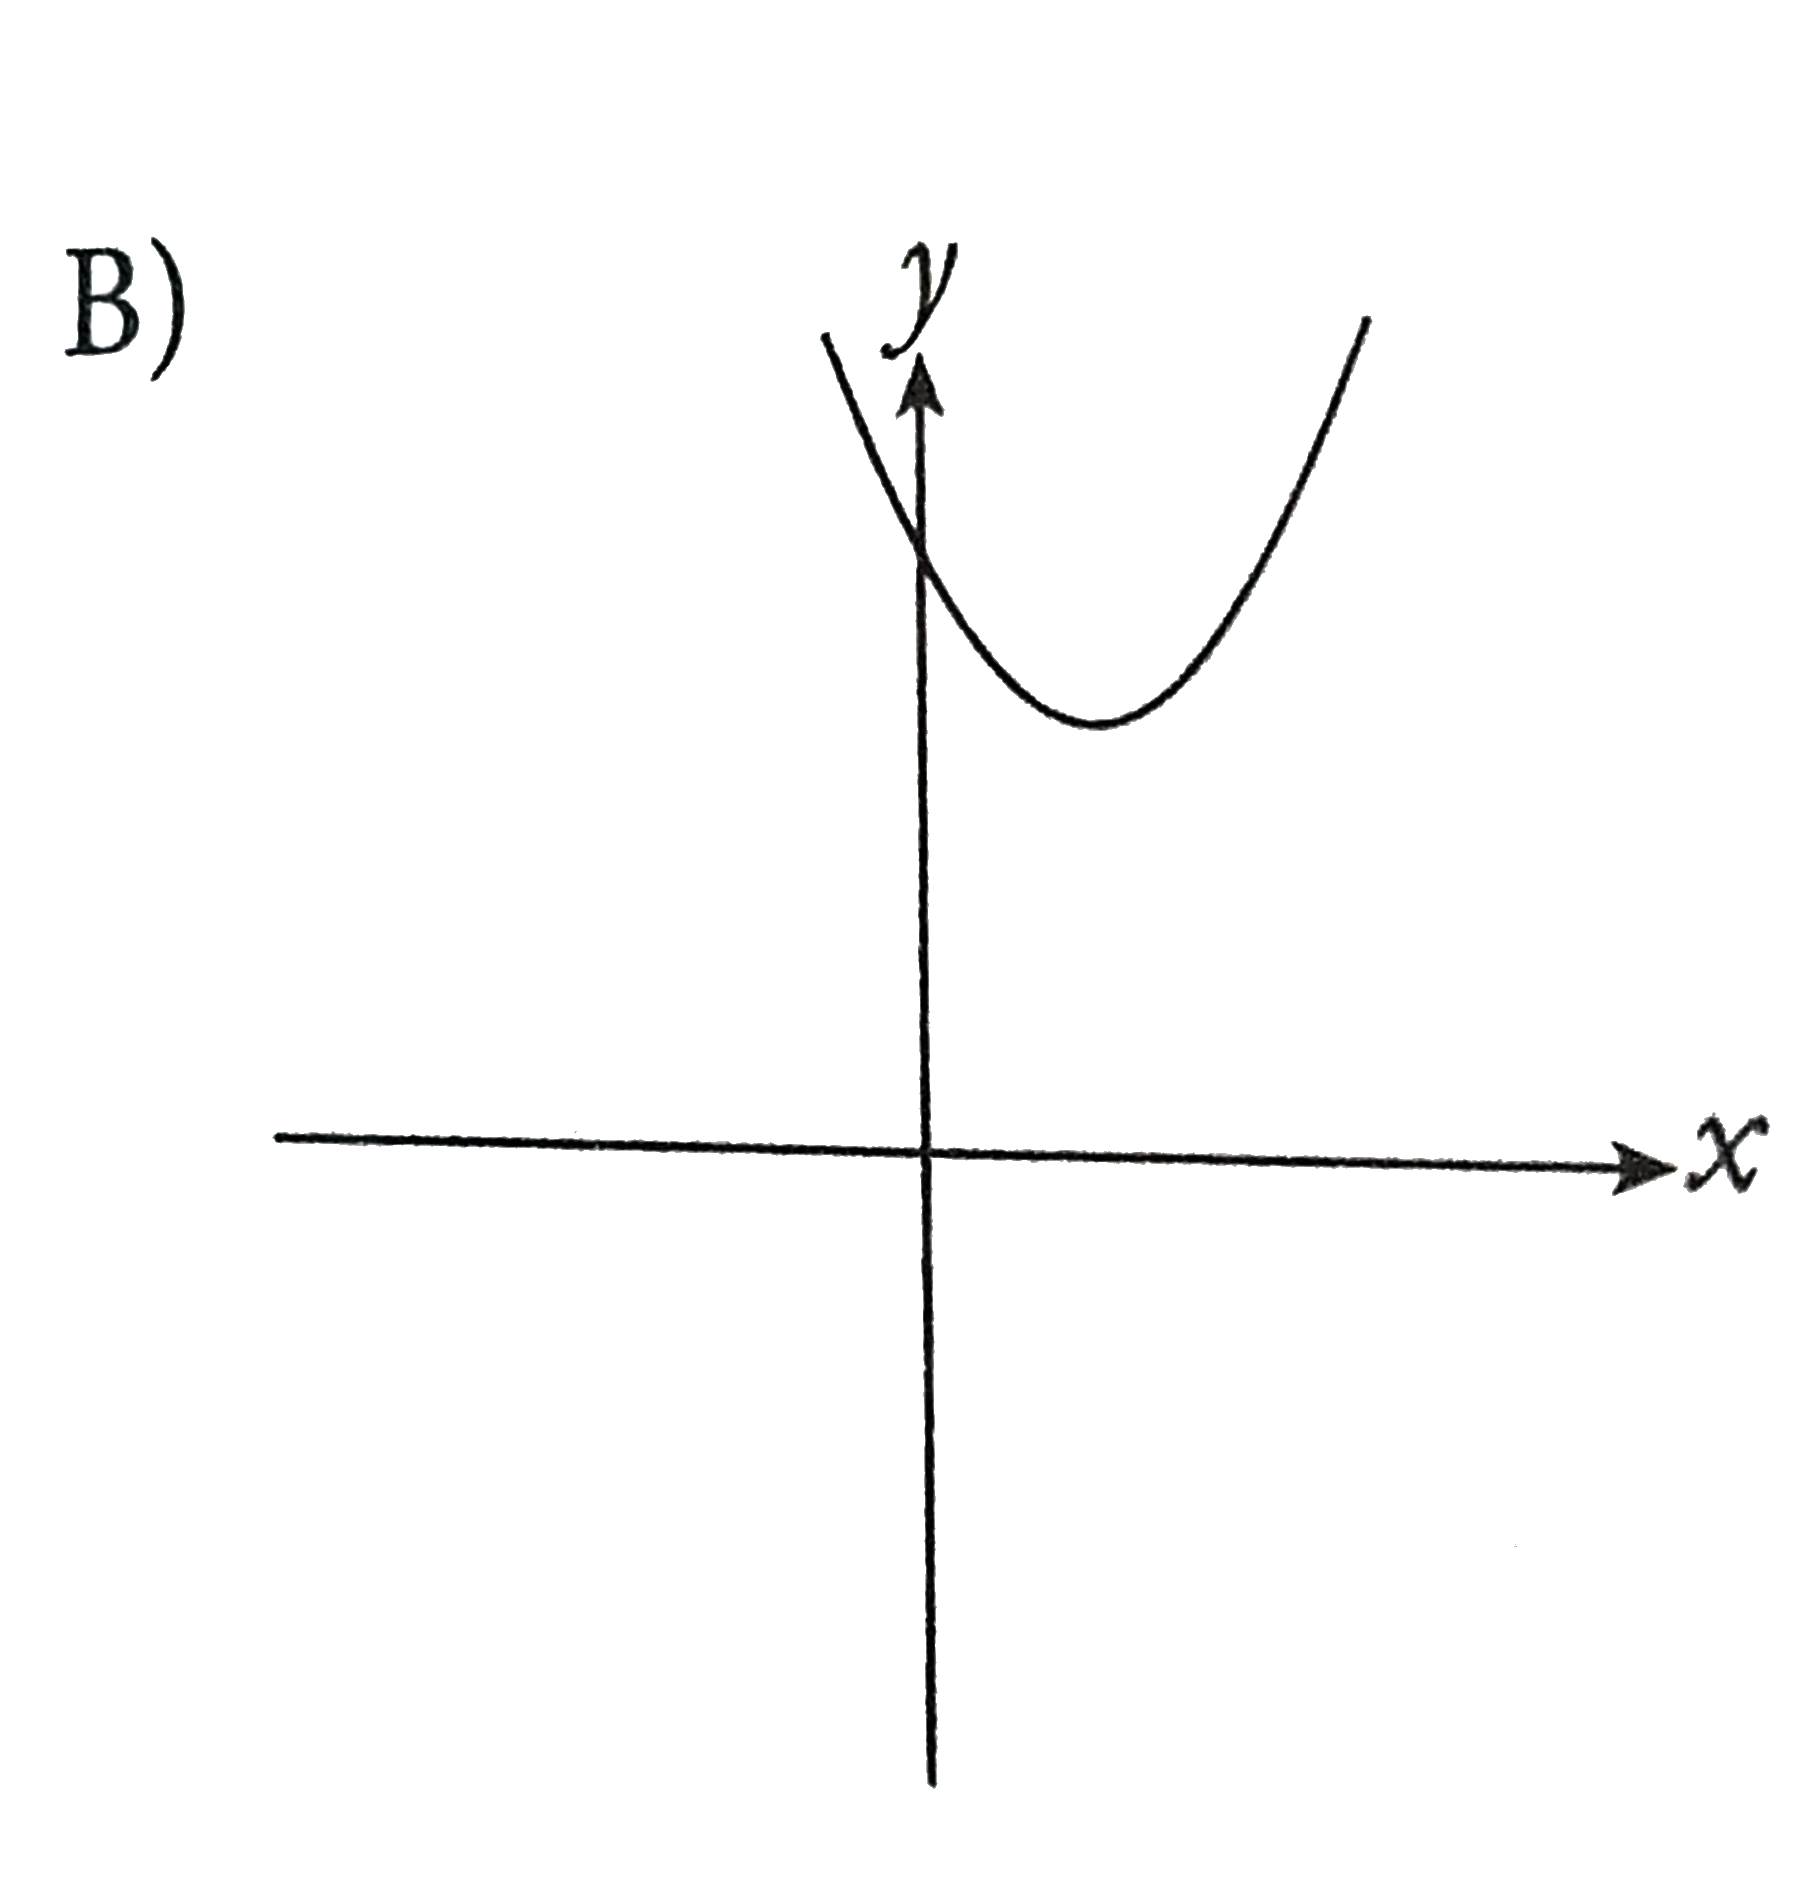 C
C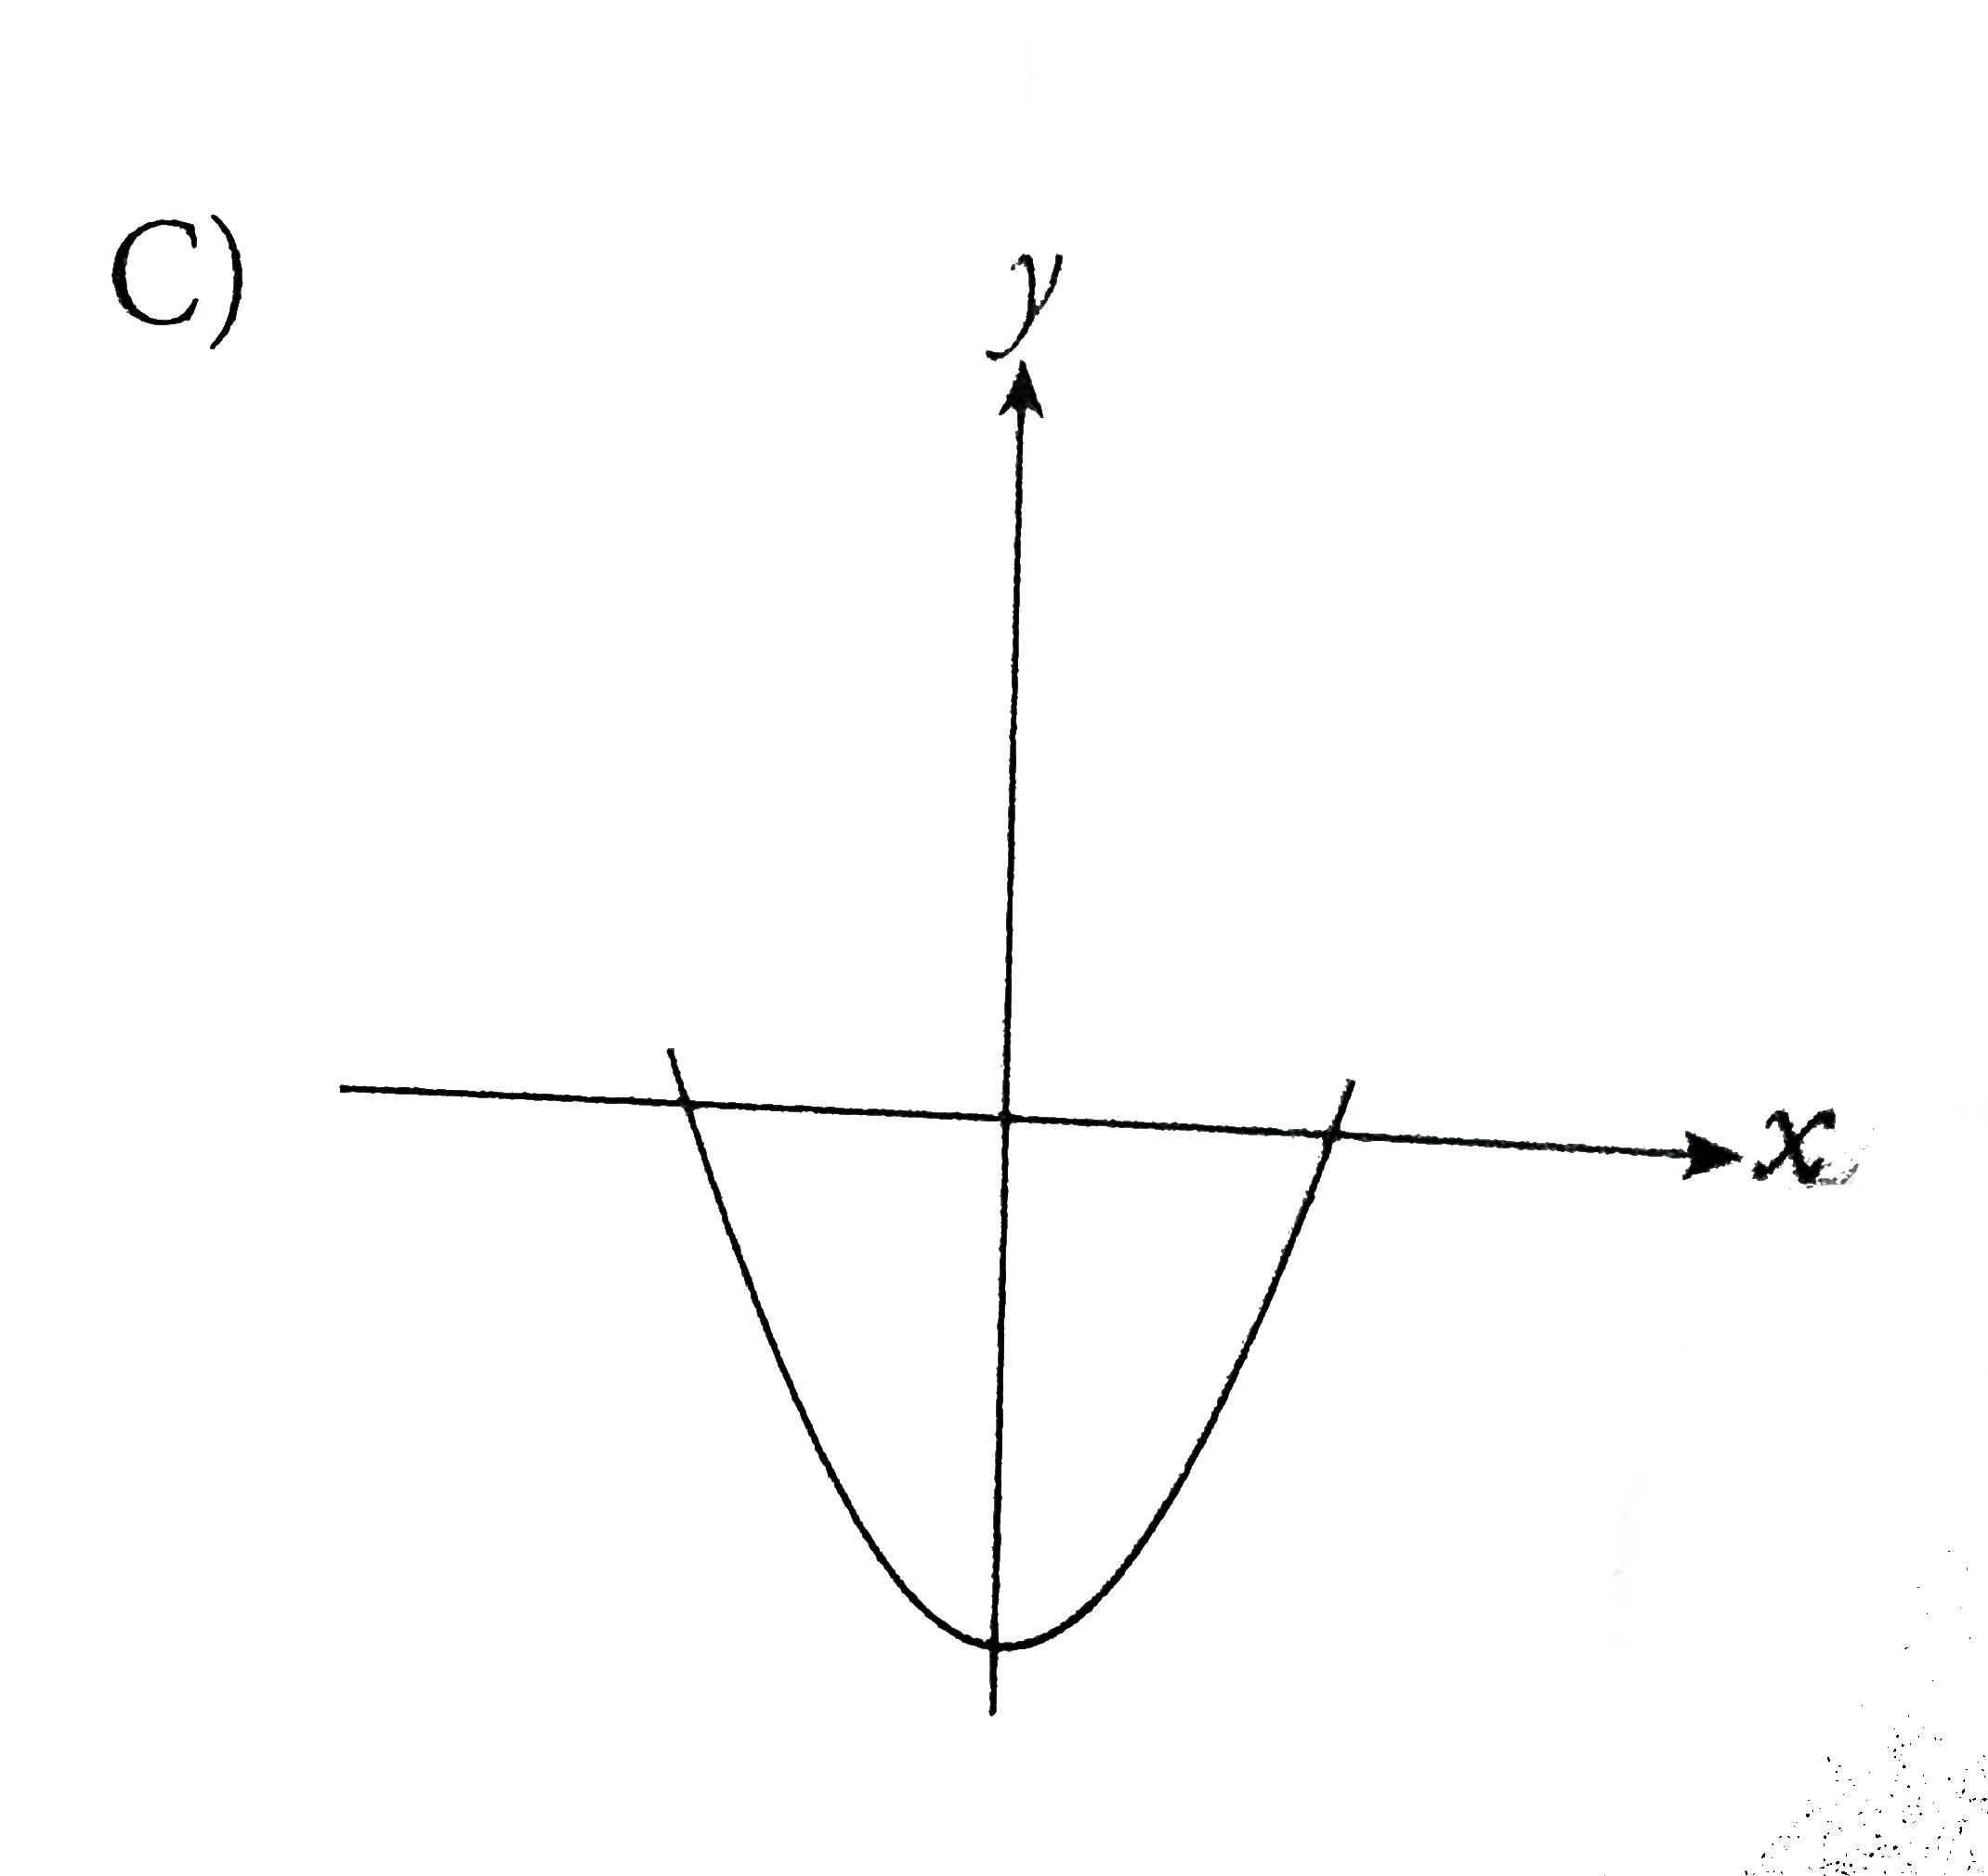 D
D
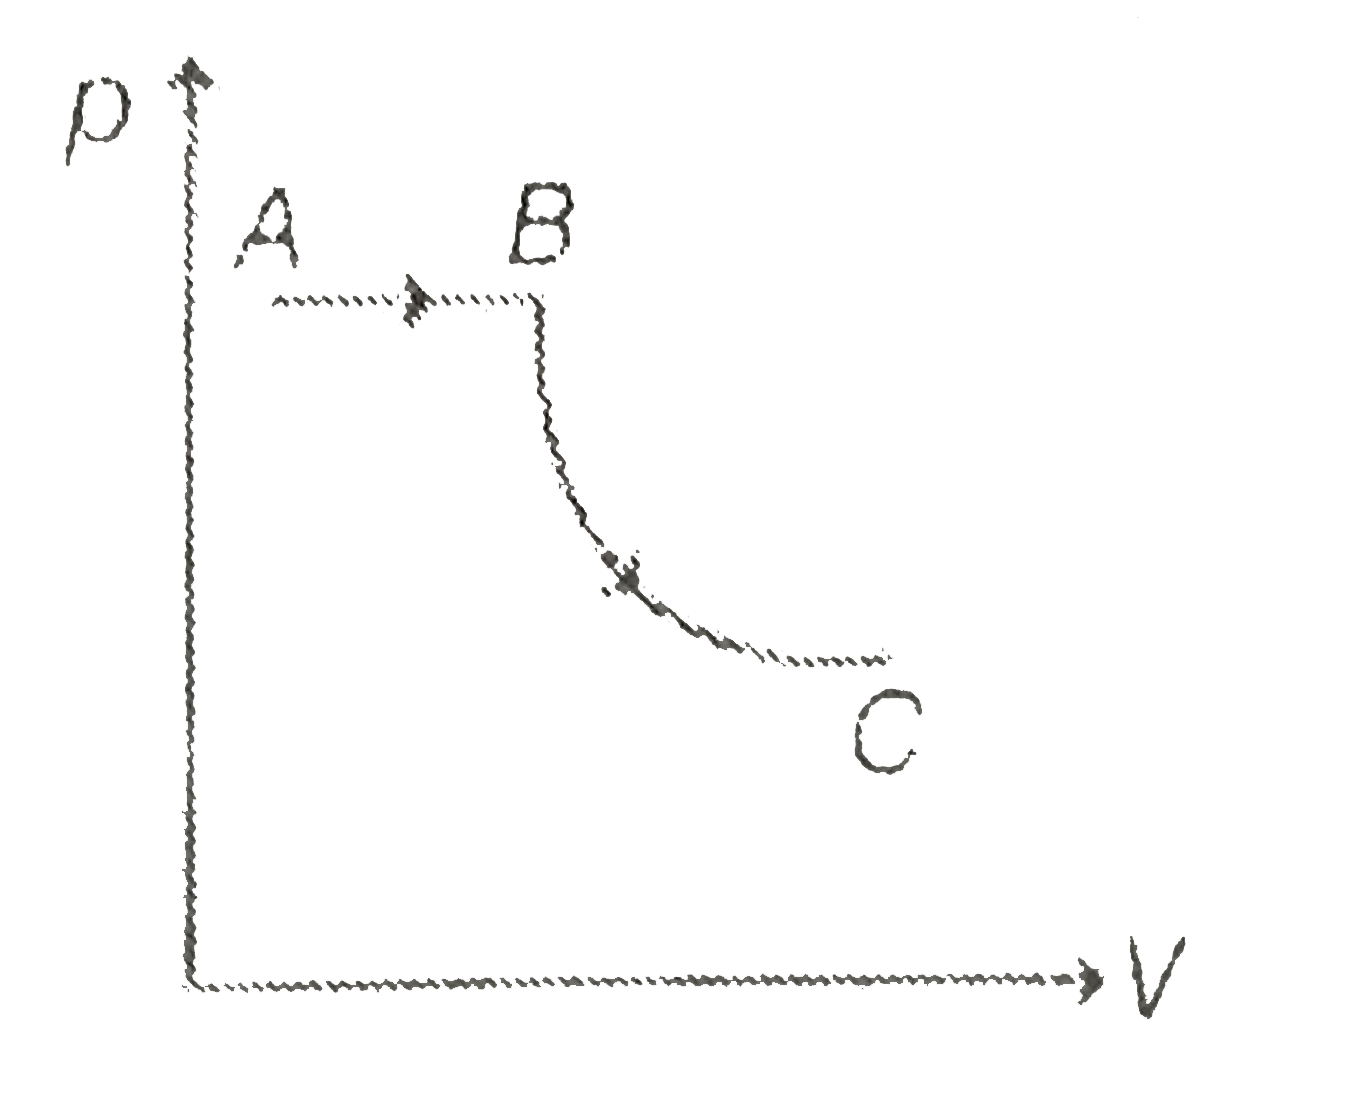
A process is shown in the diagram. Which of the following curves may represent the same process ? BC is rectangular hyperbola.
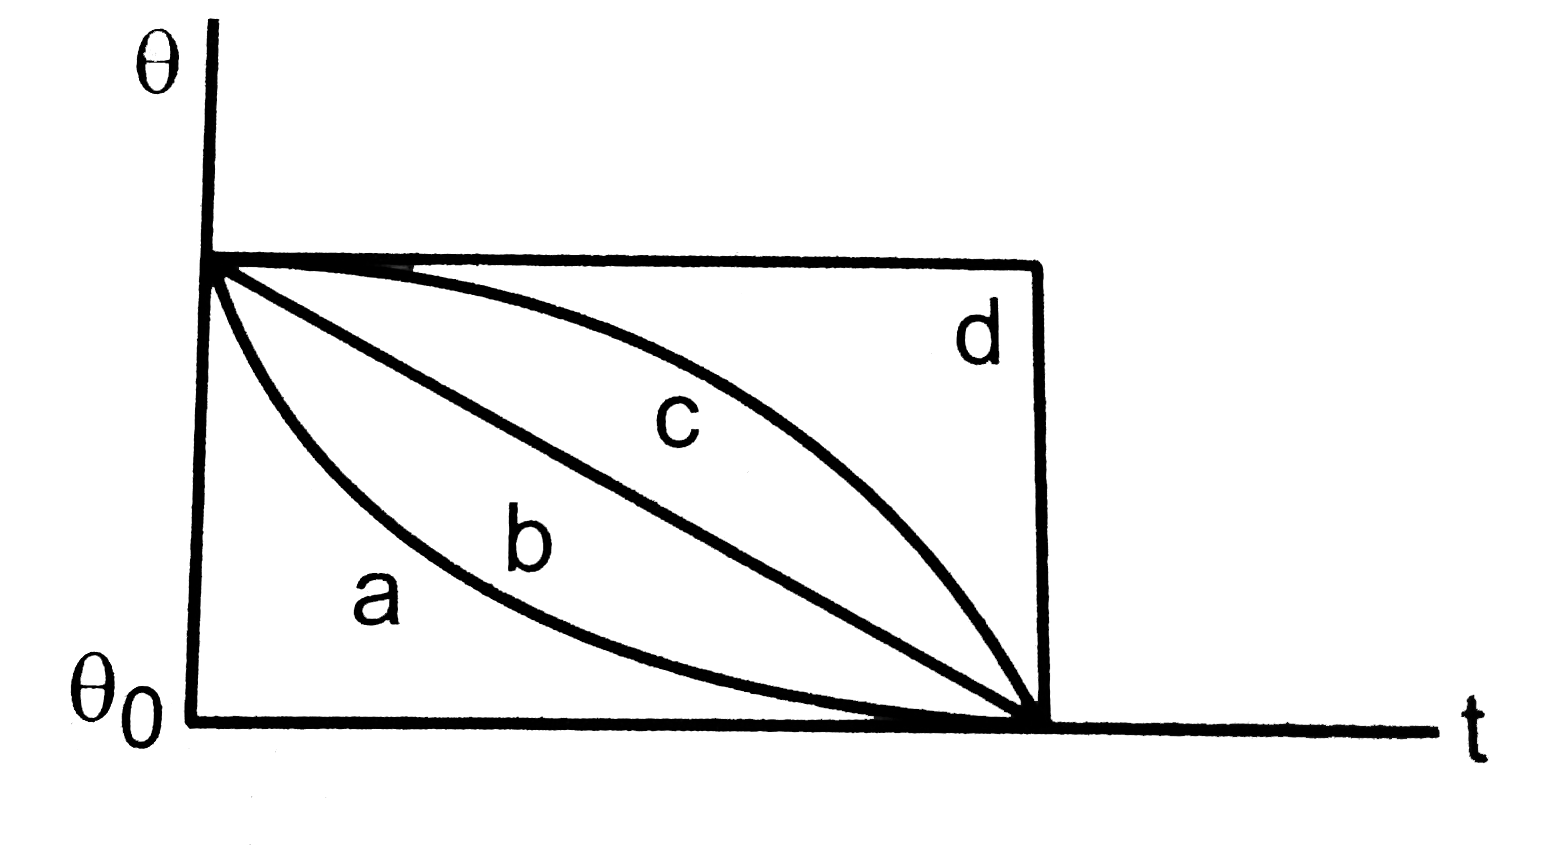
View SolutionA hot liquid is kept in a big room. Its temperature is plotted as a function of time. Which of the following curves may represent the plot?
View SolutionA hot liquid is kept in a big room. According to Newton's law of cooling rate of cooling liquid (represented as y) is plotted against its temperature T. Which of the following curves may represent the plot?
View SolutionWhich of the following curves represents the Henry's law ?
View SolutionThe graph of y=f(x) is shown below.
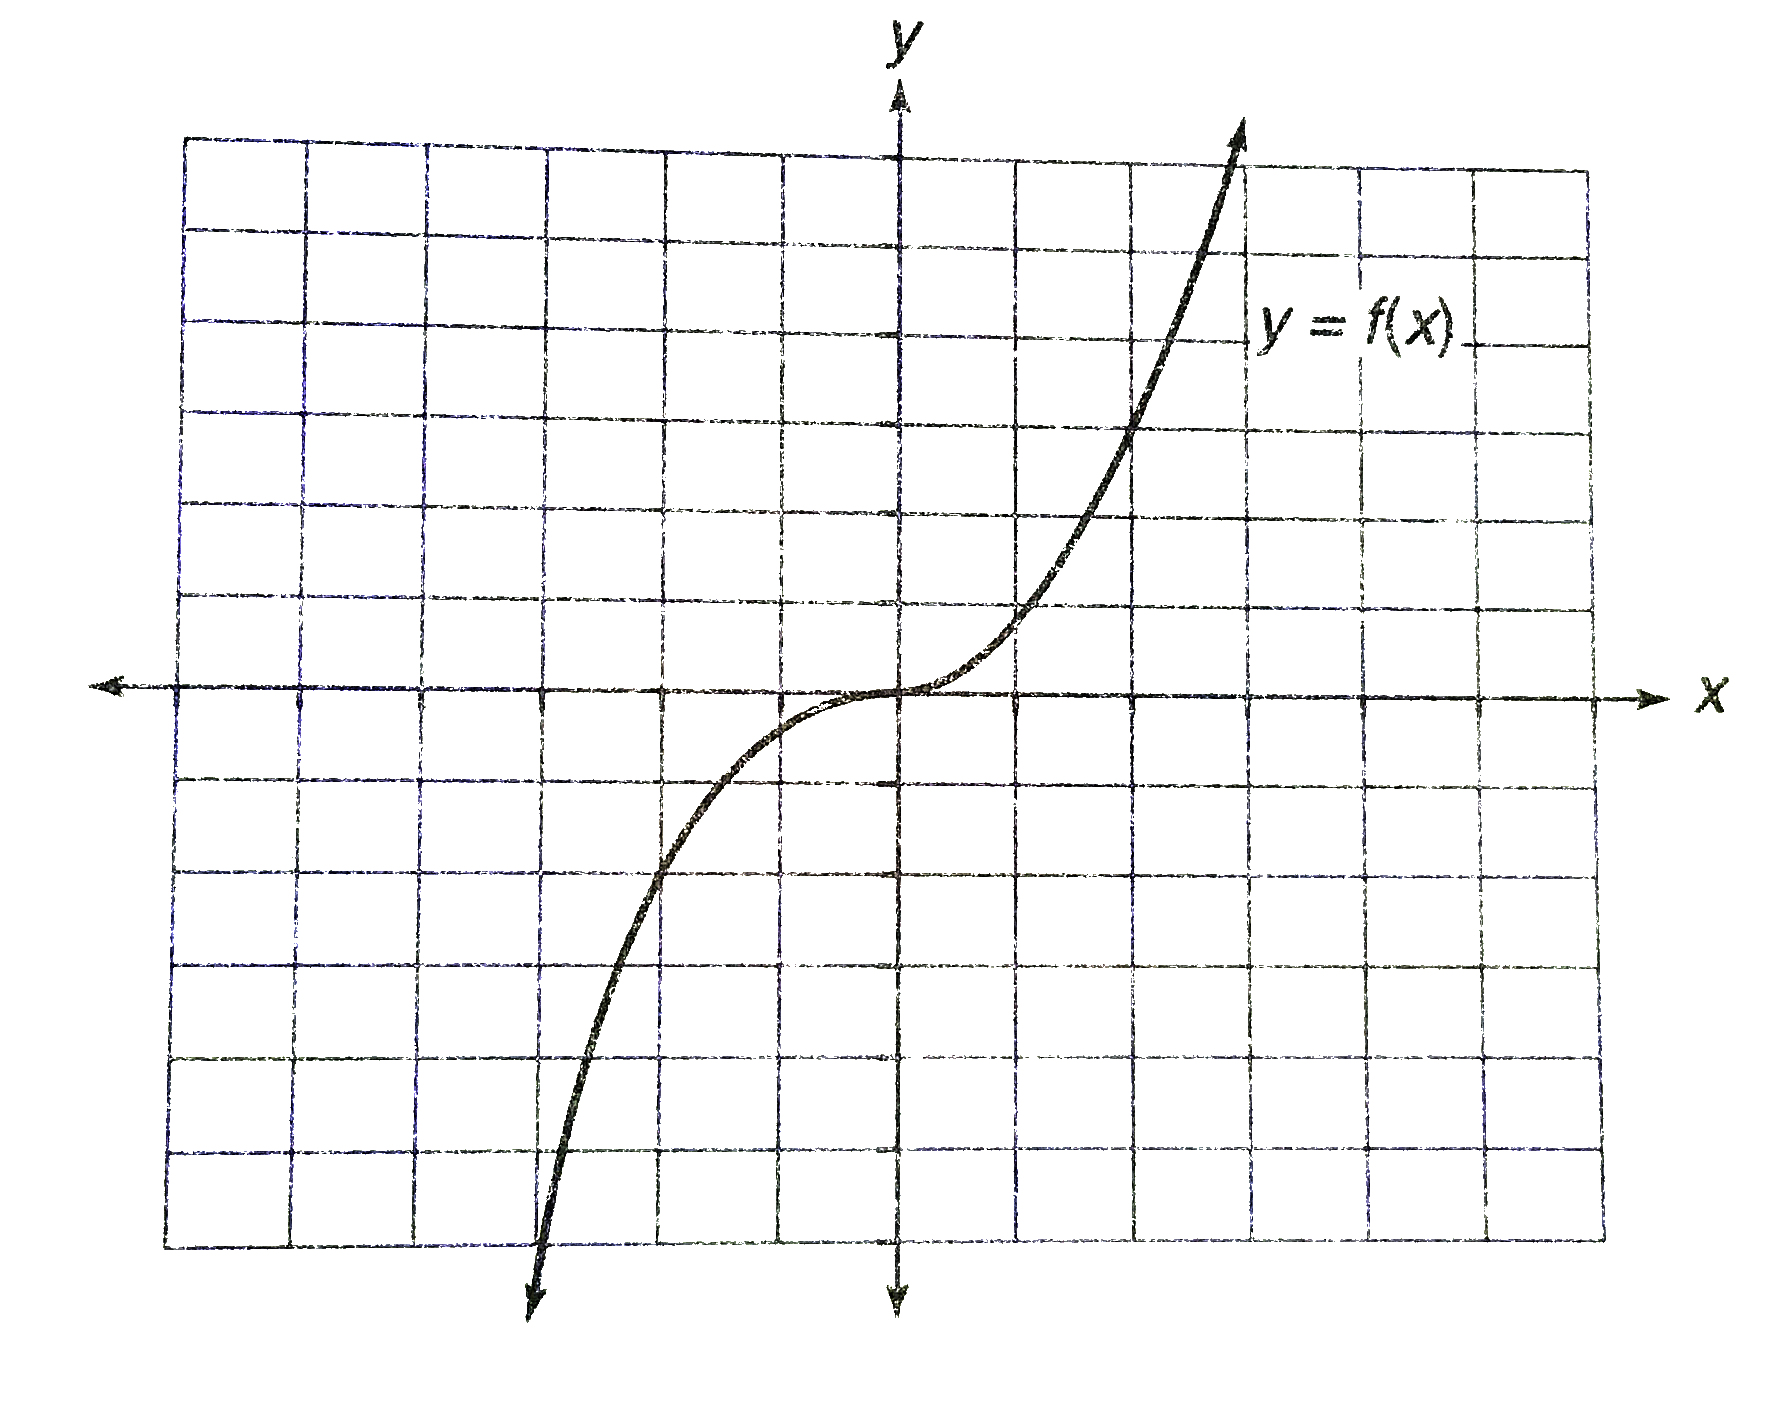
Which of the following could represents the graph of y=f(x−2)+1?
View Solution

