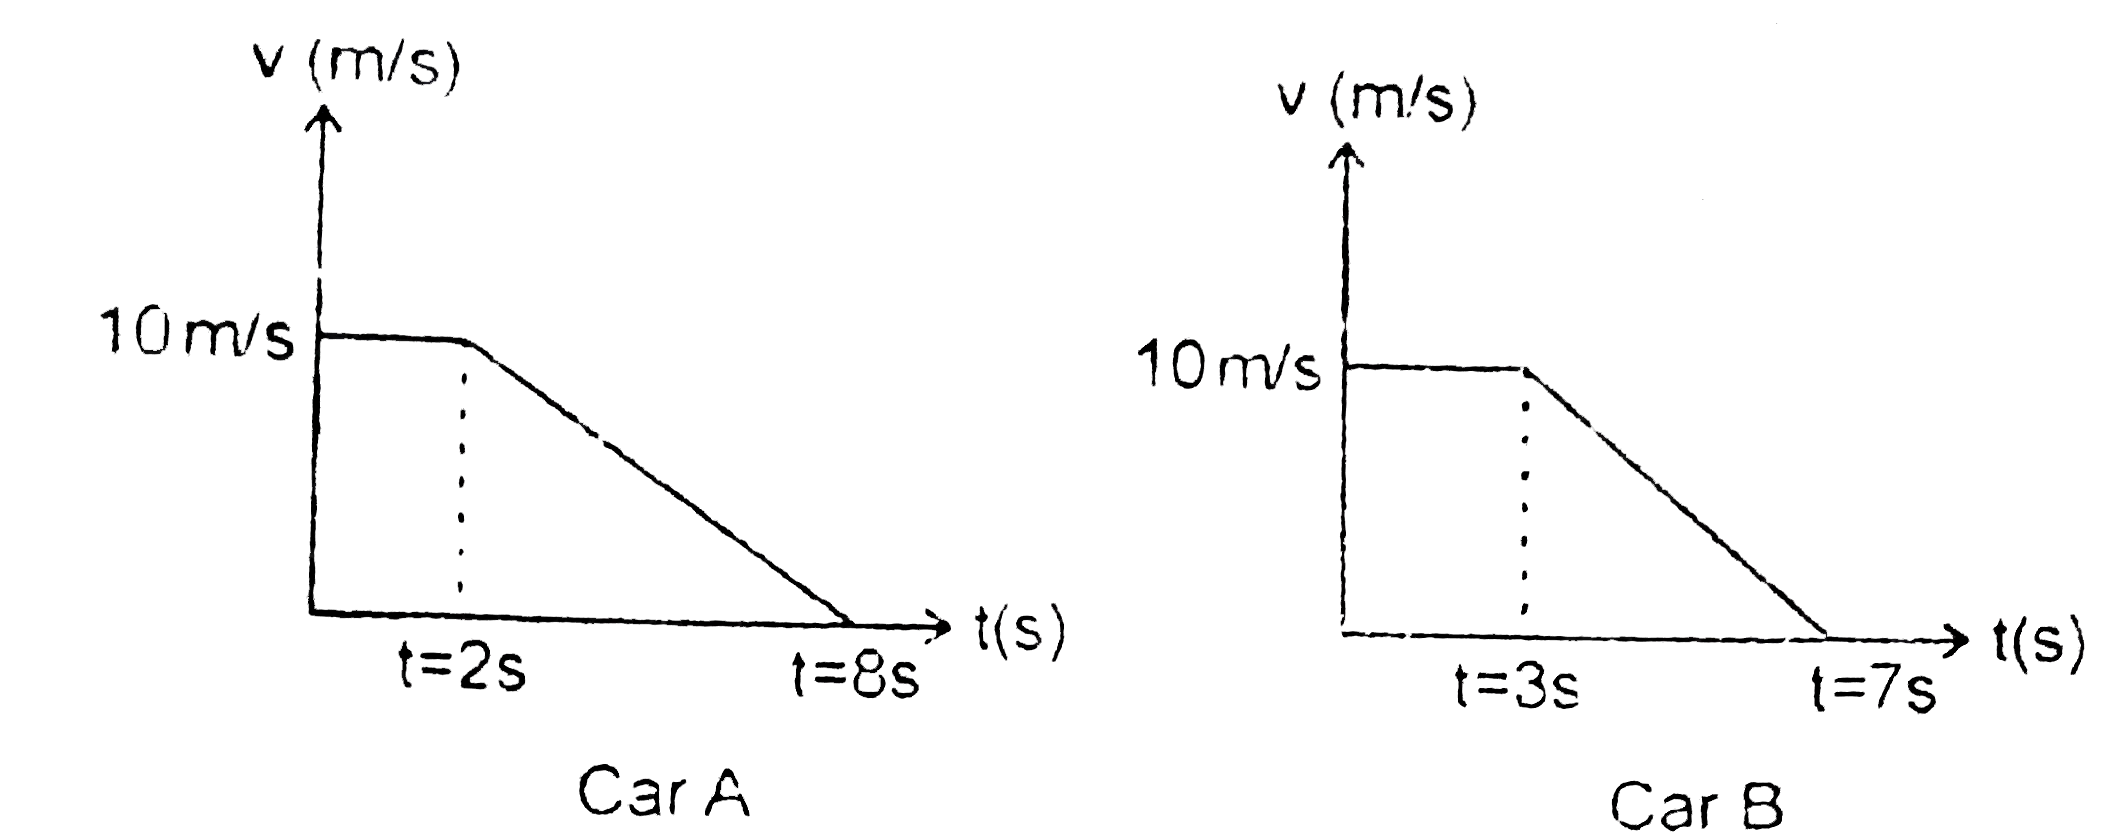
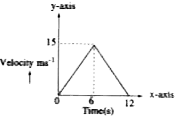
Car and car move on a straight road and their velocity versus time graph are as shown in figure. Comparing the motion or car in between to . And motion of car in between to ., pick up the correct statement.
 .
.
Distance travelled by car is less than distance by car
Distance travelled by car is greater than distance travelled b y car
Average speed of both cars are equal.
Average speed of car is less than average speed of car
The correct Answer is:D
Step by step video & image solution for Car A and car B move on a straight road and their velocity versus time graph are as shown in figure. Comparing the motion or car A in between t=0 to t =8 sec. And motion of car B in between t=0 to t=7 sec., pick up the correct statement. . by Physics experts to help you in doubts & scoring excellent marks in Class 12 exams.
Updated on:21/07/2023Topper's Solved these Questions
- DAILY PRACTICE PROBLEMBook:RESONANCE ENGLISHChapter:DAILY PRACTICE PROBLEMExercise:DPP No.8
Explore 9 Videos
- DAILY PRACTICE PROBLEMBook:RESONANCE ENGLISHChapter:DAILY PRACTICE PROBLEMExercise:DPP No.9
Explore 20 Videos
- DAILY PRACTICE PROBLEMBook:RESONANCE ENGLISHChapter:DAILY PRACTICE PROBLEMExercise:DPP No.6
Explore 9 Videos
- CURRENT ELECTRICITYBook:RESONANCE ENGLISHChapter:CURRENT ELECTRICITYExercise:High Level Problems (HIP)
Explore 19 Videos
- ELECTRO MAGNETIC WAVESBook:RESONANCE ENGLISHChapter:ELECTRO MAGNETIC WAVESExercise:Exercise 3
Explore 27 Videos
Similar Questions
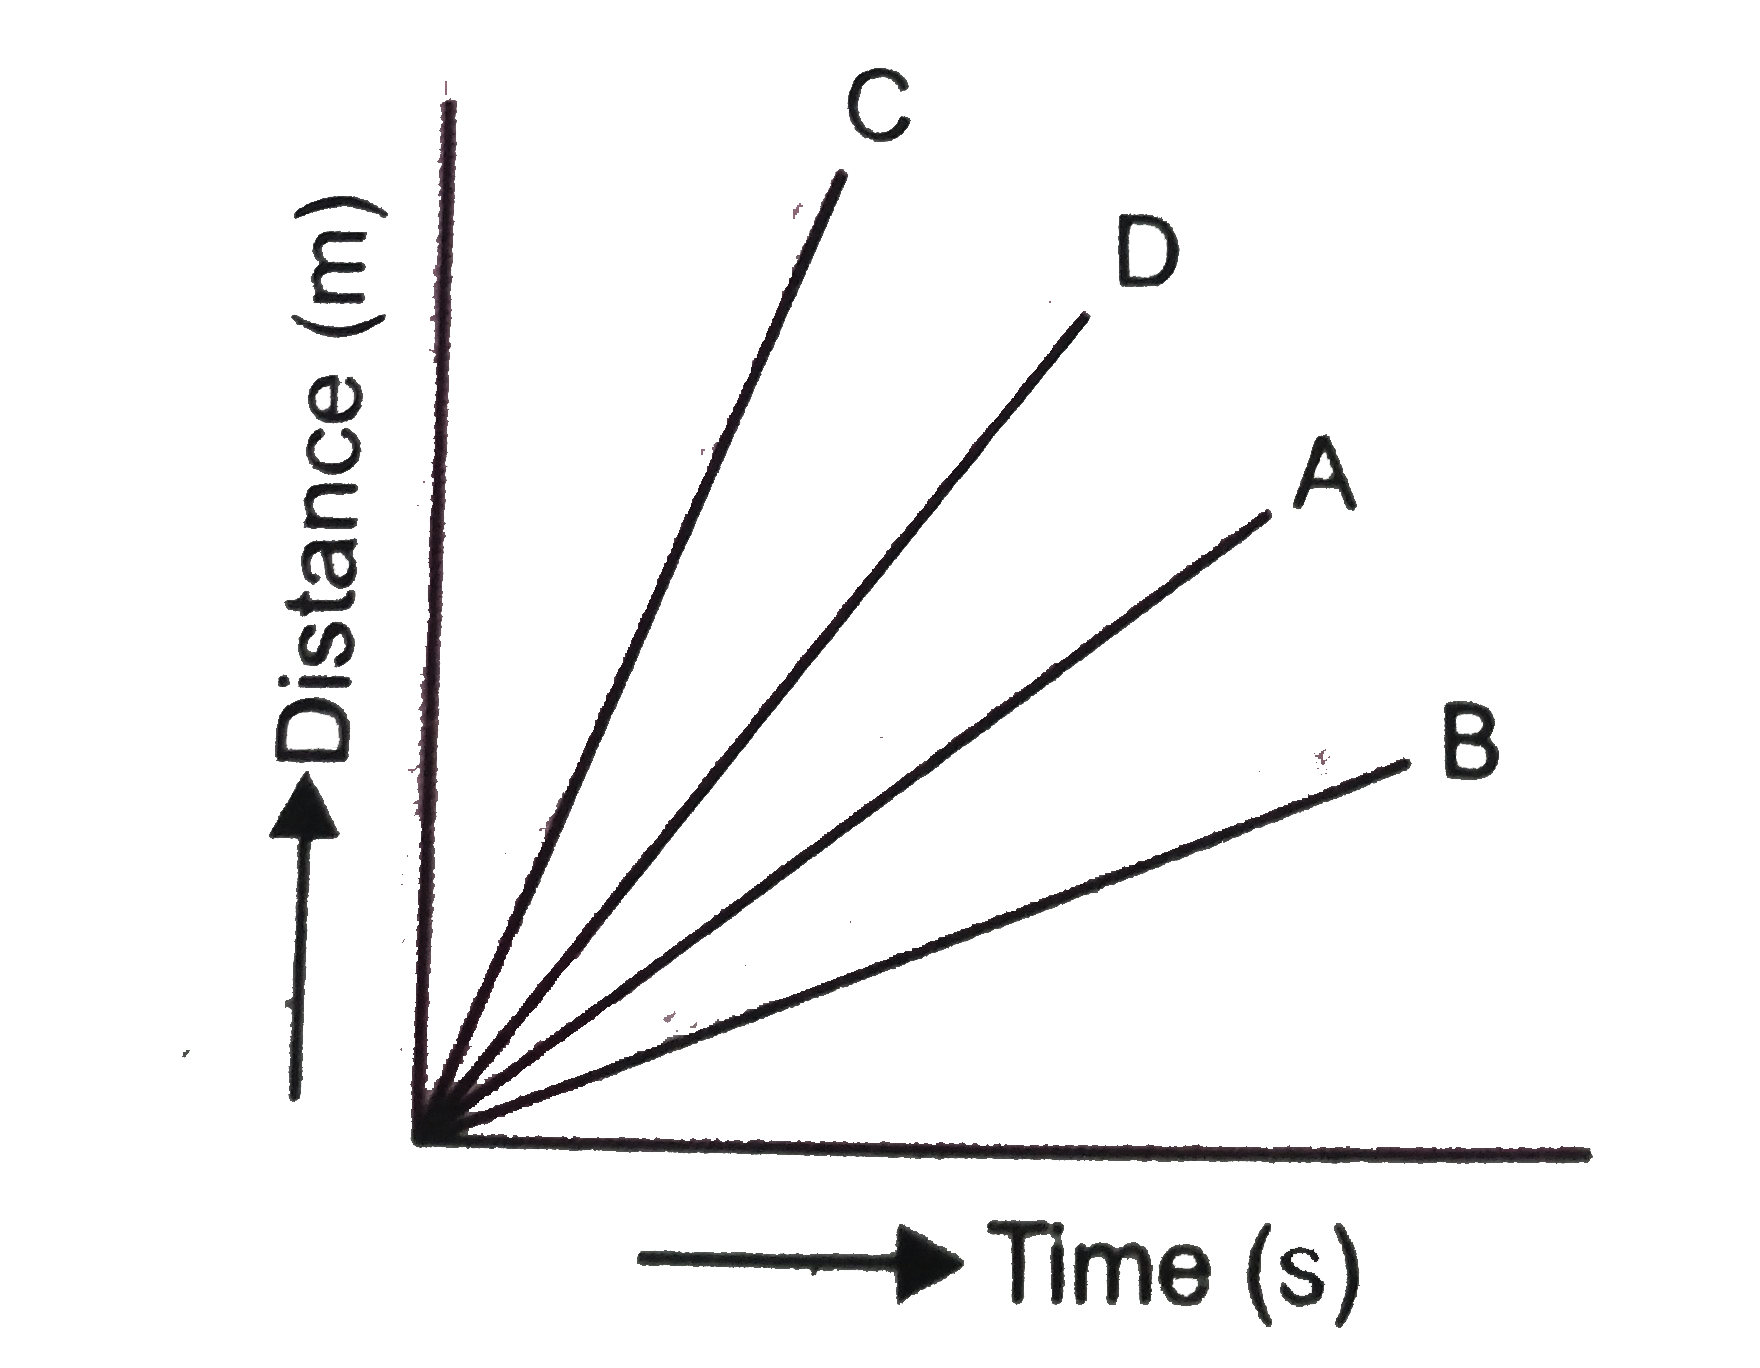
Four cars A,B and C are moving on a levelled road. Their distance versus time graphs are shown in Fig. Choose the correct statement
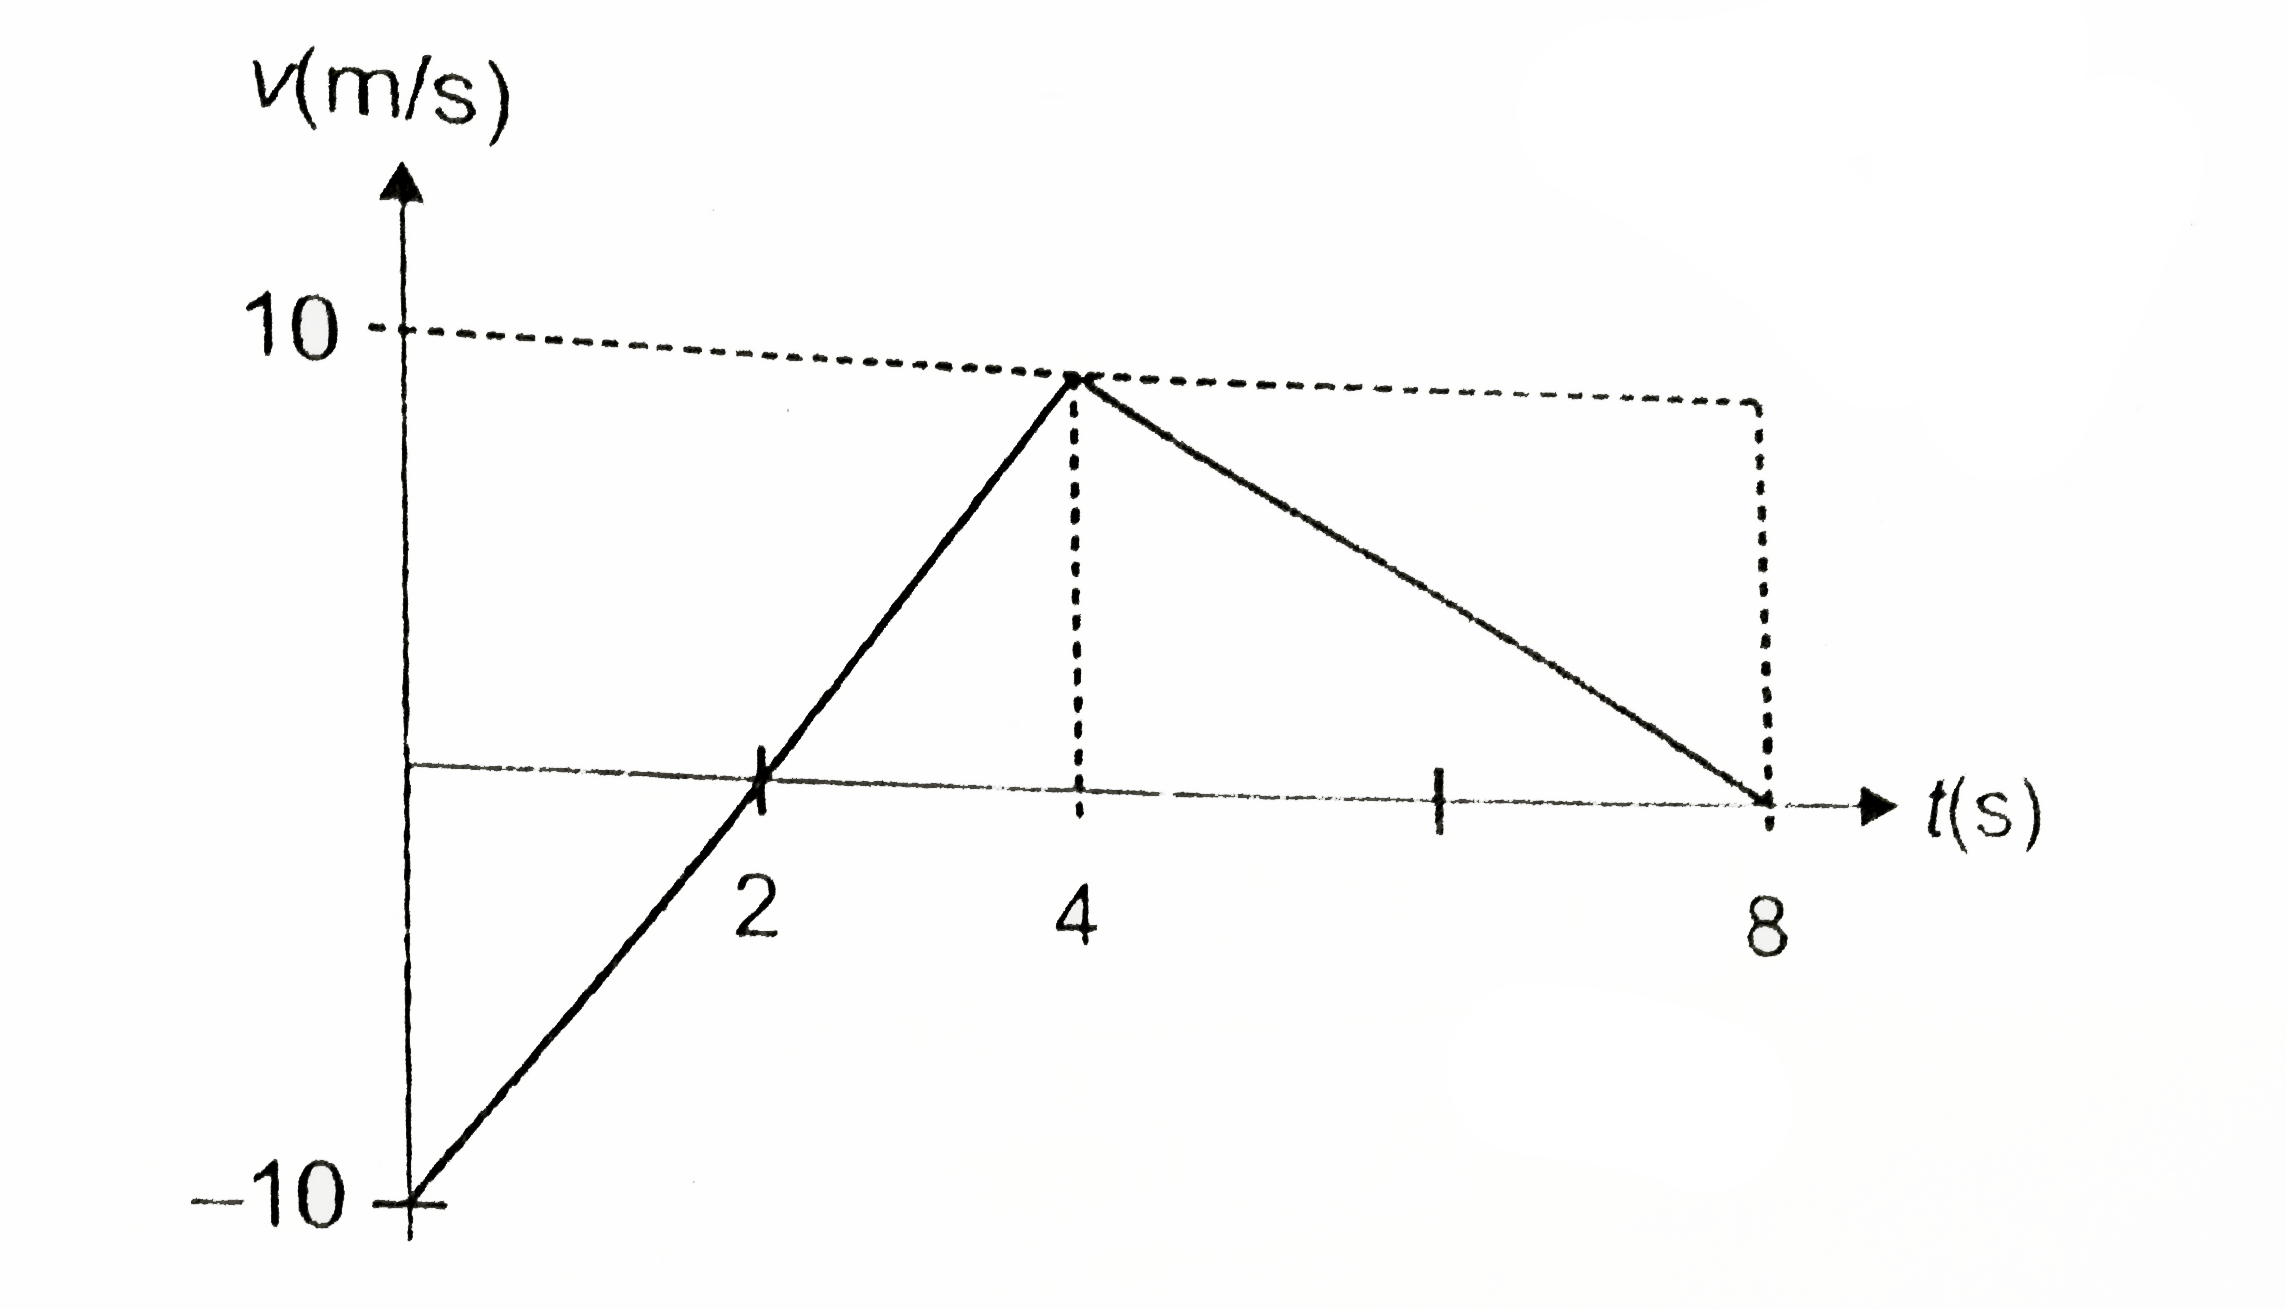
View SolutionFor the v-t graph shown in figure find the acccelertion in 0-4 sec and 4-8 sec.
View SolutionA stone is projected vertically upwards y=0 second. The net displacement of stone is zero in time interval between t=0 second to t=T seconds. Pick up the correct statement
View SolutionA car is moving on a straight road. The velocity of the car varies with time as shown in the figure. Initially (at t=0), the car was at x=0, where, x is the position of the car at any time 't'.
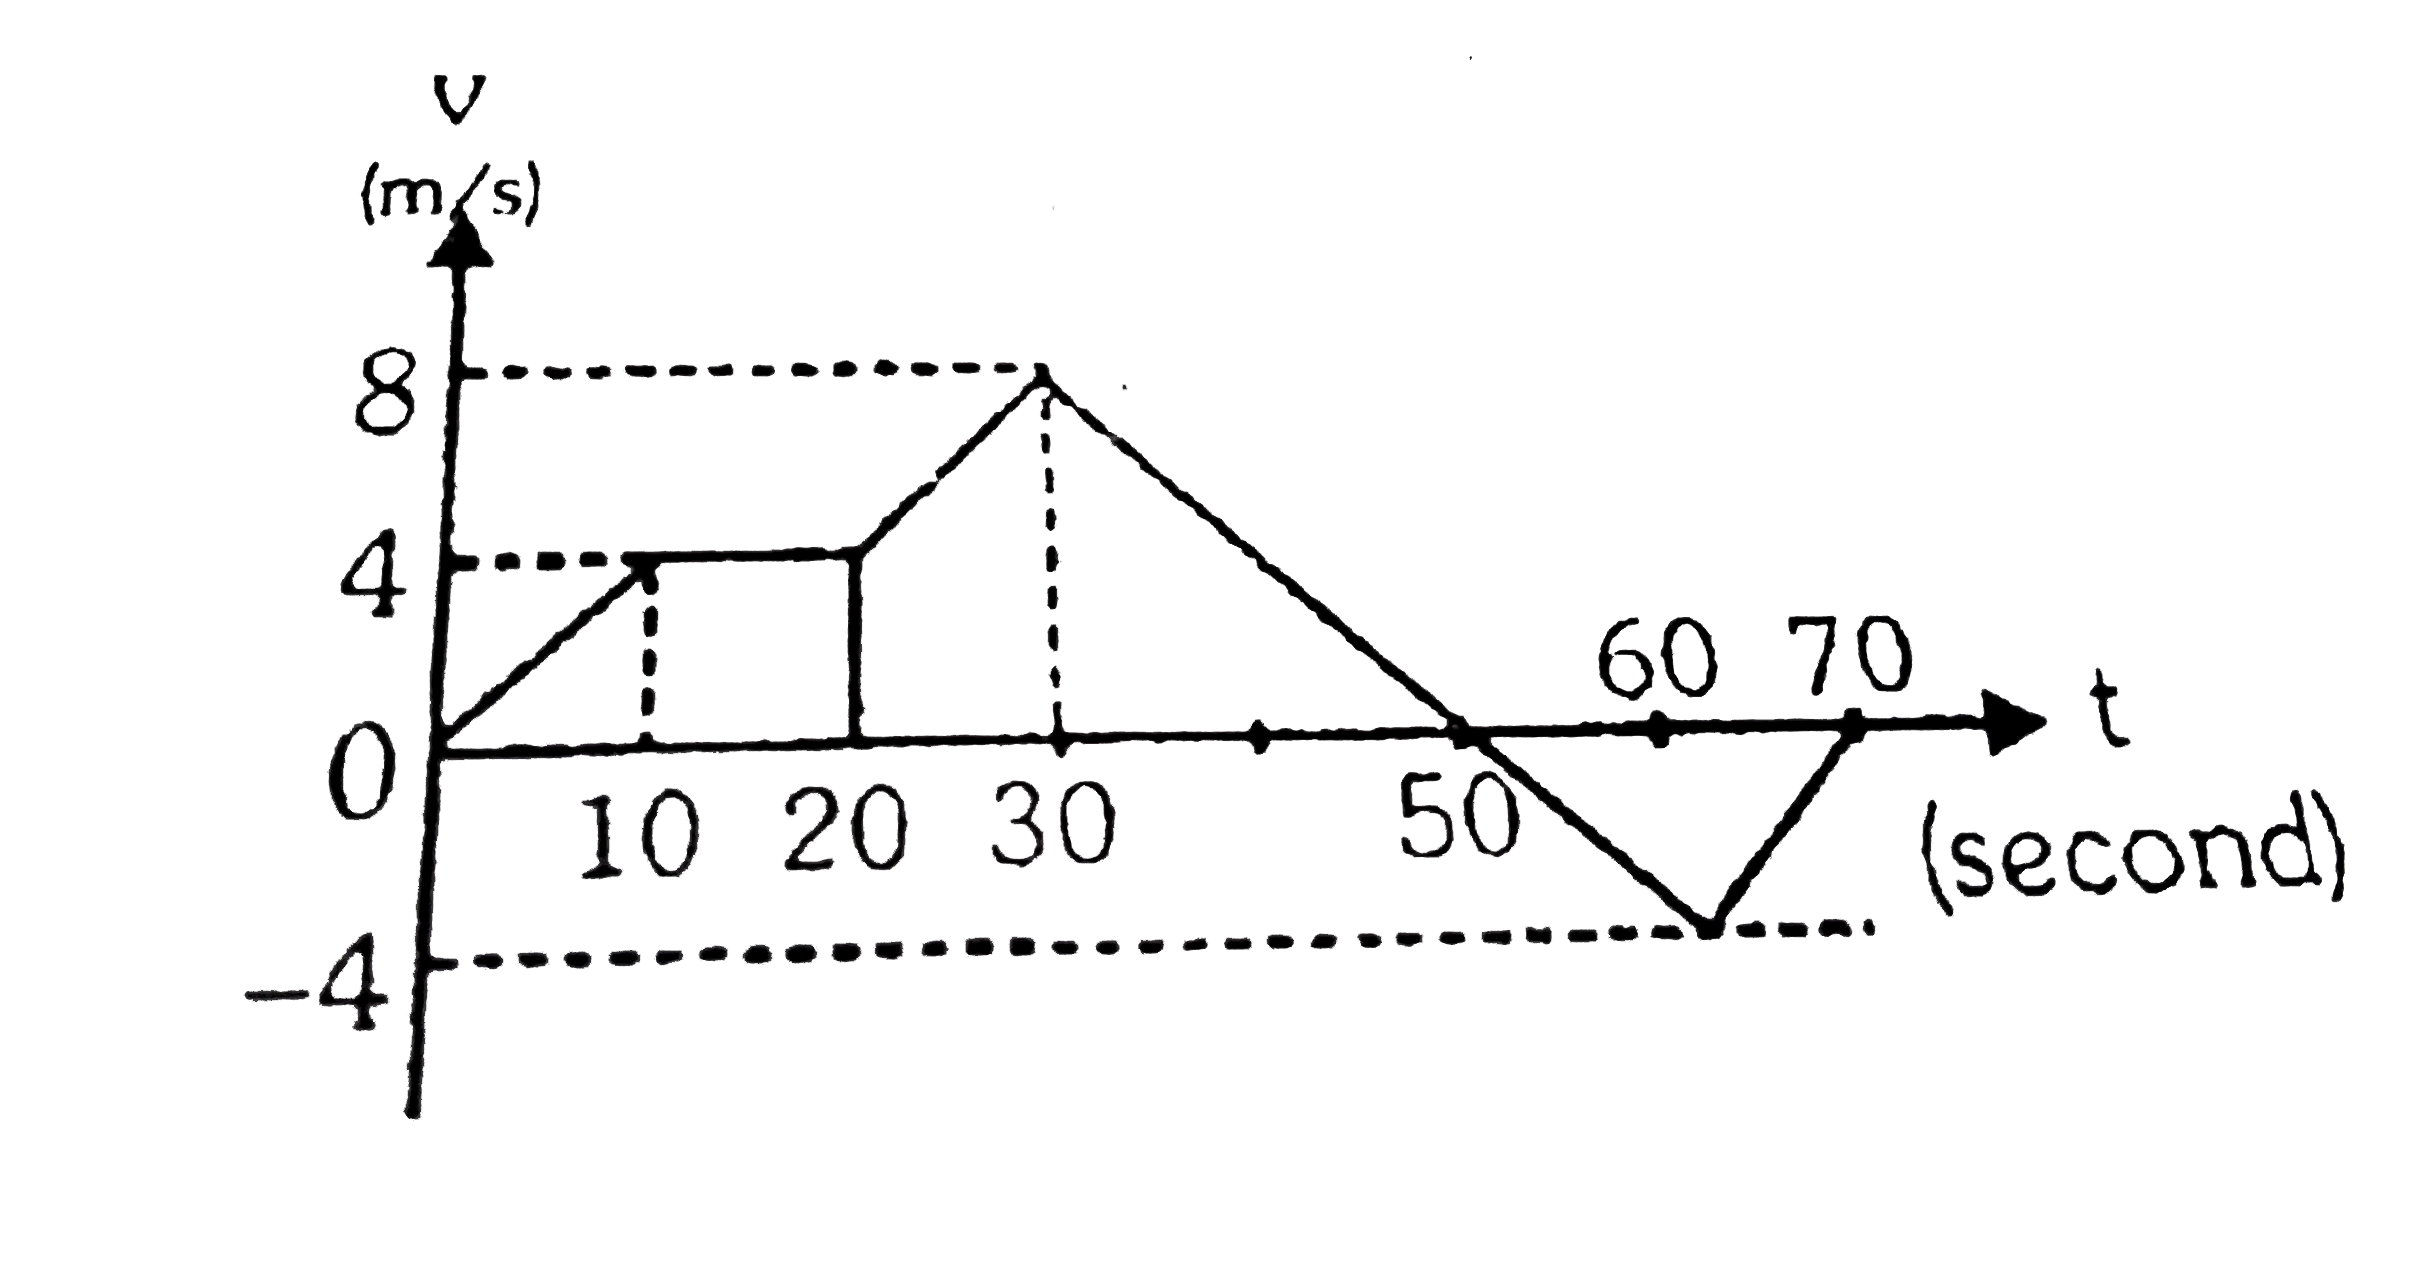
The time interval during which the car is retarding can be :-
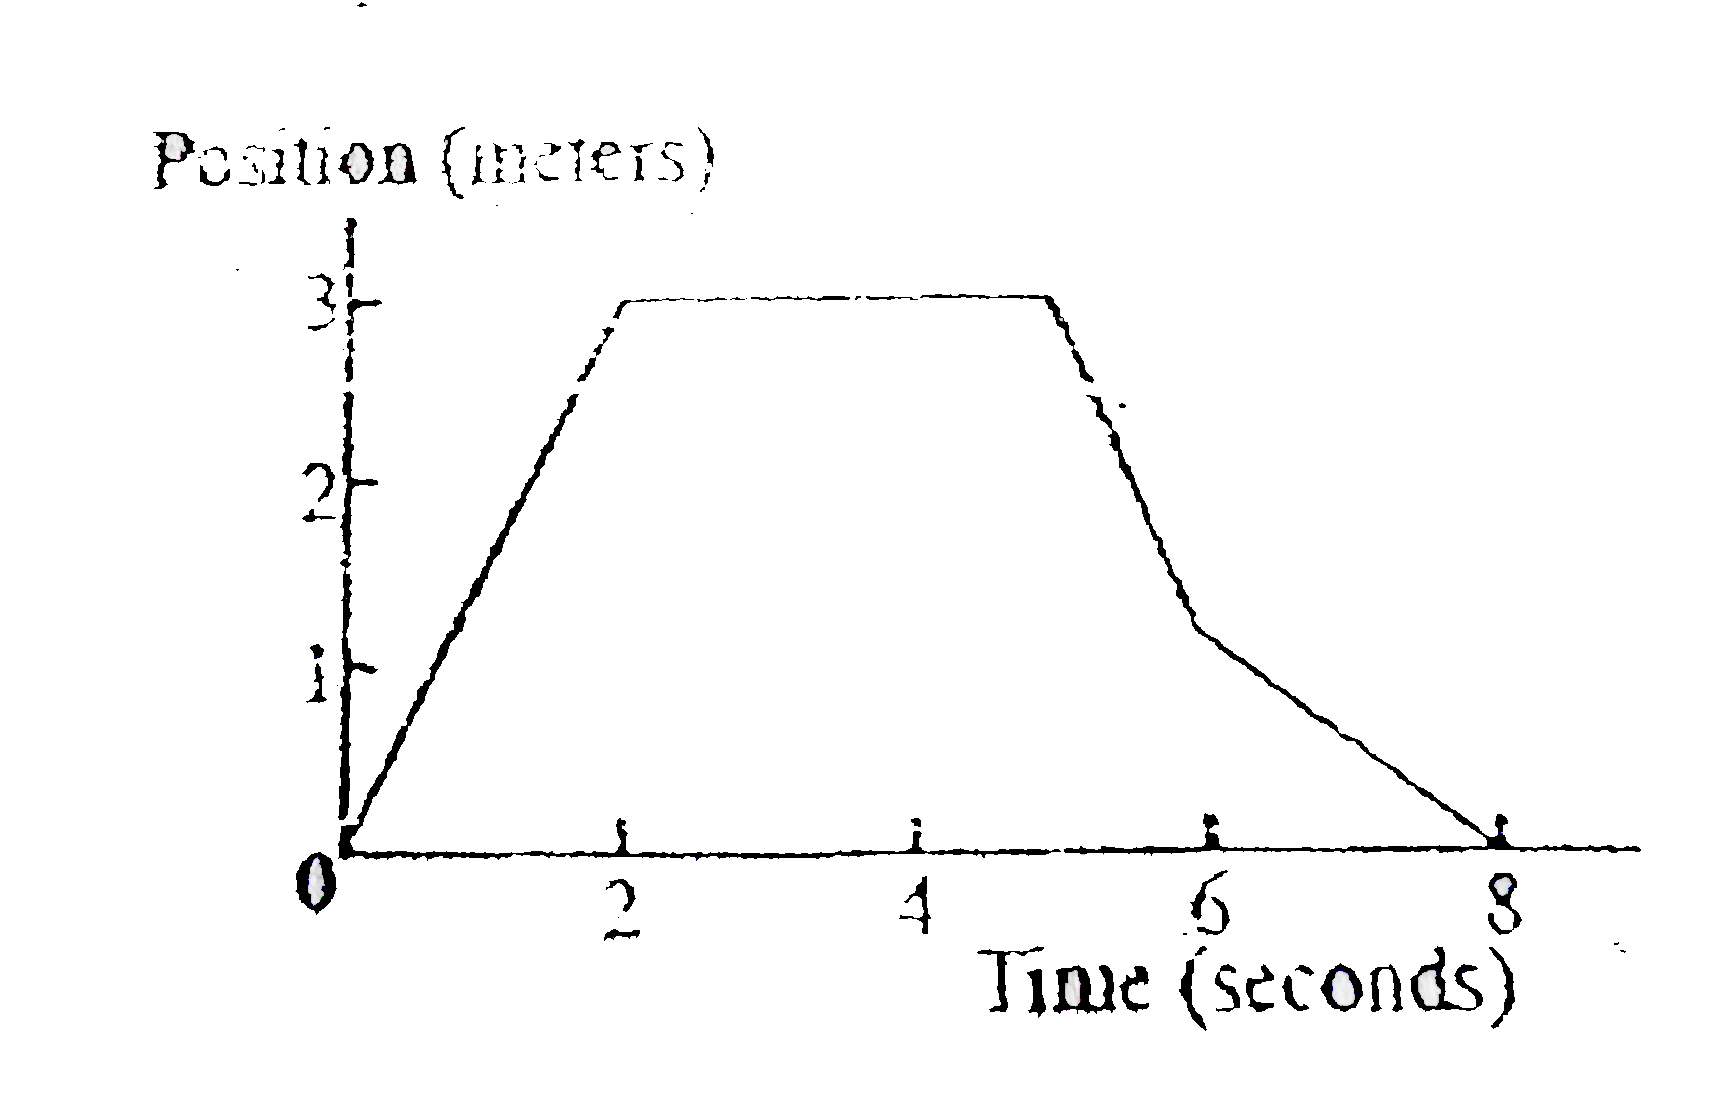
View SolutionAn object is moving in a straight line. Its position versus time graph is shown below. There is a detector at origin which analyze the motion of object between t=6 and t=8 seconds, which statement describes the motion shown in the graph.
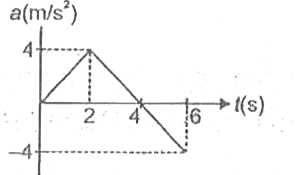
View SolutionFor the acceleration - time (a - t) graph shown in figure, the change in velocity of particle from t = 0 to t = 6 s is
View SolutionVelocity of a particle varies with time as v=4t. Calculate the displacement of particle between t=2 to t=4 sec.
View SolutionA car is moving on a straight road. The velocity of the car varies with time as shown in the figure. Initially (at t=0), the car was at x=0, where, x is the position of the car at any time 't'.
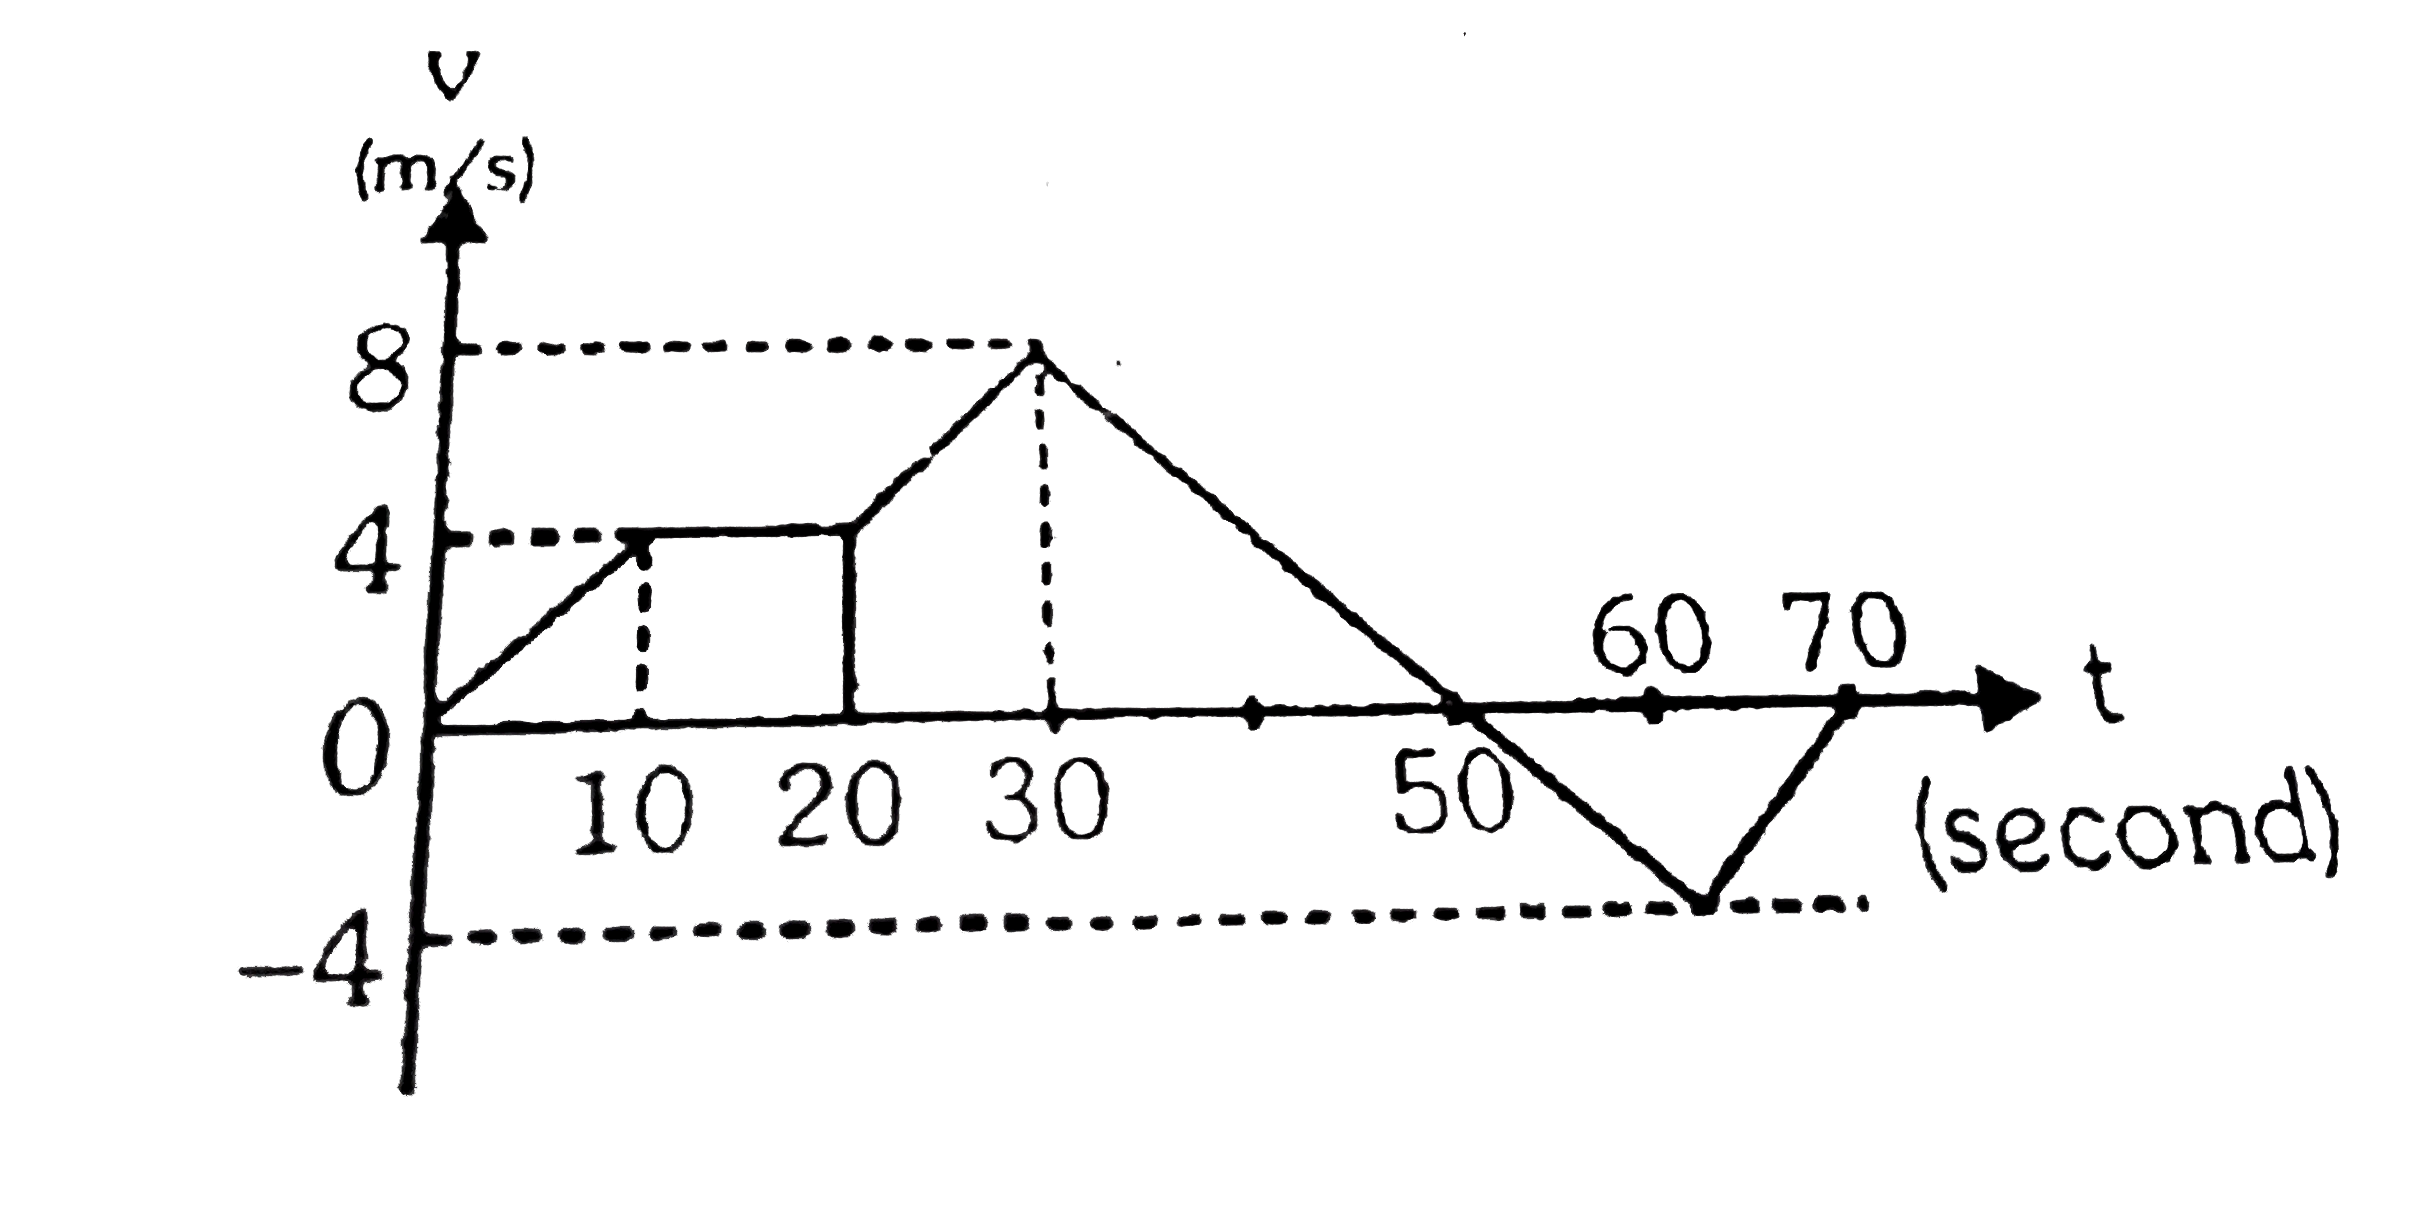
The maximum displacement from the starting position will be :-
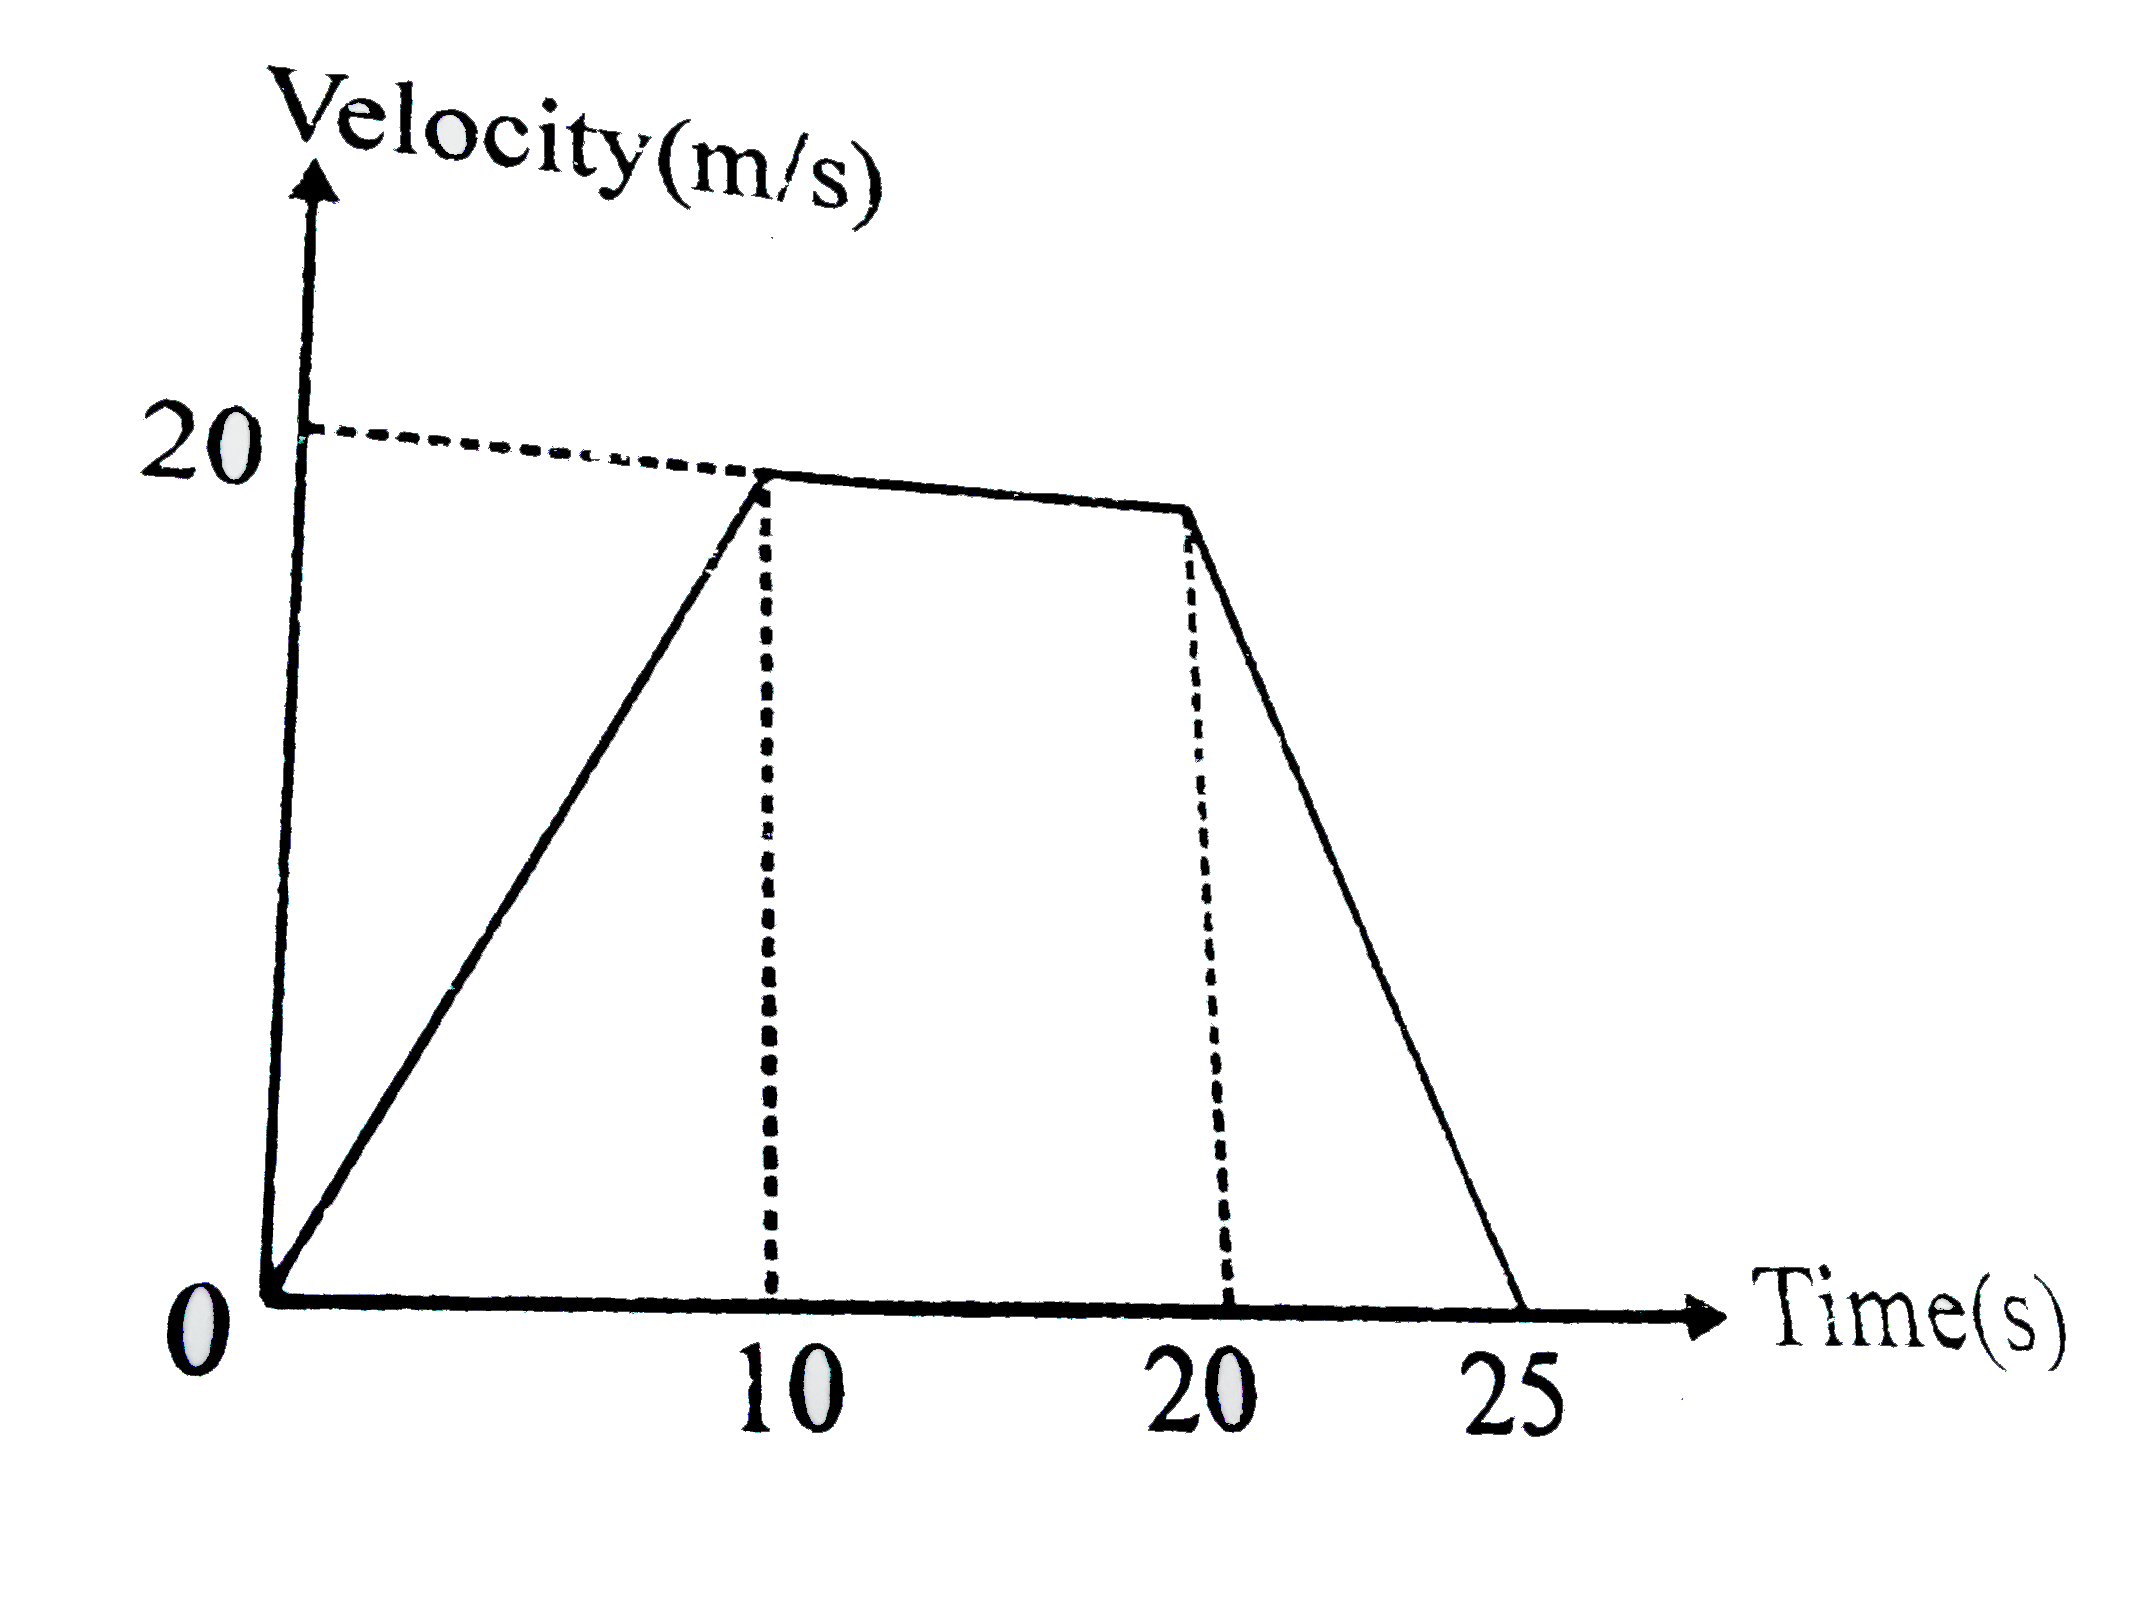
View SolutionThe velocity-time graph of a car moving along a straight road is shown in figure. The average velocity of the car in first 25 seconds is
View SolutionThe velocity and time graph for a particle moving in a straight line s shown in the figure. Then, the average velocity between t=4 s and t=6 s is _____
View Solution